

Scope
This edition covers April to June 2026 and includes data released through 31 August. China did not collapse in the second quarter. It continued to grow, but industrial production became stronger as the balance between external and domestic demand weakened. Exports, high technology and industrial policy supported output. Consumers, property and demand for long-term credit remained on the other side of the picture. This is a two-speed economy in which headline growth looks broader than it really is. July and August are used only as directional signals for Q3.
Where the Economy Stands
China is in a slowing-growth phase with a narrow domestic foundation. Real GDP rose by 4.3% from a year earlier and by a seasonally adjusted 0.9% from Q1. The rate slowed from 5.0% year on year and 1.3% quarter on quarter in Q1. This was not a synchronised deterioration. It came from a widening distance between sectors receiving orders, capital and policy support, and those depending on confidence among households and private businesses.
The production side remained the strongest. Industrial value added rose by 4.7% in Q2, manufacturing by 4.8%, and information technology, software and related services by 10.8%. High-tech manufacturing expanded by 12.8% in April, 15.1% in May and 14.1% in June from a year earlier. Exports reached $1.149 trillion during the quarter, while industrial profits in the first half were 18.7% above their year-earlier level. Chinese industrial production did not merely continue to grow. It moved at a very high speed in some technology segments.
The domestic side was much weaker. Retail sales grew by an average of only 0.2% year on year during Q2. Fixed-asset investment contracted by 5.7% in January-June, private investment by 8.5%, and property investment by 18.0%. Household loans fell by CNY 663.5 billion during the quarter. Long-term corporate loans added only CNY 130 billion, while most new corporate lending came from the short-term discounting of commercial bills.
China occupies an unusual position on the growth-inflation map. Growth is slowing and consumer inflation is weakening, which would normally create room for easing. Producer prices, however, accelerated to an average of 3.6% in Q2. This does not show overheated consumption. It shows higher upstream prices and a limited ability among many companies to pass them to the final customer. The main policy problem is therefore not a lack of banking-system liquidity. It is the weak channel from cheap money to home purchases, private investment and consumption.
Macro Verdict
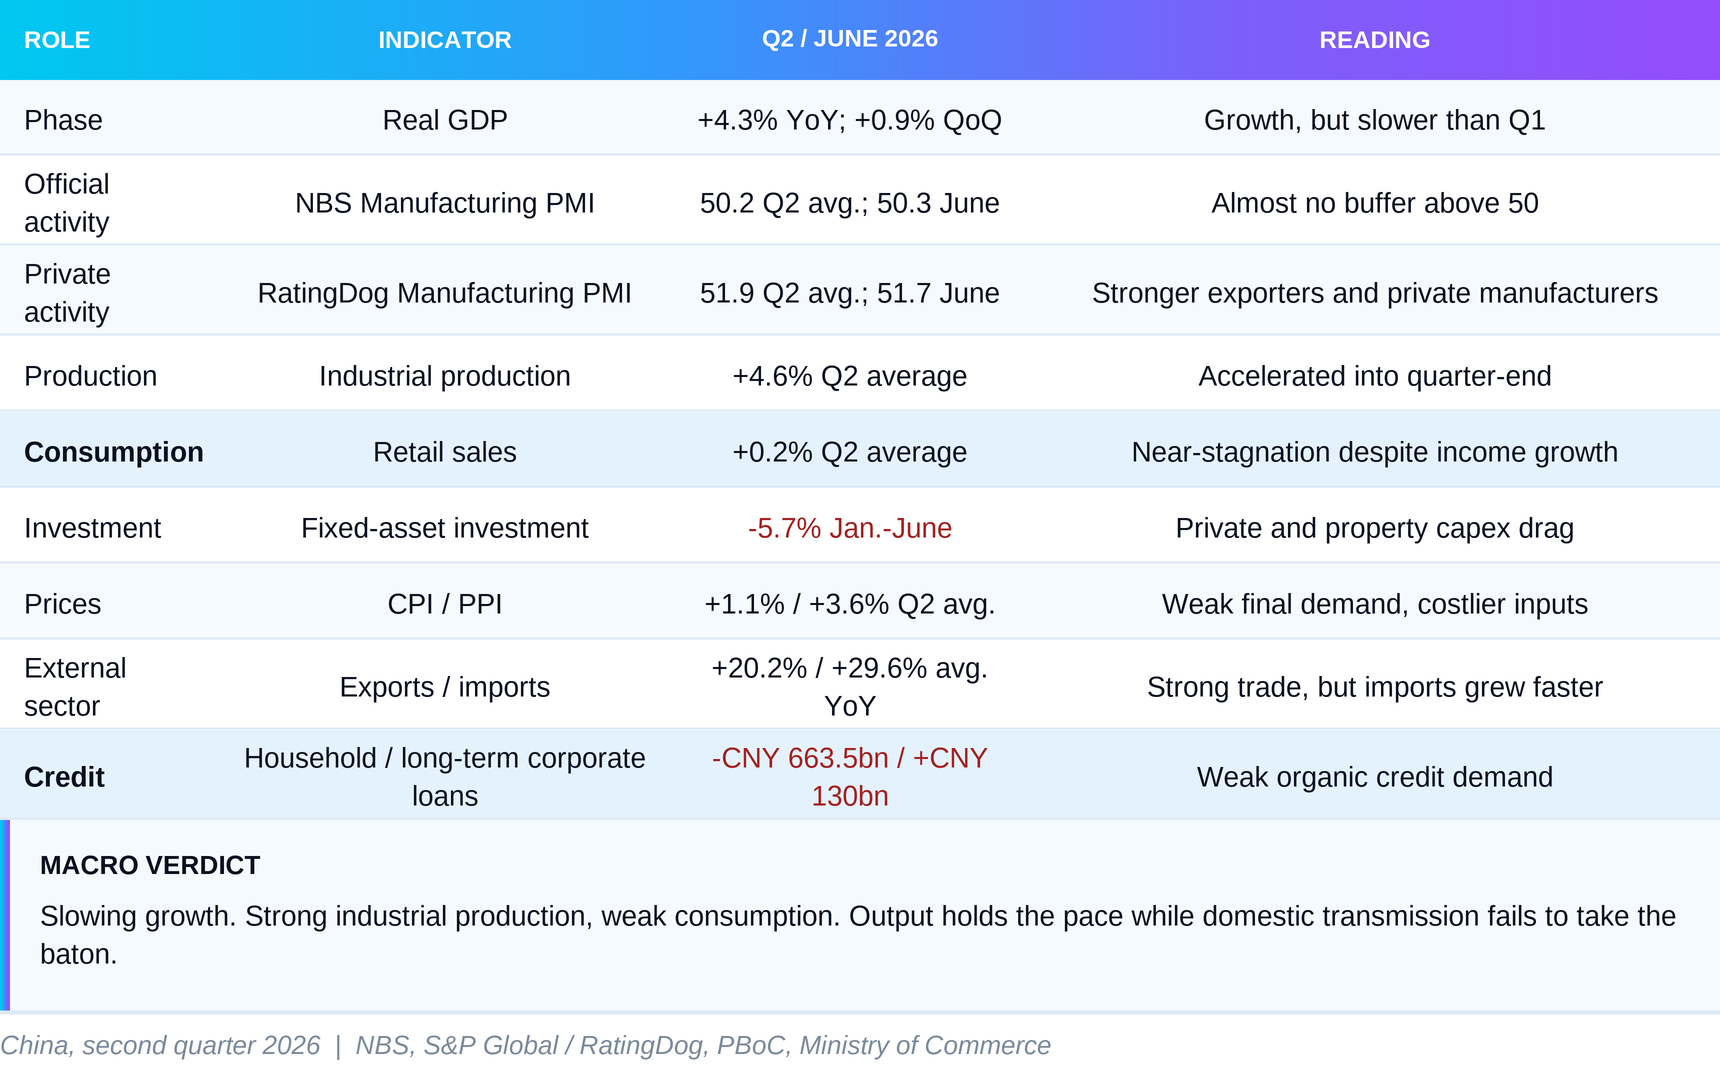
The indicators do not describe an economy on the edge of recession. They describe an economy in which positive growth is concentrated. The official PMI stood almost exactly on the boundary between expansion and contraction, while the private RatingDog survey remained comfortably above it. The difference is not an error. The surveys have different coverage and give more weight to different groups of companies. When the private index is strong but the official one barely remains above 50, the more reasonable conclusion is that certain exporters and technology companies are performing well while the improvement is not evenly distributed across the manufacturing system.
The Trajectory
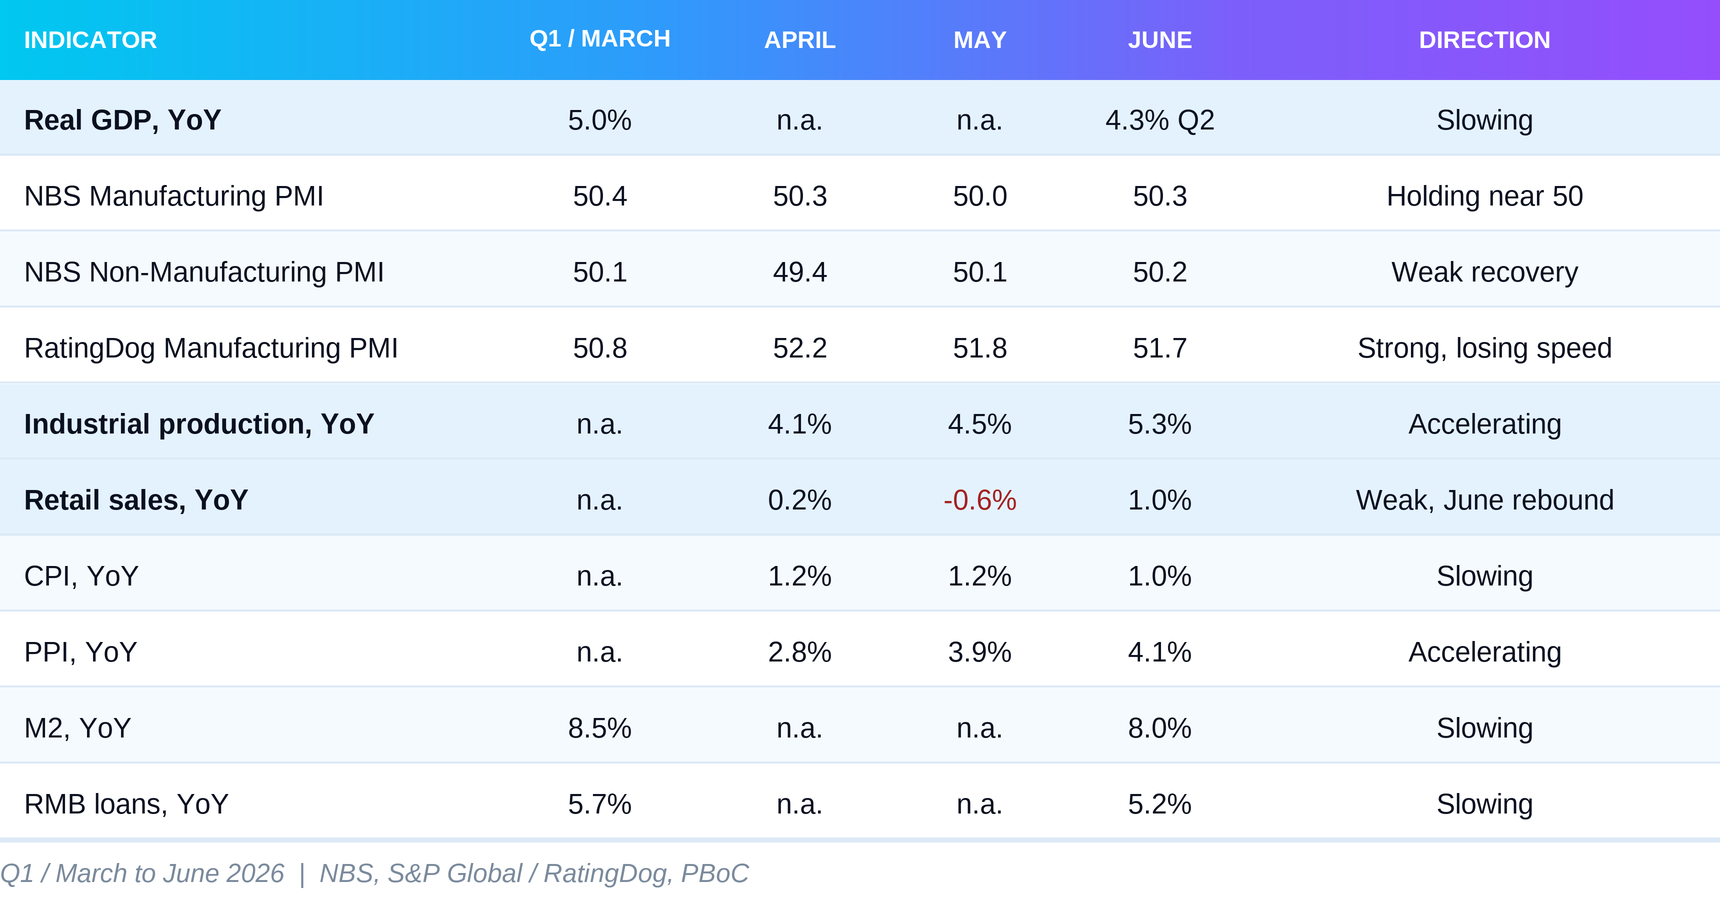
The most important feature of the trajectory is that actual output accelerated while overall growth slowed. Industrial production moved from 4.1% in April to 5.3% in June, while manufacturing output reached 6.0% at the end of the period. This does not contradict weaker GDP. Industry is only one part of the economy and can raise output even as construction contracts, consumers buy cautiously and capital spending weakens.
The PMI indices show the same divergence from another angle. The official manufacturing PMI remained between 50.0 and 50.3 during Q2. A value above 50 means that more companies report improvement from the previous month than deterioration. A distance of only a few tenths above the threshold signals very little breadth to the expansion. RatingDog was between 51.7 and 52.2, while its services index averaged 53.7. Smaller, private and more export-oriented firms in that sample appear stronger, but the official survey warns that the broad economic foundation is less healthy.
Consumption did not confirm the production impulse. Retail sales were almost unchanged in April, declined in May and recovered to only 1.0% in June. Excluding cars, the picture is slightly better, with average growth of 2.0% in Q2. Car sales, however, contracted by an average of 15.8%, too large a decline to dismiss as noise. Durable purchases are sensitive to confidence in future income, the value of housing and willingness to take on credit. All three channels remain weak.
Prices diverged further in every month. The gap between PPI and CPI was 1.6 percentage points in April, 2.7 in May and 3.1 in June. Chinese industry is paying higher prices for some raw materials, energy and technology components, while the final consumer is not accepting the same increase. Sectors with global demand and pricing power can protect margins. Companies selling mainly into a weak domestic market have less room.
August provides an early test, not a new assessment of Q2. After falling to 49.2 in July, the official manufacturing PMI recovered to 49.8. Output and new orders moved back above 50, but the non-manufacturing PMI remained at 49.0 and the composite index was 49.5. Large companies returned to expansion while medium and small firms remained below the threshold. The signal is better than July, but it is still consistent with narrow growth dependent on selected industries and larger enterprises.
What Pulled Growth Up and What Dragged It Down
China does not publish quarterly GDP contributions by expenditure component in the same detail as some developed economies. We should therefore not invent exact percentage-point contributions from consumption, investment and net exports. The production approach still allows us to see which industries expanded and which ones weighed on growth.
Services, the largest part of the economy, grew by 5.1% and represented 57.4% of nominal GDP in Q2. The differences inside the sector were large. Information technology, software and related services expanded by 10.8%, leasing and business services by 11.6%, and finance by 6.9%. Hotels and restaurants also grew by 5.8%. These are genuine sources of support and show that the domestic economy is not equally weak everywhere.
Industry added 4.7%, while manufacturing grew by 4.8%. High-tech and equipment industries expanded much faster than the overall economy. They benefited from the global computing-infrastructure cycle, the national drive for technological independence and capital spending on automation. Mechanical and electrical products reached 63.5% of Chinese exports in the first half and increased by 20.1%. This is the main link between industrial strength and external demand.
Construction contracted by 4.1%, while value added in real estate fell by 0.2%. These figures look smaller than the decline in property investment because they measure different things, but the direction is the same. New floor space started fell by 23.4%, completed space by 23.7%, and the value of sales by 13.6% in January-June. This removes orders from steel, cement, home appliances, furniture, brokers and local services. It also reduces the land revenue used by local governments to finance part of their investment.
The external sector was strong, but it needs a precise reading. Exports increased by 14.1% in April, 19.4% in May and 27.0% in June. Imports grew even faster, by 25.3%, 27.4% and 36.0%. The Q2 trade surplus reached $315.9 billion. For the entire first half, it was $576.0 billion, slightly below the same period a year earlier. Strong trade is therefore not a story of collapsing imports. It is a story of rapid growth in both flows, probably combining technology demand, higher prices for some imports and shipments brought forward.
The final balance is unusual. Sectors with access to external demand, state priorities and technology capital pull growth higher. Sectors tied to housing wealth, long-term private investment and consumer confidence pull it down. That is why industrial data can look strong while GDP slows.
The Quarter Month by Month
April began with a convincing signal from industry. The RatingDog Manufacturing PMI jumped to 52.2, its strongest Q2 reading, while the official index stood at 50.3. High-tech manufacturing grew by 12.8% and exports by 14.1%. The constraint was already visible. Retail sales added only 0.2%, car sales fell by 15.3%, and the official non-manufacturing index was 49.4. PPI increased by 1.7% during the month and by 2.8% from a year earlier. Production accelerated before the final customer gave the same signal.
The divergence became clearer in May. Industrial production accelerated to 4.5%, high-tech manufacturing to 15.1%, and the private services PMI reached 54.4. Exports and imports grew at double-digit rates. At the same time, retail sales contracted by 0.6%, car sales by 16.1%, and the official manufacturing PMI slipped to 50.0. PPI accelerated to 3.9% while CPI remained at 1.2%. May was the clearest example of a strong corporate and external flow without confirmation from consumption.
June ended the period with the strongest actual production volume. Industrial output grew by 5.3%, manufacturing by 6.0%, and the seasonally adjusted monthly increase reached 0.76%. Export growth accelerated to 27.0% and the trade surplus to $125.6 billion. Retail sales returned to growth of 1.0%, but that was weak relative to the pace of production and trade. Car sales fell again by 16.1%. CPI slowed to 1.0%, core CPI also reached 1.0%, while PPI rose to 4.1%.
July and August provide the first test of whether this structure can continue. Industrial growth slowed to 4.5% in July, retail sales to 0.6%, and the official composite PMI fell to 49.3. The manufacturing PMI recovered in August, but the composite remained below 50. This is not enough to signal recession. It is enough to show that Q2’s exit speed is not guaranteed for the entire economy.
The Engine
The main engine is the combination of technology manufacturing, external demand and industrial policy. The clearest evidence is not only output growth, but also the concentration of profits. In the first half, profits in computers, communications and electronic equipment increased by 96.9%. The rise was 99.4% in non-ferrous metals and 67.8% in chemical raw materials and products. Total industrial profits grew by 18.7%, but the average hides an enormous difference between winning and lagging industries.
The AI cycle is a real part of this engine. Global investment in data centres, power infrastructure, semiconductors and computing equipment creates orders across a long supply chain. China participates through components, electrical equipment, materials and production machinery, not only through final devices. High-tech manufacturing expanded by 13.3% in the first half and equipment manufacturing by 9.3%. Both were well above the overall industrial increase of 5.4%.
The second layer is the policy of technological independence. It directs credit, subsidies, public procurement and research spending towards strategic industries. Investment in intellectual-property products grew by 9.4%, while technology loans increased by 12.6% at the end of June. Utilised foreign capital in high technology reached CNY 170.3 billion and rose by 33.2%, even as total foreign direct investment contracted by 5.0%. This is another example of narrow growth. Capital is not abandoning everything Chinese. It is concentrating in selected sectors.
The third layer is exports. Mechanical and electrical products account for almost two-thirds of merchandise exports. Private enterprises hold 57.0% of total trade and increased their flows by 17.0% in the first half. Some of the most competitive private firms remain able to gain global market share.
There are three constraints. First, part of the nominal growth in technology exports probably comes from prices rather than physical volumes alone. Second, the more China uses foreign markets as an outlet for rapidly expanding capacity, the greater the risk of tariffs, anti-dumping investigations and local-production requirements. Third, manufacturing capacity is not fully used. Overall utilisation fell to 73.0% in Q2 from 73.6% in Q1 and was 1.0 percentage point below its year-earlier level.
Capacity is the critical test of sustainability. Utilisation in computers and electronics was high at 78.7%. It stood at 70.8% in cars and 70.3% in electrical equipment. In non-metallic mineral products, which are closely tied to construction, it was only 59.6%. There is no single form of Chinese excess capacity. There are technology segments with high utilisation and orders, and traditional industries in which weak property and domestic cycles leave machinery and labour underused.
The engine will remain strong if global technology capital spending continues, new export orders hold up and profits turn into productive investment. It will weaken if trade restrictions hit physical volumes, higher raw-material prices compress margins, or companies accumulate inventories faster than sales. Inventories were already growing by 9.5% in June and 10.8% in July. The difference between producing for an actual order and producing for storage will become increasingly important.
The Brake
The brake is the balance sheet of households and the private sector. The property crisis is at the centre of the problem, but its impact is broader than construction. Housing is a major asset for many Chinese families. When its price falls, a household does not necessarily lose current income, but it loses confidence in its wealth. Large purchases become easier to postpone and willingness to take on a new mortgage declines.
The data show that the sector did not reach a bottom in Q2. Property investment contracted by 18.0% in the first half, new floor space started by 23.4%, completed space by 23.7%, and funds raised by developers by 20.2%. Domestic bank lending to the sector fell by 31.7%, deposits and advance payments by 15.8%, and individual mortgages by 24.9%. Residential and commercial floor space available for sale remained at 763.2 million square metres. Construction, sales and financing are contracting together.
Prices also failed to confirm broad stabilisation. New-home prices in tier-one cities rose by 0.1% from May in June but remained 1.3% below their year-earlier level. Annual declines in tier-two and tier-three cities were 3.1% and 4.2%. Existing homes fell more sharply, by 4.9% in tier-one, 5.4% in tier-two and 6.0% in tier-three cities. Only 20 of 70 cities reported a monthly rise in new homes, and only 9 did so for existing properties.
The property decline is passing into local budgets. Local-government revenue from land-use rights fell by 31.5% in January-June. Total government-fund revenue dropped by 21.6% and spending by 16.4%. The general budget looks more stable, with revenue growth of 4.7%, but current spending by local governments increased by only 0.6%. Beijing can announce substantial special-bond quotas without a broad local fiscal impulse appearing immediately in construction, services and private orders.
Consumption shows the second channel. Per-capita income increased by 5.2% in nominal terms and 4.2% in real terms in the first half. Per-capita consumer spending rose more slowly, by 3.7% and 2.7%. Property income added only 1.1%. This does not automatically prove that every household is saving more, but it is consistent with precautionary behaviour. Families receive more income without turning all the additional resources into spending, especially when housing wealth and the employment outlook remain uncertain.
Credit is the third and cleanest channel. Household loans fell by CNY 663.5 billion in Q2. The decline included short-term borrowing, often linked to current consumption, and long-term lending, where mortgages matter greatly. This does not resemble households responding aggressively to low interest rates. The average rate on new mortgages was 3.1% in June, but cheap credit does not compensate for weak expectations about the asset it finances.
The corporate picture is less negative, but it also does not show a new broad investment cycle. Corporate loans increased by CNY 2.53 trillion in Q2. Only CNY 130 billion of that was long term. Investment in equipment rose by 8.1%, but construction and installation investment fell by 8.0%, manufacturing investment by 1.2%, and private investment by 8.5%. Capital is going towards replacement and technology equipment in priority segments without becoming a general expansion of capacity.
The brake is structural because it combines a long property correction, high debt among developers and local entities, adverse demographics and an income model that gives more weight to investment than consumption. There is also a cyclical part. Stronger services, stable employment and recovering home prices could improve confidence. Until sales, mortgages and long-term private loans turn higher, cheap liquidity will have a limited multiplier.
Prices
Consumer inflation is not China’s main threat. CPI was 1.2% in April and May and slowed to 1.0% in June. The Q2 average was 1.13%. Core inflation, excluding food and energy, declined from 1.2% to 1.0%, with an average of 1.10%. That is too little pressure to describe overheated domestic demand. It is more consistent with a cautious consumer and strong competition in final goods and services.
PPI tells another story. Producer prices rose by 2.8% in April, 3.9% in May and 4.1% in June. The average increase of 3.6% is an acceleration, not cooling. Part came from mining, metals, chemical products and energy inputs. Part is linked to global demand from AI and electrical supply chains. High PPI should not be interpreted as evidence that Chinese consumers have started spending more strongly.
The gap between the two indices is more useful than either one alone. When PPI accelerates and CPI slows, companies have three options. They can raise final prices, accept a lower margin or cut other costs. Export technology firms facing scarce supply have more pricing power. Producers of cars, construction materials and mass-market consumer goods face greater pressure. This is visible in profits. The car sector was 19.5% below its year-earlier level and non-metallic mineral products were down 47.8%, while electronics almost doubled profits.
For monetary policy, this combination argues for targeted action rather than mechanical broad easing. Weak CPI creates room for a lower cost of finance. Accelerating PPI warns that part of the problem comes from supply and sector concentration, which a general rate cut does not solve. More importantly, an already low interest rate does not create mortgage or investment demand by itself.
July showed some retreat in producer pressure. PPI slowed to 3.5% and fell by 0.7% from June, while CPI declined to 0.5%. This reduces the risk of immediate pass-through to consumers, but raises the question of whether weak final demand is starting to cool factory-gate prices. The coming months must show whether Q2 marked the peak in PPI or the beginning of a longer price wedge.
The Underappreciated Detail
The most underappreciated detail is the composition of corporate credit. Nearly three-quarters of new corporate lending in Q2 came from the short-term discounting of commercial bills, often described as bill financing. This helps companies fund day-to-day operations, but it is not evidence of a new investment cycle. Long-term corporate loans increased by only CNY 130 billion.
A commercial bill is a promise by one company to pay a set amount to another at a future date. The recipient does not have to wait until maturity. It can take the bill to a bank and receive the money earlier in exchange for interest. A sale made on deferred payment terms becomes liquidity today. The instrument is useful for working capital, supplies and short-term cash flow. It is not the same as a multi-year loan for a new plant, production line or major expansion.
Corporate loans increased by CNY 2.53 trillion in Q2. Bill financing added CNY 1.914 trillion, or 75.7% of the total rise. Short-term corporate loans added another CNY 460 billion, while long-term loans added only CNY 130 billion. The composition shows banks and companies supporting current payments without taking broad long-term risk.
This changes the reading of the headline credit numbers. A large nominal flow towards companies can look like strong investment demand. If most of that flow is short term and backed by trade receivables, the signal is closer to liquidity management. A genuine new capital cycle would require simultaneous acceleration in long-term corporate borrowing, private investment, equipment orders and capacity utilisation.
What It Means
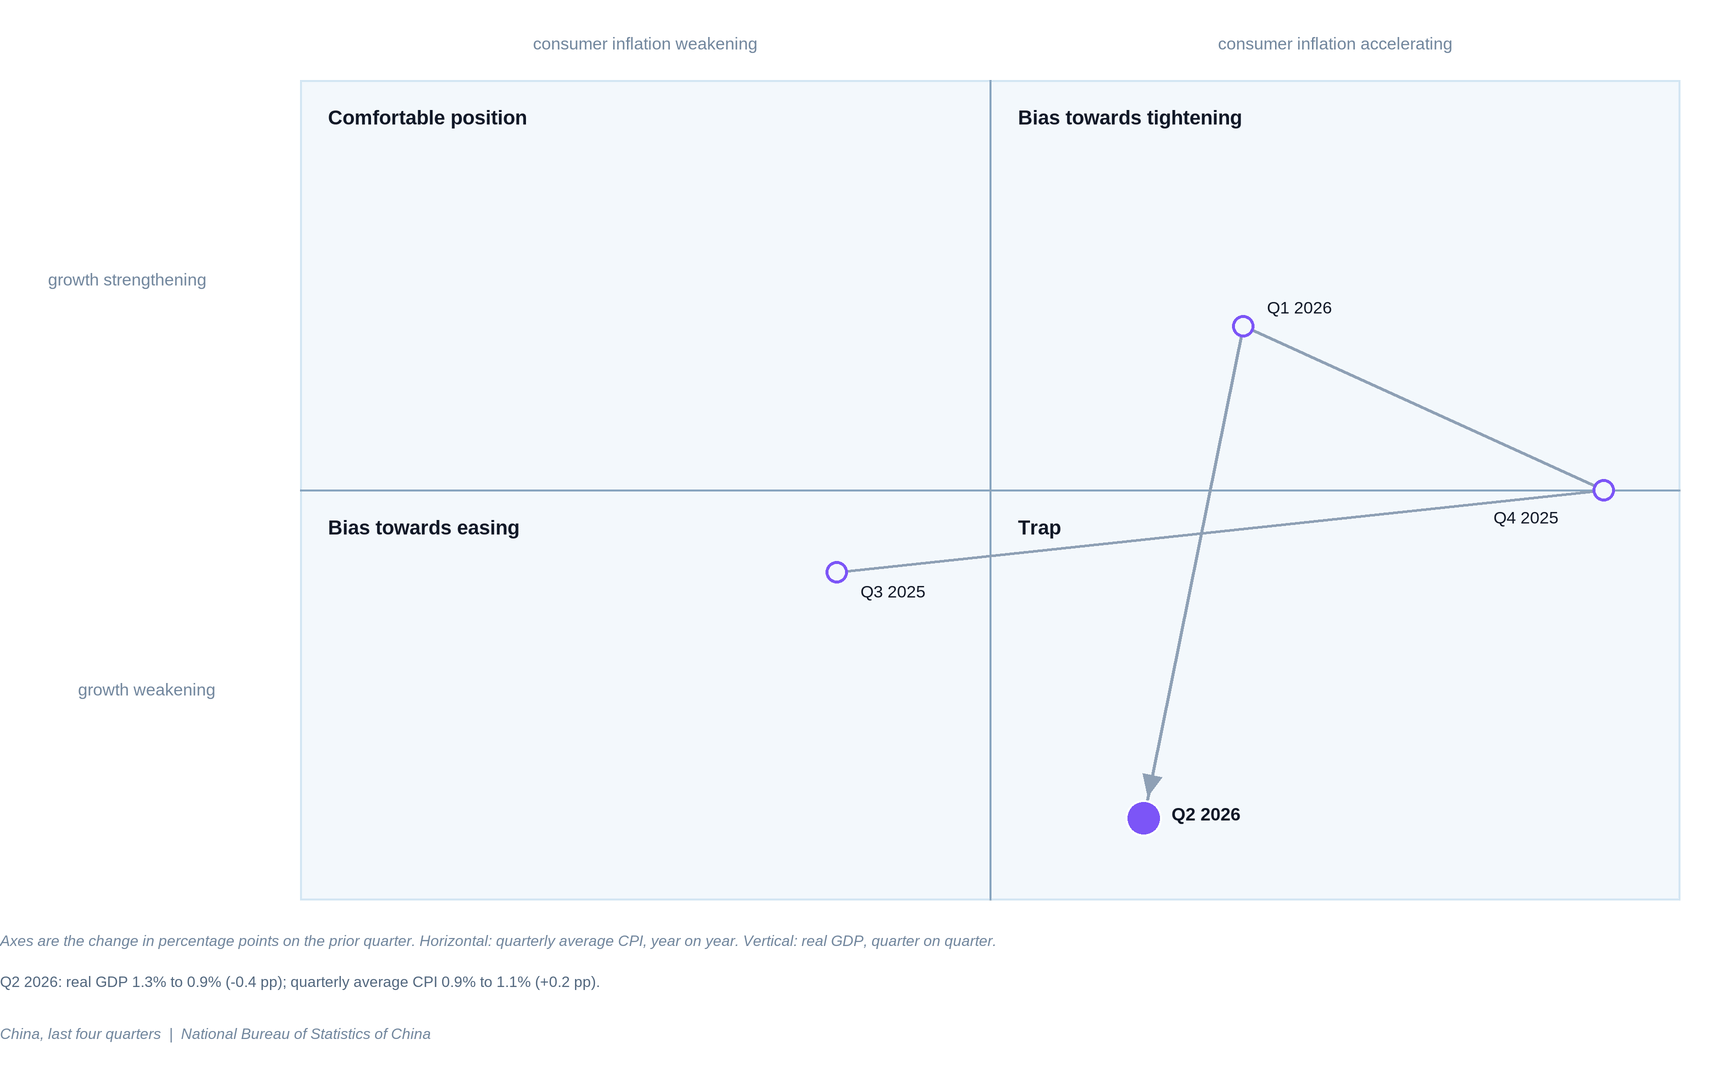
The first implication for the PBoC is that China does not have a classic shortage of bank liquidity. M2 grew by 8.0% in June, interbank rates remained low, and the average rate on new corporate loans was 3.0%. The one-year and five-year loan prime rates remained at 3.0% and 3.5%. The central bank cut rates on some structural tools by 25 basis points and continued to direct credit towards technology, green projects, small businesses and other priority areas.
The second implication is that another general rate cut would probably have less effect than measures changing expected returns and risk. A household will not take a mortgage simply because it is slightly cheaper if it expects the home price to keep falling. A private company will not build new capacity only because the rate is lower if domestic demand is weak and existing facilities are underused. Interest rates are a condition, but not a sufficient engine.
The most effective policy would therefore be a combination. Monetary policy can maintain a low cost of finance and avoid sudden tightening. Fiscal policy needs to stabilise income and consumption more directly, rather than focusing only on investment supply. Property policy needs to reduce uncertainty around unfinished homes, inventories and financing for viable projects. Local governments need a replacement revenue channel because falling land sales limit their ability to maintain services and investment.
Not all stimulus produces the same macroeconomic result. Additional credit to high-tech manufacturing can raise exports, productivity and strategic autonomy. It can also expand capacity faster than domestic demand and intensify trade tension. Transfers to households, social services or more secure home completion have a more direct chance of reducing precautionary saving. The policy choice is between further expansion of industrial capacity and stronger domestic demand.
China remains a two-sided factor for global liquidity. Strong exports of machinery, electronics and industrial goods increase supply to the rest of the world and can constrain final prices. At the same time, high Chinese imports in Q2 supported demand for raw materials, components and energy. If this is sustained volume growth, the effect is positive for foreign suppliers. If much of it reflects prices or orders brought forward, the support will fade later.
The renminbi appreciated by 3.0% against the dollar from the end of 2025 to the end of June, while the CFETS index rose by 4.7%. This gives the PBoC more freedom to maintain easy conditions without immediate depreciation pressure. A stronger currency and trade restrictions can still reduce the price advantage of exports, so policy is likely to remain targeted and attentive to the exchange rate.
The practical conclusion is that headline aggregates reveal less than their composition. What matters is not only total credit, but its maturity and recipient; not only exports, but volumes and product concentration; not only industrial profits, but the sectors creating them; and not only PMI, but the gap between large and small companies. As long as these splits remain polarised, Chinese growth will stay positive but vulnerable to the loss of one of its few strong engines.
What We Said Before
This is the first quarterly Macro Pulse for China, so the review is against our earlier monthly analyses. Our central claim was that China was growing through production, technology and exports while consumption, private investment and property lagged. Q2 confirmed that framework. High-tech manufacturing and electronics profits accelerated, trade remained strong, and retail sales and property investment were weak.
The claim that property is a structural problem rather than a short monthly correction was also confirmed. Sales, construction starts, financing and prices remained under pressure. Monetary transmission into private demand was weak, but the composition of credit provides a better explanation than the label “liquidity trap.” Liquidity is available. There are not enough borrowers willing to use it for long-term risk.
Two earlier formulations need to be softened. First, strong exports cannot be explained only by shipments brought forward ahead of tariffs. This is a plausible factor and a risk for H2, but imports also rose sharply and the technology cycle is real. Second, the data do not show that state-owned companies are the only recipients of stimulus. Their profits are growing faster than those of private firms, but private enterprises hold a large share of trade and the private PMI survey was strong. The more accurate thesis is sectoral and policy concentration, not the complete exclusion of private business.
The Argument Against Our Reading
The strongest argument against the weak-balance thesis is that the economy may be in the early stage of a successful shift towards more productive sectors. GDP is still growing by 4.3%, services by 5.1%, high-tech manufacturing at a double-digit rate, and unemployment was 5.0% in June. Real household income is rising by 4.2%, the private services PMI is above 54, and June retail sales have returned to positive territory. From this perspective, weak property is not proof of broad weakness. It is the painful reallocation of capital from low-productivity construction towards technology and modern services.
This argument has serious evidence behind it. Equipment investment is growing by 8.1%, electronics capacity utilisation is 78.7%, high-tech foreign investment is up 33.2%, and private companies continue gaining foreign markets. If productivity rises enough, China can maintain respectable real growth with less construction and slower credit. A smaller property sector would then reduce financial distortions rather than lead to prolonged stagnation.
The reason not to adopt this optimistic reading as the central case is the lack of broad domestic transmission. Retail sales are barely growing, private investment is contracting, household credit is falling and long-term corporate lending is minimal. Overall industrial capacity utilisation is declining, inventories are rising and the August composite PMI is below 50. Productive rebalancing should gradually create income, spending and private capital appetite beyond the narrow winning sectors. That is not yet visible clearly enough.
What would prove that our reading is too cautious? Three things need to appear together by the end of Q3: retail sales excluding cars holding above 3% year on year; private investment and long-term corporate lending turning convincingly higher; and the official composite PMI remaining above 50 with improvement among medium and small companies. If that happens, the technology engine will have started pulling the rest of the economy.
Risks in Both Directions
The upside risk is that the global technology cycle proves stronger than expected. If orders for electronics, electrical equipment and machinery remain high, profits can finance new investment and jobs. Faster completion of unfinished homes, stabilising prices and more direct support for households would reduce precautionary behaviour. Growth could then move back towards 5% without property returning to its old scale.
The downside risk is that the divergence closes through weakness. New tariffs or lower global AI capital spending would hit the export engine. If that happens before consumption and private investment have recovered, industrial inventories and spare capacity will increase. A further fall in home prices would constrain mortgage demand and local land revenue. The most dangerous combination is weaker exports, a continuing property decline and credit that remains short term.
What to Watch
On 1 September, the RatingDog Manufacturing PMI for August will show whether July’s cooling has reached the private survey. A reading below 50 would be the warning threshold. On 3 September, a composite RatingDog PMI below 50 would confirm a broader contraction. On 9 September, CPI below 0.5% with PPI above 3% would widen the price wedge.
On 15 September, August industrial production, retail sales, fixed-asset investment and property data will test the domestic balance. Retail growth above 3% and a smaller decline in private investment would improve the picture. Credit and total social financing are due around the middle of the month. Sustained positive household lending and long-term corporate borrowing matter more than the total flow.
The phase-change threshold arrives with the official PMI on 30 September. A composite reading above 50 with manufacturing new orders also above 50 would signal renewed breadth. The first Q3 GDP estimate on 19 October provides the harder test. Growth of at least 4.5% with stronger consumption would challenge the scenario of further narrowing.
Closing
China ended Q2 with industrial production strong enough to avoid a sharp slowdown, but without a domestic balance strong enough to produce broad acceleration. Technology, exports and industrial policy are holding up the structure. Property, household credit and long-term private capital remain the weak supports. The next phase will not be decided by whether the system has more liquidity. It will be decided by whether households and companies find a reason to turn it into spending and long-term investment.
Sources
National Bureau of Statistics of China: Preliminary Accounting Results of GDP for the Second Quarter and the First Half of 2026 - GDP, sector value added and nominal shares.
National Bureau of Statistics of China: National Economy in the First Half of 2026 - overview, industry, trade, fixed investment, employment and services.
NBS Manufacturing and Non-Manufacturing PMI, April 2026, May 2026 and June 2026 - official Q2 PMI readings.
NBS Purchasing Managers’ Index for July 2026 and August 2026 - early Q3 direction.
S&P Global / RatingDog China General Manufacturing PMI, April 2026 and May 2026 - private manufacturing survey.
S&P Global / RatingDog China General Services PMI, April 2026, May 2026 and June 2026 via MarketScreener - private services survey.
Trading Economics: RatingDog China Manufacturing PMI - June reading and quarterly series.
NBS industrial production: April 2026, May 2026, June 2026 and July 2026.
NBS retail sales: April 2026, May 2026, June 2026 and July 2026.
NBS Income and Consumption Expenditure in the First Half of 2026.
NBS CPI: April 2026, May 2026, June 2026 and July 2026.
NBS PPI: April 2026, May 2026, June 2026 and July 2026.
NBS Investment in Real Estate Development in the First Half of 2026.
NBS Industrial Profits in the First Half of 2026 and January-July 2026.
Ministry of Commerce foreign trade releases: April 2026, May 2026 and first half of 2026 via the GACC quick-release mirror.
People’s Bank of China financial statistics: first half of 2026, official mirror and Q1 2026, official mirror.
People’s Bank of China: Q2 2026 Monetary Policy Report, official mirror.
Ministry of Finance: Fiscal Revenue and Expenditure in the First Half of 2026.
Ministry of Commerce: Foreign Direct Investment, January-June 2026.
NBS Regular Press Release Calendar for 2026 and S&P Global PMI release calendar.
Data cutoff: 31 August 2026. July and August observations are used only as directional signals for Q3 and are excluded from Q2 averages and phase classification.
Not financial advice.