

Weekly Credit Markets Monitor | Liquidity Desk
This week, Liquidity Desk reached 100 subscribers. A small number by many standards, but a real milestone for me, because every single one of you chose to be here deliberately.
As a thank you, this week I’m opening Credit Pulse to everyone. Normally it’s paid content, available to paid subscribers only. You’ll see what we track every week and why I think credit markets are saying something important right now. And as you know, credit leads, equity follows.
If you like the format, you know what to do.
Credit regime this week: NEUTRAL with a warning flag
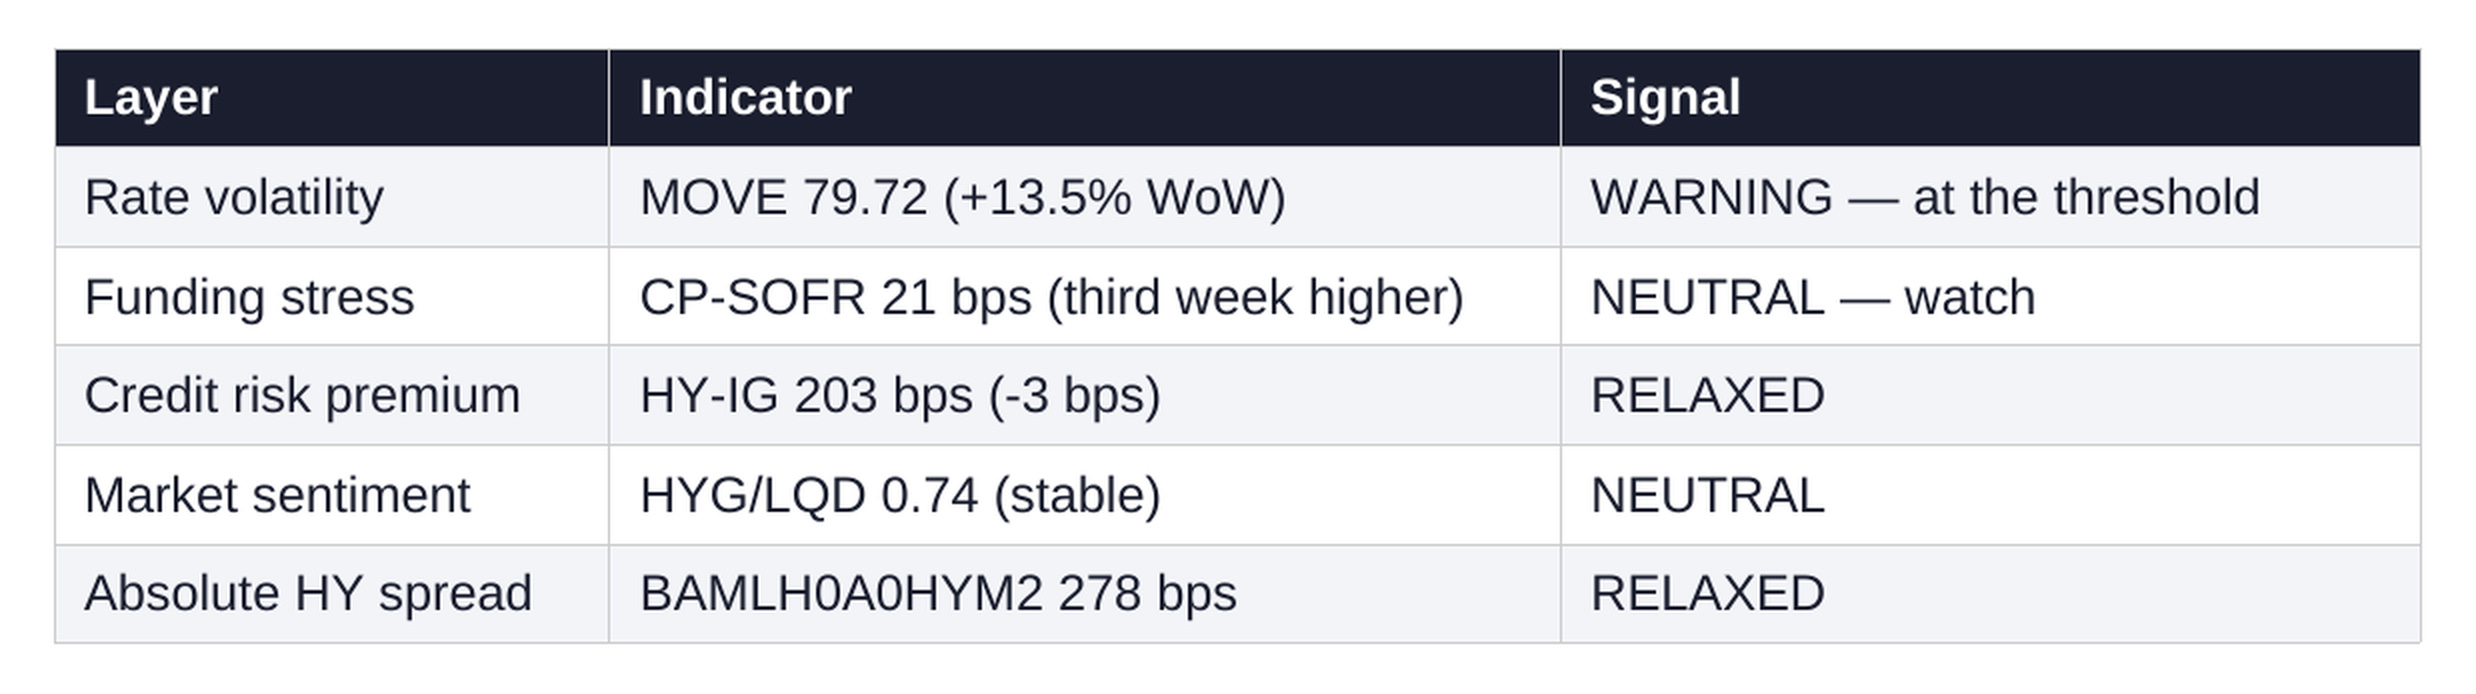
This week, Credit Pulse registered its first divergence in months. Rate volatility sent a clear warning signal, while the credit market remained calm. The system is not under stress, but it’s no longer in full relaxation mode either.
① MOVE Index | 79.72 ↑ (+9.48 / +13.5% for the week)
Signal: WARNING (at the threshold)
MOVE is the VIX equivalent for the bond market. It measures the expected volatility of US Treasury rates and tends to move ahead of credit markets. When MOVE rises, interest rates become unpredictable and the cost of financing for everyone (corporations, governments, consumers) starts to get complicated.
This was the most significant move of the week. MOVE jumped by nearly 10 points and at its peak broke above 80, the threshold below which we consider conditions calm. It closed at 79.72, right on the line.
The trigger was specific: Japanese long-term yields continued to rise. 30-year Japanese government bonds (JGBs) consolidated above 4%, while 40-year JGBs reached 4.22%. Japanese debt is a global reference asset. When its yield rises, US rate volatility follows within hours, because Japanese capital is deeply embedded in the US bond market.
The important caveat is that MOVE did not break sustainably above 80. It is holding at the threshold. If next week closes firmly above 80, the overall Credit Pulse regime shifts to WARNING.
Signal: ⚠️ WARNING (at the threshold)
② CP-SOFR Spread | 21 bps ↑ (from 13 bps last week)
Short-term funding stress indicator
The CP-SOFR spread measures how much more corporations pay for short-term financing relative to the benchmark rate. When companies need money for days or weeks, they issue what is known as commercial paper. The difference between that cost and the SOFR benchmark rate shows whether short-term funding markets are functioning normally or beginning to strain.
This is the third consecutive week of increases: 8 bps, 13 bps, 21 bps. The threshold for real funding stress is at 30 to 35 bps, so we are still at a safe distance. But the trajectory is clear and the pace is accelerating. Three consecutive weeks of increases are not a coincidence. If the trend continues for another two weeks, we will enter the zone of concern.
Signal: ⚪ NEUTRAL (watch - third week higher)
③ HY-IG Spread | 203 bps ↓ (from 206 bps last week)
Clean credit risk premium, no rate noise
This is the clean difference between the yield on risky corporate bonds (high yield) and quality ones (investment grade). When the spread widens, investors are demanding higher compensation for risk. When it narrows or holds steady, they are comfortable. We measure it this way to isolate credit risk from the general movement of interest rates.
This week we have an improvement of 3 bps. This is the important counterpoint to MOVE: despite the spike in rate volatility, credit investors are not demanding a higher risk premium. The credit market is not confirming the anxiety seen in the rate market. The two markets are speaking different languages this week, and that divergence is the central theme of this Credit Pulse.
Signal: 🟢 RELAXED
④ HYG/LQD Ratio | 0.74 (stable)
Risk appetite thermometer
HYG and LQD are the two most closely followed bond ETFs in the world. HYG tracks risky corporate bonds, LQD tracks quality ones. The ratio between them shows whether money is moving toward risk or away from it. When the ratio rises, risk appetite is increasing. When it falls, capital is seeking safety.
This week the ratio is virtually unchanged. Money is not fleeing risky bonds. Despite the noise around Japanese yields and the spike in MOVE, market behavior remains calm at this level.
Signal: ⚪ NEUTRAL
⑤ BAMLH0A0HYM2 | 278 bps ↓ (from 280 bps last week)
Absolute HY spread - full picture
This is the absolute level of the spread on all risky corporate bonds relative to US Treasuries. Unlike HY-IG, here we are not isolating rate noise but looking at the full picture. 278 bps is a historically calm level, well below the threshold for concern at 400 to 450 bps. It moved down by 2 bps and confirms the overall conclusion: the credit market as a whole is not under pressure.
Signal: 🟢 RELAXED
Net Fed Liquidity | $5.929T | +$39.8B WoW
NFL continues to grow, but the driving force this week is again Treasury, not the Fed. The Fed’s balance sheet (WALCL) actually shrank by $14.9B, meaning the Fed is continuing quantitative tightening. Liquidity is growing for a different reason: the government’s account at the Fed (TGA) fell by $57.3B, injecting those funds directly into the system. The RRP is practically zero and is no longer a meaningful variable in the equation.

Liquidity is growing through administrative, not monetary means. The sustainability of this dynamic depends entirely on Treasury’s fiscal policy, not on Fed decisions.
Regime: NEUTRAL with a warning flag
The key divergence this week is between rate markets and credit markets. MOVE jumped 13.5%, triggered by Japanese JGBs above 4%. But credit investors did not react. The HY-IG spread improved, HYG/LQD held steady, BAMLH0A0HYM2 continued lower. Japan’s long-term yield problem is a global structural issue, not a local US credit signal. For now, the credit backdrop remains constructive.
What we are watching next week: MOVE closing sustainably above 80 and CP-SOFR above 25 bps. If both happen simultaneously, the regime shifts to WARNING.
Next issue: Friday, May 30, 2026