

European households have not yet received their winter bills, but the market is already writing them. The indicative EU Gas series, which tracks the Dutch TTF market, closed on 21 August at EUR 65.87 per megawatt-hour. That is an increase of 133.89% since the start of the year and 96.18% over 12 months. Storage is only 62% full, compared with 75.1% a year earlier and a historical average of 79.5% for this date. Even so, the European Commission sees no immediate risk to physical supply. This is the paradox of the current shock: Europe will probably have gas, but it will have to bid for it against Asia while constrained Gulf supply keeps the entire LNG market tight. Since 2022, the bloc has reduced its dependence on Russia, but it has not achieved price independence. It replaced the risk of one pipeline with the risk of a global auction.
Europe replaced the Russian pipeline with a global auction. The auction started before winter.
Europe’s Energy Position: US Gas Falls While European Gas Doubles
For European consumers, the most important move in August is not in oil. It is in gas. TTF is Europe’s main natural gas benchmark, traded in euros per megawatt-hour. Trading Economics’ EU Gas series is a contract for difference, a tradable instrument designed to track this market rather than an official ICE settlement price. On 21 August, it stood at EUR 65.87/MWh, its highest level since January 2023.
The move is large even after making the correct historical comparison. TTF remains about 81% below the extreme peak of EUR 345/MWh recorded in March 2022. But relative to the final session of 2025, it is up 133.89%. This is not a return to the worst phase of the previous crisis. It is a shock strong enough to change winter budgets, industrial margins, and European Central Bank decisions.
The gap with the United States shows where the problem lies. Henry Hub is at USD 2.773 per million British thermal units, or MMBtu, down 24.77% since the start of the year. At an exchange rate of roughly USD 1.17 per euro, TTF at EUR 65.87/MWh is equivalent to approximately USD 22.6/MMBtu. On a comparable energy basis, European gas costs more than eight times as much as US gas.
The reason is not that the gas molecule is different. US gas cannot leave the country unless it is cooled into a liquid, loaded at an export terminal, shipped, and turned back into gas at an import terminal. These physical constraints keep Henry Hub relatively isolated. Europe buys in a different market, where the last available LNG cargo sets the price.
Asia confirms the pattern. LNG JKM, the main spot benchmark for cargoes delivered to Japan and Korea, is at USD 22.94/MMBtu and has risen 138.83% since the start of the year. UK Gas is up 120.27%. When TTF, JKM, and UK gas rise at the same time while Henry Hub falls, the move is not a European statistical anomaly. It is a global LNG shock.
Continuity from the July Edition
The July US edition warned that crude oil could remain below its extreme thresholds while refined fuels and the broader commodity basket continued higher. That thesis has been partly confirmed. WTI is at USD 87.06 and has not yet held above the monitored USD 90 level. Brent is at USD 94.39, close to but below the USD 95 threshold. At the same time, NYMEX HO/ULSD is at USD 4.4948 per gallon, above July’s USD 4 threshold, while the CRB Index is already above 500 points.
The surprise is geographical. The strongest continuation of the energy shock did not occur in the US domestic gas market. It occurred in Europe and Asia, where LNG cargoes from the Gulf form part of the same global market.
European Commodity Dashboard
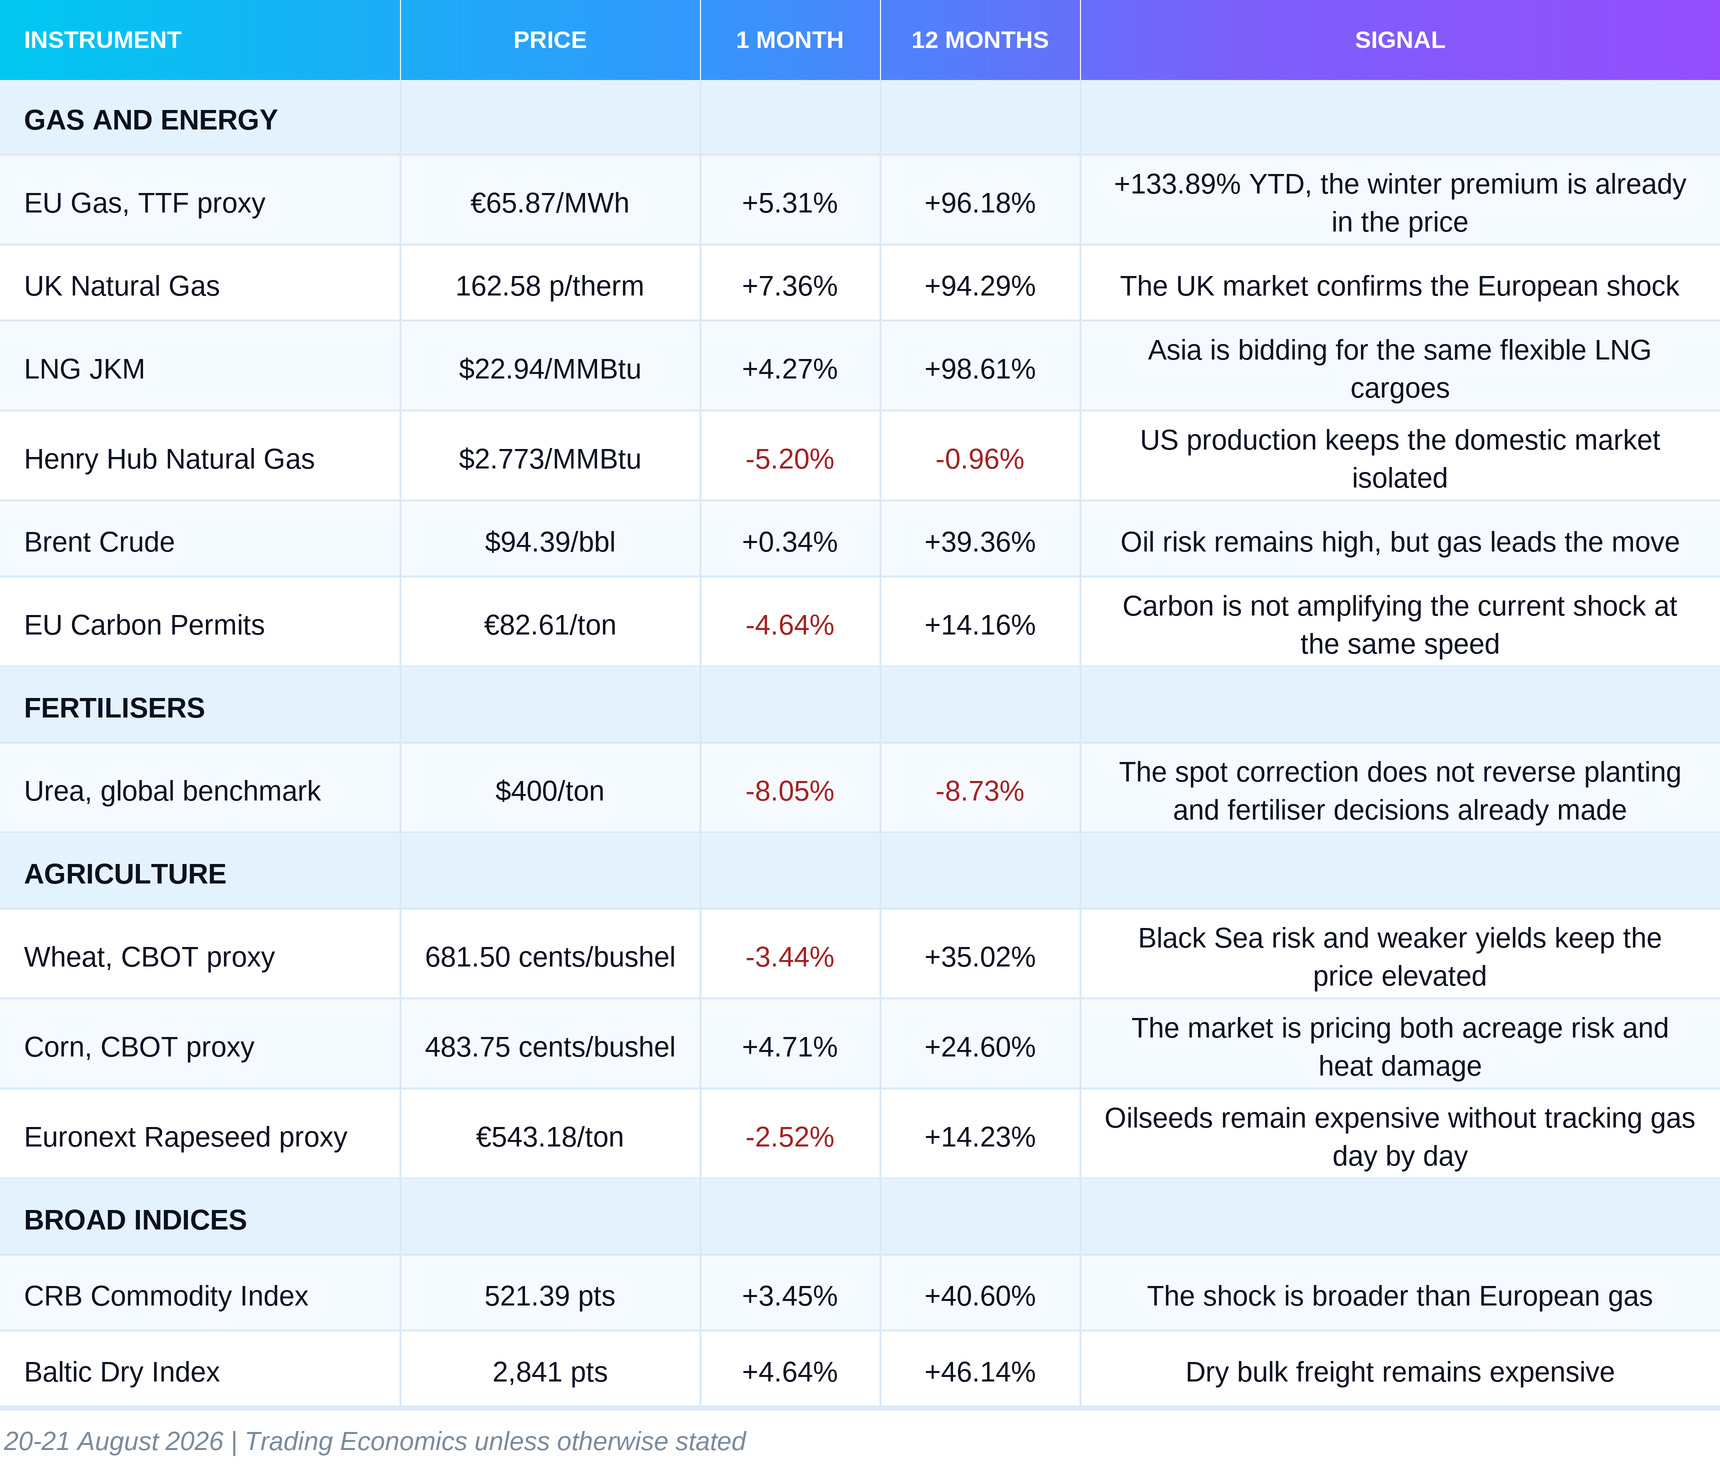
The dashboard shows three different speeds. Gas in Europe and Asia has almost doubled from a year earlier. US gas is almost unchanged. Spot urea is correcting while wheat and corn remain 35% and 25% above last year’s levels, respectively. This divergence shows why the current fertiliser price cannot veto the food risk. Acreage, applied nitrogen, weather, and trade flows operate with different seasonal lags.
The Baltic Dry Index requires the usual qualification. It measures the transport cost of dry bulk cargoes such as grain, coal, and iron ore. It does not measure LNG tankers and cannot be used as a direct proxy for the cost of gas transport through Hormuz.
The Transmission Chain: Four Channels from the LNG Tanker to the European Household
Channel 1: From Hormuz to the Global LNG Auction
Europe does not need to buy all its gas from Qatar to be affected by a problem in Qatar. In 2025, Qatar supplied only 3.7% of total EU gas imports and 8.9% of LNG imports. At first glance, that looks like limited exposure.
The market, however, is set by the missing cargo, not the average supplier. Before the conflict, almost 20% of global LNG supply passed through Hormuz. Between March and June, loadings from Qatar and the United Arab Emirates fell by 35 billion cubic metres from a year earlier, according to the International Energy Agency. New production outside the Gulf added around 27 billion cubic metres and offset roughly three quarters of the loss. Global LNG output was still 4% lower.
That is enough to change the price of the last flexible cargo. From March to June, Asian JKM traded at an average premium of USD 2.1/MMBtu over TTF. That spread directed flexible cargoes towards Asia. Europe may have terminal capacity, but it must offer a competitive price to attract the vessel.
Channel 2: From Storage to the Winter Risk Premium
European storage is not empty. It was 62% full on 20 August. The problem is the comparison: 75.1% on the same date in 2025 and a historical average of 79.5%. This is the lowest seasonal level in the available series since 2009.
The gap to the 90% target is 28 percentage points. The new European rules allow the target to be met within a two-month window between 1 October and 1 December, while member states can use additional flexibility under adverse market conditions. This reduces the risk that regulation forces every buyer into the market on the same day.
The flexible deadline does not remove the physics. Once the heating season starts, injections compete with current consumption. A high price can support storage filling by attracting cargoes and curbing demand. The same price also makes storage more expensive and encourages some traders to delay purchases. That is why 62% is not an automatic forecast of shortage, but it is low enough to keep a winter premium in TTF.
Channel 3: From TTF to Gas and Electricity Bills
Households will not see the TTF move on the day it occurs. Supplier contracts, hedging, regulated tariffs, and taxes delay the pass-through. Historical ECB estimates place the main transmission from wholesale gas prices to consumer gas bills at roughly three to six months, with the speed varying widely across countries.
Electricity adds a second layer. Gas-fired power plants often set the price in hours when demand is high and output from wind, solar, hydro, or nuclear power is insufficient. But the link is weaker than it was in 2022. Higher renewable generation limits the number of hours in which gas is the price-setting technology.
Carbon permits are not amplifying the move at the same speed either. They are at EUR 82.61 per ton and have fallen 4.64% over the month. For a gas-fired plant, this provides some relief in variable costs, but not enough to offset gas that has risen 134% since the start of the year.
Channel 4: From the Import Bill to Industry, Income, and Consumption
More expensive gas transfers income from Europe to energy exporters. The European Commission estimates that since the conflict began in February, the EU has spent an additional EUR 53 billion on fossil fuel imports. This money does not create more European output. It pays a higher price for the same essential energy.
The effect is not distributed evenly. The lowest-income 20% of euro area households spend about 9% of their disposable income on energy, compared with an average of 5.5% across households. These consumers also have the smallest savings buffer. When the bill rises, the adjustment comes through reduced purchases of other goods and services.
Industry responds differently: it cuts production, postpones investment, or passes part of the cost on to customers. Based on the latest official price data published in 2026, electricity for the EU’s largest industrial consumers is approximately 70% more expensive than the 2019 average. At the same time, electricity consumption in the main energy-intensive sectors fell by around 14.5% between 2019 and the first half of 2026. Part of the decline reflects greater efficiency, but production indices also confirm a real loss of output in chemicals, metals, non-metallic materials, and paper production.
The Gas Shock Is Already in the Field
The fall in urea to USD 400 per ton is not a counterargument to food risk. It is a later market snapshot. Acreage decisions and part of the nitrogen application had already been made when conditions were substantially less favourable. A spot correction does not restore land that was not planted or nitrogen that was not applied.
In April, the overall level of nitrogen fertiliser prices in the EU was 71% above the 2024 average. Fertiliser affordability relative to grain prices had fallen to its weakest level since 2022. The European Commission identifies the usual farmer response: when producers cannot pass the higher cost on to the buyer, they reduce application rates, which later appears in yields.
Wheat: A Smaller Crop, but Not Only Because of Fertiliser
Most European wheat was planted in autumn 2025, before the February acceleration in gas and fertiliser prices. This limits the effect on acreage, but not on spring fertiliser application. The European Commission expects wheat production in 2026/27 to fall 6.2% from the exceptionally strong previous crop. The latest European dashboard puts total output close to 124 million tonnes.
Weather adds a separate pressure. Repeated heatwaves shortened the grain-filling period, while the July JRC assessment reduced expected winter crop yields by 1% to 4%. The decline in wheat should therefore not be attributed to fertiliser alone. It is a combination of a high comparison base, more expensive spring feeding, and adverse weather.
The market is not pricing an immediate physical shortage, but it is retaining a premium for future delivery. The Euronext September 2026 wheat future is around EUR 227 per ton, December is at EUR 237, and March 2027 is at EUR 239. This is moderate contango, meaning that each later delivery is slightly more expensive. The curve suggests that the available crop is sufficient for now, but the market demands a higher price to store and carry it forward. The global wheat benchmark remains 35% above last year’s level, but is still roughly half its historical March 2022 peak. Black Sea export risk also supports the price.
Corn: Less Nitrogen and More Heat
Corn is the more direct test of the link between gas and agriculture. Spring planting coincided with the sharp increase in nitrogen fertiliser prices, and the crop is highly dependent on sufficient application. The Commission’s spring forecast still assumed output growth of 5.3% from the weak previous year, but explicitly warned that high fertiliser prices during planting could result in less acreage.
The second blow came after planting. Exceptional heat and limited rainfall in Western and Central Europe depleted soil moisture and affected flowering. In July, the JRC cut its corn and sunflower yield forecasts by 6% to 7%. The risk for corn is now twofold: a possible constraint on acreage or applied nitrogen, and a lower yield from the remaining area.
The price is beginning to reflect that combination. The global corn benchmark is at 483.75 cents per bushel, up 4.71% over one month and 24.60% over one year. This is not proof that Europe is entering a food crisis. It is a signal that the market no longer treats agriculture as insulated from the energy shock.
Are Farmers Switching to Crops That Need Less Fertiliser?
The data require a more cautious conclusion here. The Commission expects EU oilseed output to rise 3.3%, while its spring forecast for sunflower production pointed to a 14.5% increase on larger acreage and a better expected yield. This is a clue that land allocation is changing, but it does not prove that land was shifted specifically from corn to sunflower because of fertiliser prices.
Soybeans and protein crops require less mineral nitrogen because they fix nitrogen through their root systems. They are a logical alternative when fertiliser is expensive, where climate, crop rotation, and the local market permit. Rapeseed, however, should not be placed in the same group. It remains a crop with a significant nitrogen requirement.
The correct conclusion is therefore not that urea at USD 400 has stopped the food transmission. For the 2026 crop, the decisive variables are now actual planted acreage, applied nitrogen, heat, and import requirements. The current urea price is more useful as a signal for costs and decisions in the next production cycle. If TTF remains above EUR 60 to EUR 70/MWh during autumn, the pressure will carry into purchases for spring 2027.
This Is Not 2022. That Is Exactly Why the Risk May Be Underestimated
Europe is better prepared for a physical shock than it was in 2022. LNG’s share of EU gas imports rose from 20% in 2021 to 45% in 2025. The United States now supplies 26% of total gas imports, Norway 31%, North Africa 13%, and Russia 12%, compared with Russia’s 45% share in 2021. The bloc has more LNG terminals, more renewable electricity, and substantially lower gas demand. Consumption fell by more than 19% between 2021 and 2024.
These are real buffers. The European Commission argues that there is no immediate supply risk for the winter of 2026/27 and that the storage targets remain achievable. Spare LNG terminal capacity provides the physical ability to import if cargoes can be found.
But a terminal does not produce gas. It merely allows Europe to take part in the global auction. In 2022, the central fear was the loss of Russian pipeline supply. In 2026, the risk is that Europe pays the marginal price in a global market where almost 20% of LNG flows are affected and Asia is ready to bid for the same cargoes.
There is another important difference. The International Energy Agency built its July base case on the assumption that Hormuz would fully reopen in the third quarter and that unaffected facilities would normalise in early Q4. As of 21 August, traffic remained constrained and there was no full agreement. The market is not reacting only to the current shortfall. It is repricing the probability that the IEA’s base assumption will not materialise in time.
The CRB Index above 500 shows that the problem is no longer isolated in European gas. The index stands at 521.39 points and is up 40.60% over one year. Approximately 39% of its weight comes from energy and 41% from agriculture. This is a broad commodity impulse, but not a repeat of 2022. TTF is far below its peak from that year and demand is already weaker. The more accurate description is an expensive regime without an immediate physical shortage.
That may prove politically harder than a short panic. A shortage justifies emergency measures. A persistently high price gradually erodes competitiveness, income, and fiscal resources without creating one clear moment of crisis.
The ECB: Inflation Shows the Gas Shock, but Not All of It Yet
European consumers are already feeling part of the energy shock. Annual euro area inflation rose to 2.9% in July from 2.8% in June. The energy component is up 10.3% from a year earlier and contributes 0.94 percentage points to headline inflation. This means that almost one third of July inflation comes directly from energy.
Producer prices show an earlier part of the chain. In June, the producer price index, or PPI, was up 4.6% from a year earlier. Energy rose 8.8%, goods used as inputs in production rose 6.1%, and the index excluding energy rose 3.0%. The monthly decline in energy producer prices in June describes the temporary truce and lower quotations at the time. It does not describe the rise in TTF during August.
The ECB kept the deposit facility rate at 2.25%, the main refinancing operations rate at 2.40%, and the marginal lending facility rate at 2.65% in July. The bank explicitly stated that the full inflationary effect of the energy shock had not yet appeared.
This is a different version of the same trap the Fed faces with oil. A higher interest rate cannot open Hormuz and cannot produce LNG. It can only reduce European demand, investment, and employment. But cutting rates while energy inflation is above 10% risks loosening financial conditions just as production costs are moving towards final prices.
The ECB also has reason not to react mechanically. Stronger renewable generation has limited gas use in power generation, while underlying inflation excluding energy remains calmer. The correction in urea reduces the risk for the next production cycle, but it does not cancel the costs already incurred in planting and fertilising the 2026 crop. If TTF falls back below EUR 50 to EUR 55 and storage begins to catch up, part of the inflation premium may prove temporary.
If gas remains above EUR 65 through autumn, waiting becomes more difficult. Consumer bills work with a lag of several months. That means even a fall in TTF during October will not automatically remove winter inflation pressure. For now, the ECB’s most likely response is to keep rates on hold until it becomes clear whether Europe is buying an expensive buffer for one winter or entering a new multi-year regime of higher LNG prices.
What We Are Watching Over the Next 30 Days
The current price reflects stress, but not a repeat of 2022. The energy test is the combination of TTF, the Asian premium, and the speed of storage filling. The agricultural test is whether official estimates confirm smaller acreage or another reduction in corn yields. None of these indicators is sufficient on its own.
Confirming Signals: The Commodity Shock Deepens
TTF above EUR 80/MWh for at least five consecutive sessions by 15 September. This would show that the market no longer expects a rapid normalisation in LNG flows.
European storage below 70% on 15 September. This would leave too much ground to recover as heating demand begins to return.
JKM at a premium of more than USD 2/MMBtu over TTF for two weeks. A spread of this size already diverted flexible cargoes towards Asia from March to June. A repeat would make European storage filling more difficult.
Euro area energy producer prices back above 10% year on year in the next PPI release. This would confirm that the August shock is re-entering the industrial chain.
A further official downgrade to the corn yield forecast or confirmation of smaller planted acreage. This would show that expensive fertiliser and heat are constraining both the area used and output per hectare.
Signals of Controlled Normalisation
TTF below EUR 55/MWh and storage above 70% by 15 September. The combination matters: a lower price without faster filling is not enough.
A measurable recovery in LNG traffic through Hormuz and no sustained JKM premium over TTF. This would return more flexible cargoes to Europe.
Urea remains below USD 450 per ton while acreage and yield forecasts stabilise. Only this combination would show that pressure on the next production cycle is easing and damage to the current crop is not deepening.
Energy PPI remains below 10% and inflation excluding energy does not accelerate. The ECB would then have more reason to treat the move as a contained shock rather than a new broad inflation wave.
Scenario Framework
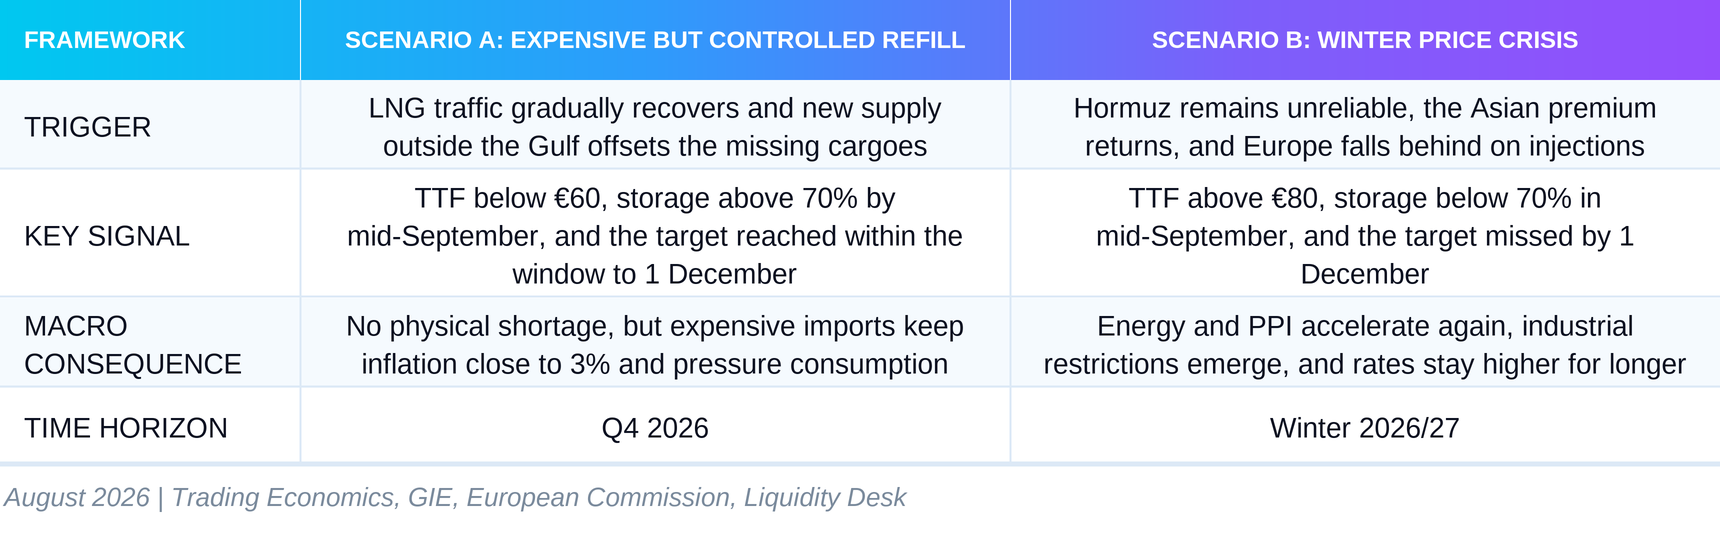
For now, Scenario A is the base case. The European Commission has sufficient physical arguments: diversified supply, spare LNG terminal capacity, lower demand, and a larger share of renewable energy. But this is not a scenario for a return to EUR 28/MWh, the level seen at the end of 2025. It is a scenario in which Europe avoids shortage through a high price, weaker demand, and expensive LNG purchases.
Scenario B becomes the base case if TTF moves above EUR 80 and storage remains below 70% in mid-September. The market would then begin to price not only an expensive refill, but real competition between current winter consumption and the remaining injection capacity.
Europe can fill its storage. The question is what price it will pay to do it.