

Narrative Bridge
July was a month of relief. Markets accepted that the Middle East conflict was heading toward a settlement, energy gave back the geopolitical premium it had accumulated, and financial companies took the lead on both sides of the Atlantic. Latin America recovered from a punishing June. The logic was simple: risk is falling, so capital can return to cyclical assets.
In August that logic broke in two places at once. The Strait of Hormuz deal arrived, held for a few days, and collapsed. The market first paid for the reopening, then paid for its failure, and energy returned to the top of the tables. All three major central banks held their rates, but for the first time in years the discussion is no longer about when the next cut arrives. It is about whether the next move might be upward.
The change is clearest where nobody expected it. Asia rises everywhere, including China, which has been the weakest market in the world for months. Latin America falls, even though the dollar weakened. This is the reverse of everything this analysis described in June and July, when a strong dollar explained almost every move in emerging markets.
So the question this month is not whether investors want risk. Volatility is low and leadership is broad. The question is what is actually allocating capital now that the dollar has stopped doing the job.
Macro Context
Rate Environment
The Federal Reserve held its target range at 3.50% to 3.75% at the meeting of 28 and 29 July, and the effective federal funds rate remains 3.63%. The vote is the news. It was 9 to 3, with the three dissenters, Beth Hammack of Cleveland, Neel Kashkari of Minneapolis and Lorie Logan of Dallas, calling for an increase of 0.25 percentage points. This is not ordinary disagreement at the end of a cutting cycle. This is a committee in which a quarter of the voters believe the rate is too low.
Chairman Kevin Warsh was unambiguous at the press conference. He described the decision not as a pause but as a thorough review, said the bank will not be constrained by market prices, and insisted the target is two percent with no soft or implicit version of it. This matters for reading the sector data: when a central bank announces that it will not defer to what the market has already priced in, rate-sensitive sectors lose their protection.
The yield on the 10-year US Treasury is moving the same way. It reached 4.63% on 13 August against 4.54% on 9 July. The gap to the effective policy rate is now exactly one percentage point. That gap matters because banks fund themselves at short maturities and lend further out on the curve. When the long end sits above the central bank rate, bank margins widen.
July inflation, published on 12 August, brought some relief. The consumer price index rose 0.1% for the month and 3.4% year on year, 0.1 percentage points below June. Core inflation, meaning prices excluding food and energy, is 2.5% year on year. Markets cut the probability of a September increase to roughly 42% on CME futures pricing, but did not remove it. The next Fed meeting is on 15 and 16 September.
The European Central Bank held its deposit facility rate at 2.25% on 23 July, after June’s increase. The main refinancing rate is 2.40% and the marginal lending rate is 2.65%. The yield on 10-year German government bonds is 3.22% on 14 August against 3.17% on 9 July, which puts it 0.97 percentage points above the deposit rate. The ECB remains the only major central bank that has actually tightened this year, and markets expect a further increase to 2.50% at the meeting on 10 September.
The Bank of Japan held its policy rate at 1.00% on 31 July by a vote of 8 to 1. The dissenter, Hajime Takata, wanted an increase to 1.25%. The bank warned that core inflation is likely to accelerate clearly above 2% from the second half of fiscal 2026, meaning from October onward.
The real Japanese story, though, remains at the long end. The 6 August auction of 30-year Japanese government bonds cleared at an average yield of 3.937%, slightly below the 3.993% of the 7 July auction. The gap between the policy rate and the 30-year yield is close to three percentage points. It matters because of the carry trade, the practice of borrowing cheaply in yen and investing the money in higher-yielding assets elsewhere. The more expensive Japanese money becomes, the less attractive that trade is, and the more likely capital is to go home.
The Broad Dollar
The Federal Reserve’s Broad Dollar Index, which measures the dollar against a basket of the main US trading partners, stood at 119.0649 on 7 August against 120.8145 on 7 July. That is a fall of roughly 1.45% for the month.
A strong dollar works through two channels. It compresses the value of foreign revenue when US multinationals translate it back into dollars, and it raises the cost of servicing emerging-market debt, most of which is denominated in dollars. In June the second channel crushed Latin America. In July the region recovered despite a firm dollar.
In August the dollar weakened and Latin America fell anyway. This matters. The mechanism that explained the region for two consecutive months did not work this month. The reasons are domestic, and the Latin America section takes them one by one.
Risk Appetite
The VIX, which measures expected volatility in the US equity market and serves in practice as a gauge of investor fear, closed at 14.63 on 13 August against 15.84 on 9 July. For orientation: readings below 20 generally mean calm, above 20 indicate elevated nervousness, and above 30 are associated with active fear.
The path to that reading was not straight. On 29 July, the day of the Fed decision, the VIX spiked to 20.66, then fell through the rest of August. The market took fright at the split inside the committee, then decided after the moderate July inflation data that the risk of an increase was contained. The current level is the lowest in several months and confirms that August’s rotation is not a flight from risk but a rearrangement within it.
Geopolitical Energy Context
In July this analysis described energy as an event-driven position with a negative recorded return and preserved upside optionality if physical supply deteriorated again. In August the reversal arrived.
The month has three parts, not two. Late July escalation put a premium into the price: the Brent spot price closed at $96.95 per barrel on 31 July, the highest level of the whole period. On 2 August the Iranian foreign minister Abbas Araghchi agreed that the strait would reopen, and the market responded immediately. By 4 August Brent had fallen to $86.47, a drop of 10.8% in three trading sessions, while US WTI fell from $86.16 to $77.33. Had the month ended there, energy would have been among the weakest sectors for a second time running.
It did not end there. The agreement never materialised. Negotiations between Iran and Oman stalled, Tehran set conditions for Washington that have not been accepted, and attacks on commercial vessels continued. The scale of the disruption is large: according to the US Energy Information Administration, crude oil and petroleum liquids moving through the strait averaged 4.9 million barrels per day in the second quarter of 2026, against 21.6 million barrels per day in the fourth quarter of 2025. Saudi Arabia is rerouting part of its exports through the east-west pipeline to the port of Yanbu on the Red Sea, but the capacity of that route is limited.
On 11 August the Energy Information Administration raised its forecast for average Brent crude in 2026 to $87 per barrel, citing Hormuz transit constraints explicitly. The same day the Brent spot price stood at $93.26, which is 7.9% above the 4 August low. The price travelled all the way up, down and back up again in nine trading sessions.
This explains why energy sits at the top of both the US and European tables this month. It also explains why inflation stays stubborn even though the energy component of the US consumer price index fell 1.5% in July. Consumer prices reflect the past. The crude price reflects expectations.
United States: Sector Rotation
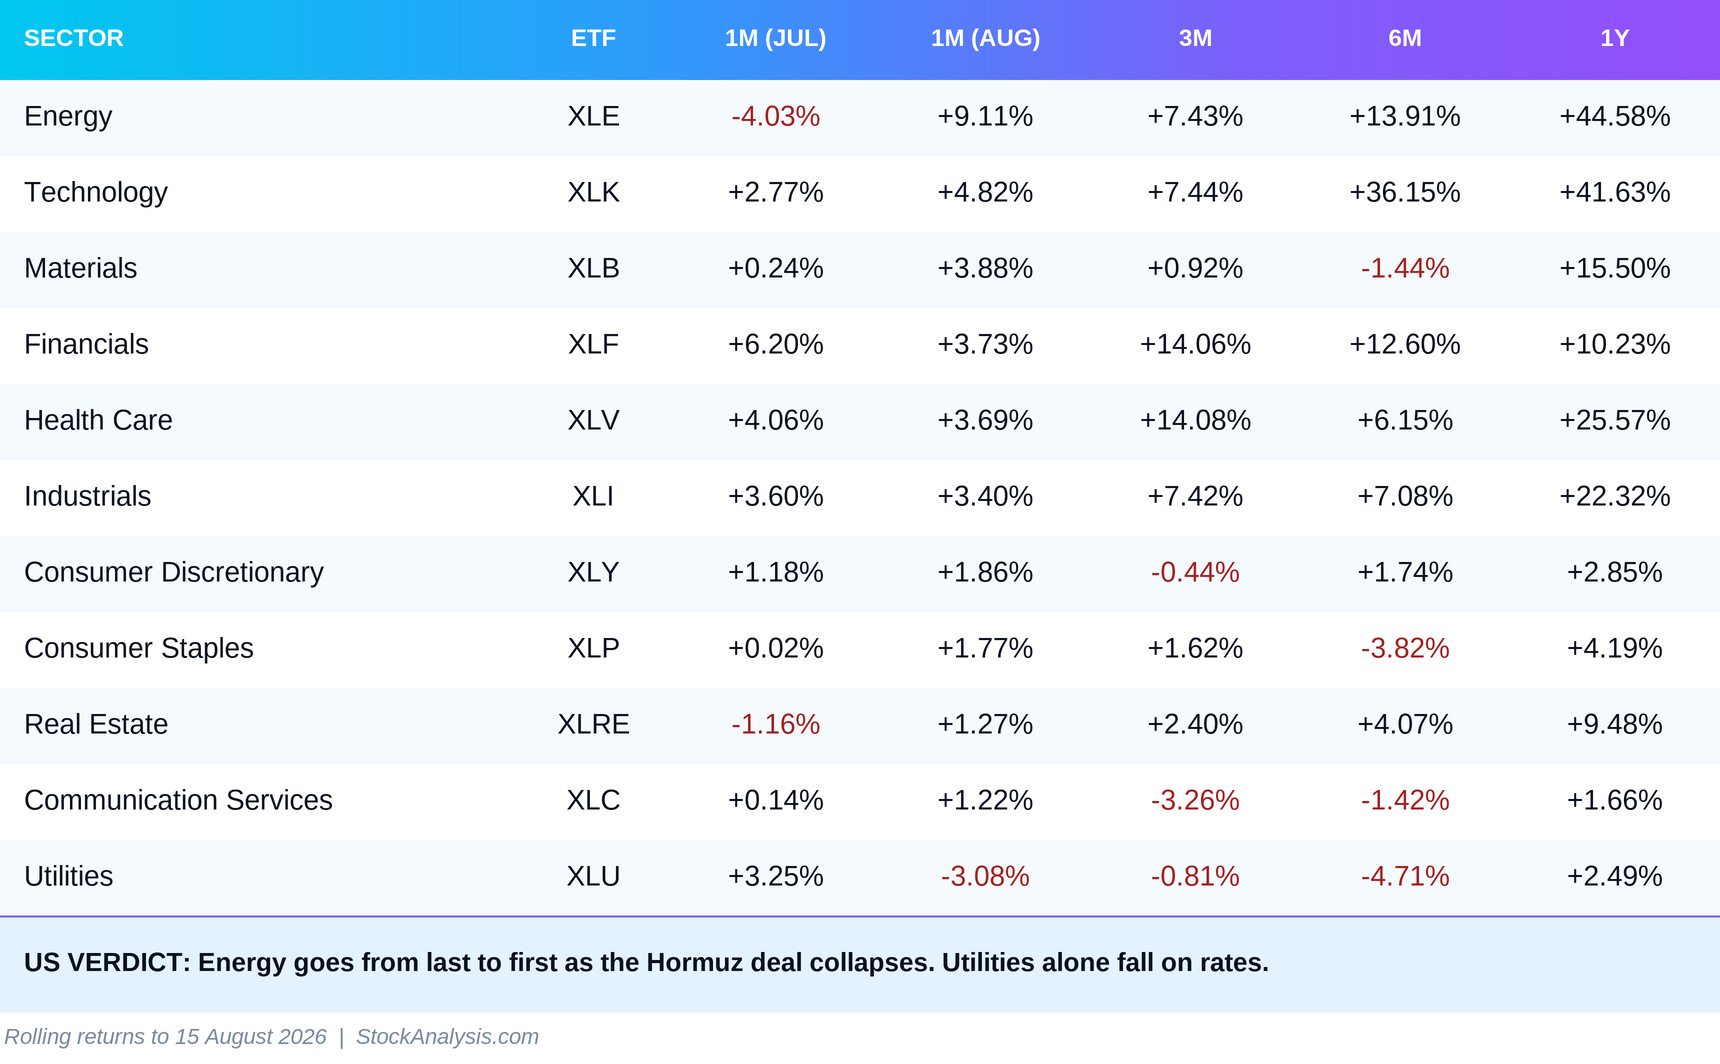
The most important number in the US table is also the simplest. Energy (XLE) gains 9.11% for the month after finishing last in July at -4.03%. That is a complete reversal in thirty days and it has one cause: the market bet on the Strait of Hormuz reopening, the reopening did not happen, and the premium came back. The sector now shows +44.58% over one year. This position remains event-driven. If talks suddenly succeed, the move can reverse as fast as it reversed in July.
Technology (XLK, +4.82%) accelerates from July and remains the strongest structural sector in the US with +36.15% over six months. The three-month return looks sharply lower than last month, +7.44% against +30.77%, but that is a base effect. The powerful spring surge has rolled out of the three-month window. The fund’s price has not fallen; it has continued to rise.
Materials (XLB, +3.88%) are the surprise of the month. The sector is moving up from a weak base, with -1.44% over six months, and the likely cause is the weaker dollar. A softer dollar raises commodity prices measured in dollars and improves the competitiveness of US exporters.
Financials (XLF, +3.73%) decelerate from July’s +6.20%, but the quality of the move improved. In July this analysis noted that the six-month return on XLF was essentially zero, which put the durability of the surge in question. The three-month return is now +14.06% and the six-month +12.60%. The rotation into banks has become a trend.
Health Care (XLV, +3.69%) stays in the upper half for a third consecutive month and holds the best three-month return in the table alongside financials at +14.08%. Ageing populations in the US, Europe and Japan mean structurally rising demand for medical services, pharmaceuticals and devices regardless of the economic cycle. Investors keep paying for that predictability even as risk appetite improves. Industrials (XLI, +3.40%) also hold their place, which confirms that cyclicals can carry higher financing costs.
Utilities (XLU, -3.08%) are the only sector in the red, and this is the signal that deserves most attention. Utilities are a classic bond proxy: they pay a stable dividend and trade against the yield on government bonds. When the 10-year yield climbs toward 4.63% and three Fed officials vote for an increase, that proxy loses its appeal. In July the sector gained 3.25% and this analysis called the move a short-term bid for stable cash flows rather than a structural breakout. The August data confirm that reading.
Europe: Sector Rotation
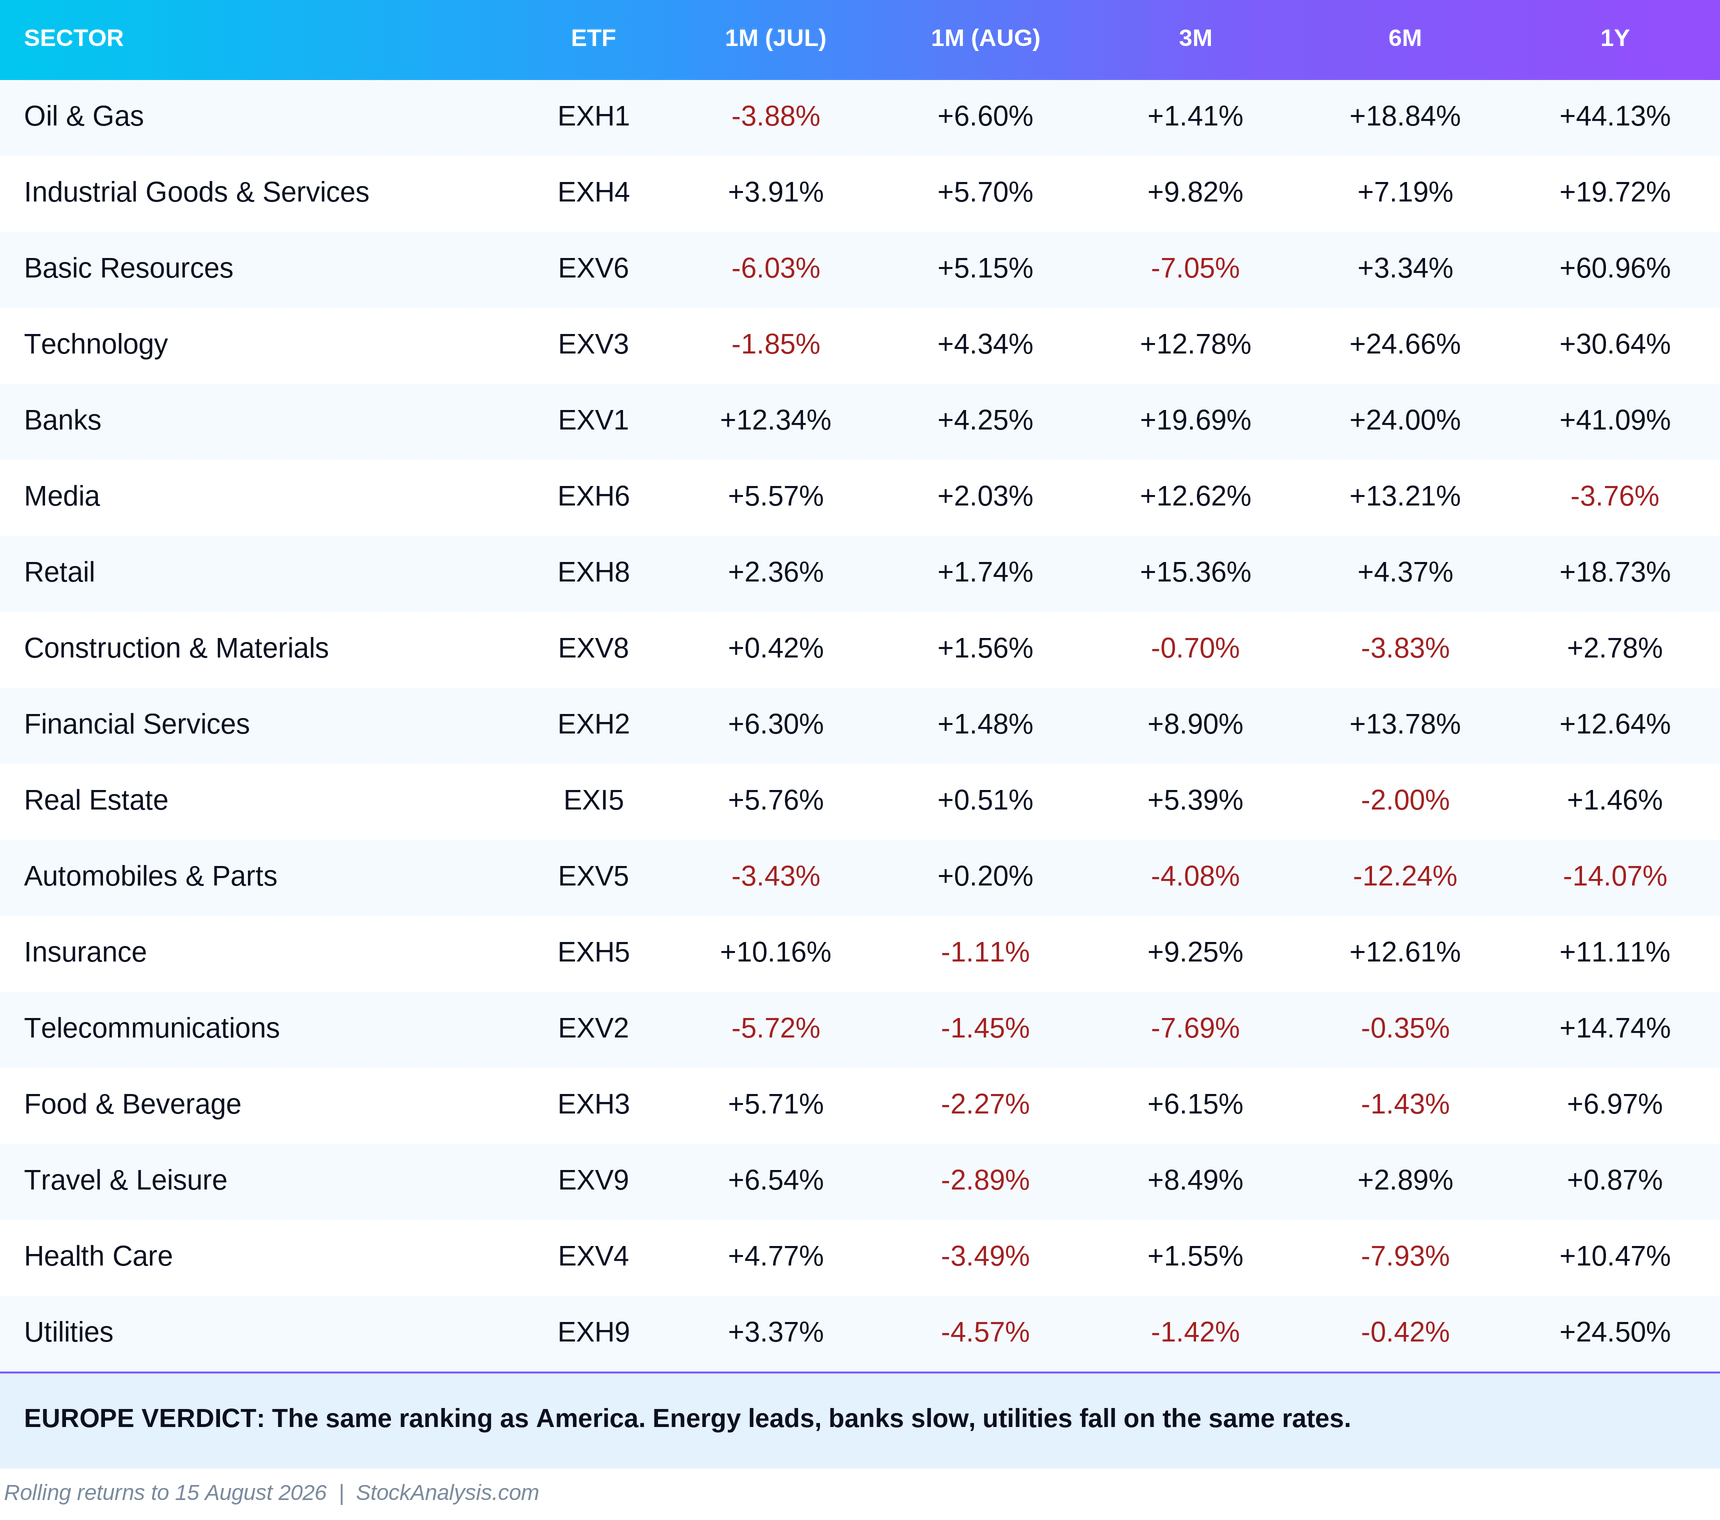
Europe repeats the American picture almost line for line, which is itself information. When two markets with different currencies, different central banks and different regulation rank the same way, the driving force is global rather than local.
Oil & Gas (EXH1, +6.60%) leads the table after sitting among the weakest in July at -3.88%. The reversal is the same as in US XLE and for the same reason. The difference is the size: 6.60% against 9.11%. US producers gain more directly from a higher crude price, while European majors carry a heavier tax and regulatory burden and hold their costs in euros against revenue in dollars. Europe also absorbs more of the inflation damage from expensive imported energy, because it imports far more than it produces.
Industrial Goods & Services (EXH4, +5.70%) accelerate from July and now show +9.82% over three months. Basic Resources (EXV6, +5.15%) reverse from -6.03% in July, which is the European equivalent of US materials. Here too the weaker dollar is part of the explanation, because commodities are quoted in dollars.
Technology (EXV3, +4.34%) turns back up after July’s pause. In July this analysis called the 1.85% decline a consolidation after a rapid catch-up rally rather than a collapse of the European AI thesis. The August data confirm that reading: +12.78% over three months and +24.66% over six.
Banks (EXV1, +4.25%) decelerate sharply from July’s +12.34% but remain the strongest established trend on the entire global map: +19.69% over three months, +24.00% over six, +41.09% over one year and +172.96% over three years. A slowdown is normal after a move of that size. Insurance (EXH5, -1.11%) and Financial Services (EXH2, +1.48%), however, give back part of July’s surge, which shows that the broad rotation into the whole financial complex was a one-off while the bank trend is separate and more durable.
Health Care (EXV4, -3.49%) is the most interesting divergence in the entire August dataset. US XLV gains 3.69% while its European counterpart falls 3.49%. The two sectors serve the same demographic demand. The difference is composition and regulation: the European index is dominated by a few large pharmaceutical companies exposed to European price controls and to US drug-pricing policy, while the US index also holds insurers, service providers and device makers. The demography is shared. The regulatory risk is not.
Utilities (EXH9, -4.57%) are the weakest European sector, exactly as XLU is the weakest American one. This is the second symmetric move of the month and it confirms the rate thesis: with the long end of the curve rising in both regions, bond proxies lose in both. Travel & Leisure (EXV9, -2.89%) hand back part of July’s summer surge, and Food & Beverage (EXH3, -2.27%) follow the same logic of selling the defensives.
Automobiles (EXV5, +0.20%) turn positive for the first time in months. This is not a reversal. The sector remains at -4.08% over three months, -12.24% over six, -14.07% over one year and -27.55% over three years. Chinese electric-vehicle competition, a slow domestic transition and weak pricing power remain structural rather than cyclical problems. One positive month against that background is stabilisation, not recovery.
Asia: Country Rotation
In Asia, country-level analysis remains more informative than sector-level analysis because regulatory systems, currencies and economic cycles differ too widely for a single sector label to explain the region. Taiwan, Japan, India and China respond to different domestic forces even when the global backdrop is identical.
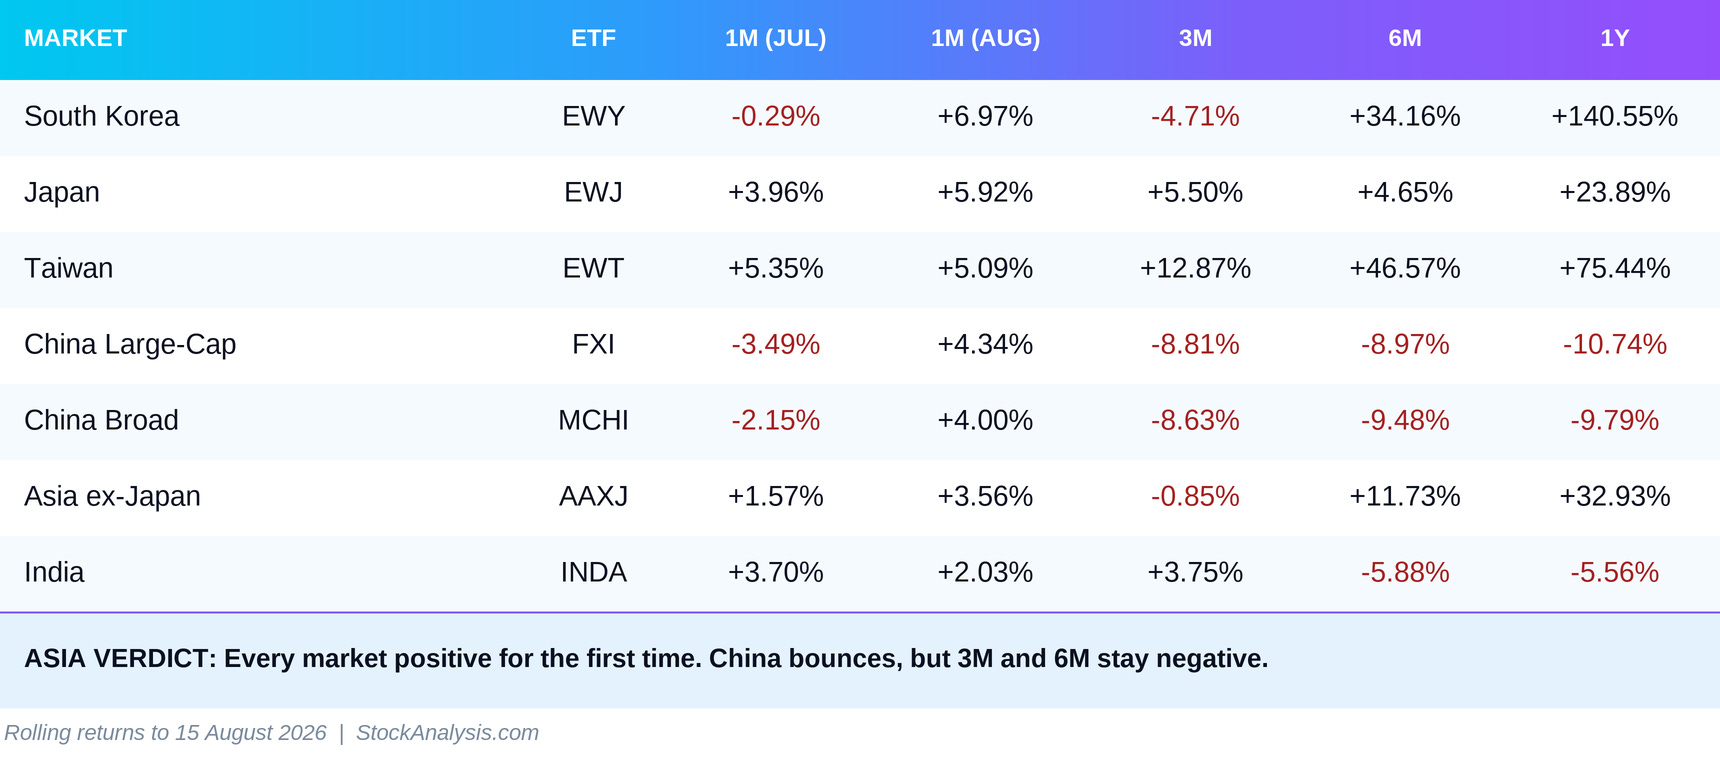
This month, however, something unusual happens: all seven exchange-traded funds in the region are positive. That has not occurred in any previous edition of this analysis.
South Korea (EWY, +6.97%) leads. The market is closely tied to Samsung and SK Hynix, meaning to the memory cycle for artificial intelligence, and it shows +140.55% over one year and +184.76% over three. The three-month return, however, is -4.71%, which means August’s jump comes after a pause rather than on top of an already accelerating move.
Japan (EWJ, +5.92%) continues its recovery for a second month. The central bank held its rate, and the 30-year yield even eased slightly from July. That gives Japanese equities room, without cancelling the longer-term risk: if the yen appreciates sharply, carry trades unwind and part of the global capital returns to Japan, which usually hurts everything else.
Taiwan (EWT, +5.09%) keeps its July pace and remains the region’s structural leader with +46.57% over six months and +75.44% over one year. TSMC and the semiconductor supply chain keep Taiwan at the centre of AI capital spending.
China posts its first positive month since this analysis began. FXI gains 4.34% and MCHI 4.00%, led by a recovery in technology and semiconductor names. Caution is needed here. The three-month returns remain -8.81% and -8.63%, the six-month readings are around -9%, and both funds are still negative over one year. One strong month after a long decline is a bounce, not a turn. The bounce shows the price has fallen far enough to attract buyers. It does not show that domestic demand, deflationary pressure or geopolitical risk have changed.
India (INDA, +2.03%) is the weakest in the region for a second consecutive month and remains, alongside China, the only Asian market with a negative one-year return at -5.56%. The story of India as the preferred emerging-market alternative to China, which drove inflows through 2024 and 2025, has not yet been restored.
Latin America: Country Rotation
Latin America is normally read through the dollar. This month it cannot be.
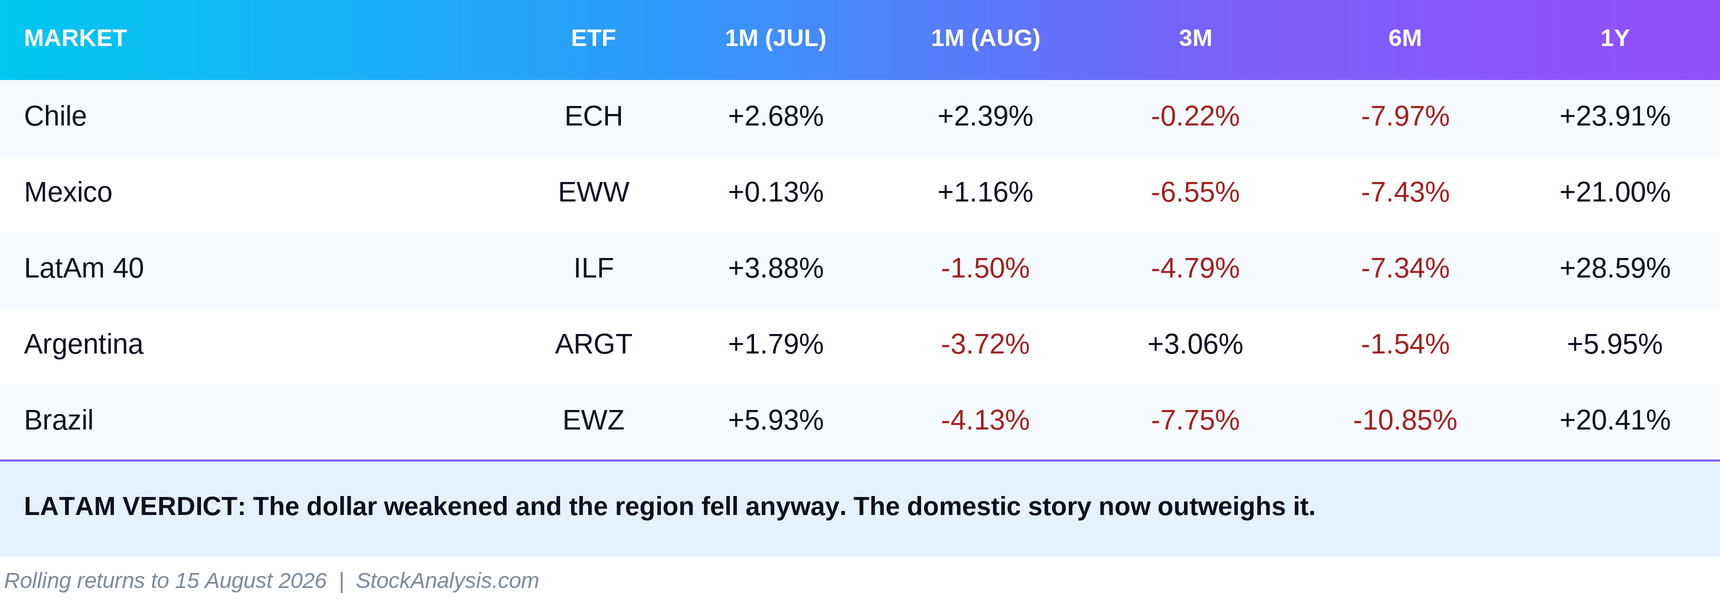
The Broad Dollar Index weakened by roughly 1.45%, so the main external pressure on the region eased. Even so, the regional benchmark ILF falls 1.50%, and Brazil and Argentina are among the weakest markets in the entire dataset. When the external explanation disappears and the move remains, the cause is domestic.
Brazil (EWZ, -4.13%) fully reverses July, when it was the region’s strongest market at +5.93%. The Ibovespa strung together consecutive daily declines through August. There are two causes and both are local: the Selic policy rate sits at 14.00%, which makes government bonds far more attractive than equities for the domestic investor, and non-energy commodities stayed weak. The three-month return is -7.75% and the six-month -10.85%. July’s recovery did not become a trend.
Argentina (ARGT, -3.72%) is the more significant news, because for the first time since this analysis began the market diverges from the region downward rather than upward. Country risk, meaning the extra yield investors demand to hold Argentine debt instead of US debt, rose to roughly 480 basis points, the highest since June. Bank stocks led the decline after investors took profits on the earlier financial-sector rally. Separately, weak industrial and construction data arrived alongside faster inflation in Buenos Aires. The reform thesis, meaning fiscal consolidation and currency liberalisation, is not cancelled: the three-month return remains +3.06%. But the month shows this market has its own cycle, and that cycle can turn down as well as up.
Chile (ECH, +2.39%) is the strongest market in the region, which makes sense. Chile is tied to the copper cycle, and copper depends on Chinese industrial demand. The recovery in Chinese funds during August and the weaker dollar work in the same direction. The six-month return remains -7.97%, however, so this too is a bounce from a low base.
Mexico (EWW, +1.16%) stays positive but without strength. Proximity to the United States is a long-term trade advantage and at the same time a source of political risk through tariffs and the coming USMCA negotiations. Investors are not fleeing Mexico, but they are not paying a premium for it either.
Rotation Signal and Conclusion
Global capital is moving toward real assets and toward sectors that benefit from higher rates for longer, and away from bond proxies and from emerging markets with domestic problems.
This is not panic. A VIX of 14.63 describes a calm market. Nor is it defensive repositioning: US health care is rising, but alongside energy, technology, materials and industrials. Leadership is broad. What changed is the criterion by which capital chooses.
Three themes dominate the August rotation.
The first is the return of the energy premium, and it is symmetric. US XLE gains 9.11%, European EXH1 gains 6.60%. In July both sectors fell by almost the same amount because the market bet on the Strait of Hormuz reopening. In August it bet the other way. The mechanism is physical rather than financial: 4.9 million barrels per day now pass through the strait against 21.6 million before the conflict, and the Energy Information Administration raised its 2026 Brent forecast to $87. July’s edition of this analysis called energy an event-driven position with preserved upside optionality. The reversal took one month.
The second is the inversion of the rate conversation. The Fed held on a 9 to 3 vote with the three dissenters wanting an increase. The ECB has already raised once in June and the market expects another move in September. The Bank of Japan has its own dissenter calling for 1.25%. In all three economies the risk to the next move is upward, not downward. The proof in prices is cross-regional: US utilities fall 3.08%, European utilities fall 4.57%, and both are the weakest sectors in their own tables. Classic bond proxies lose in synchrony because the long end of the curve is rising in both regions.
The third is the splitting of emerging markets in two. Asia rises across the board, including China for the first time in months. Latin America falls even though the dollar weakened. Investors are no longer buying emerging markets as a single category. Asia offers an identifiable earnings driver through the AI and semiconductor cycle. Latin America offers commodities at weak prices, a 14% policy rate in Brazil and rising country risk in Argentina. The difference is not the dollar. The difference is whether a market has something to sell the world.
The quiet signal this month is the dollar itself, or rather its silence. For three consecutive months the direction of the dollar explained Latin America almost on its own. In August the dollar weakened and the region fell. When a reliable relationship stops working, it usually means local risk has grown large enough to overwhelm the global factor. The practical consequence for an investor is that a bet on Latin America based on an expected weaker dollar is no longer enough. It now requires a separate view on the Selic rate, on Argentine country risk and on commodity prices.
A second, quieter observation: European automobiles turn positive for the first time in months, by 0.20%. The temptation is to call it a bottom. The numbers do not support it. Minus 12.24% over six months, minus 14.07% over one year and minus 27.55% over three years describe a sector losing market share, not a sector waiting for the cycle. One flat month in a strong period for Europe is stabilisation, not a turn.
August’s rotation is broader than July’s and less dependent on a single theme. Investors hold energy, semiconductors, banks and health care at the same time, meaning assets with very different logic. What they have in common is that each has its own source of profit that does not depend on a rate cut. That is the definition of a market that no longer relies on central banks.
The first test comes before September. There is no Fed meeting in August, so the Jackson Hole symposium from 27 to 29 August is the only point at which the long end of the curve receives new information. Three meetings then follow within nine days: the ECB on 10 September, the Fed on 15 and 16 September, and the Bank of Japan on 17 and 18 September. A fifth event has no date: the Strait of Hormuz negotiations. If the strait reopens, energy will hand back its premium as fast as it took it and inflation pressure will ease. If it stays closed and all three central banks tighten, the combination of expensive oil and rising rates will test precisely those cyclical sectors that lead today.
Data and Macro Sources
ETF performance: StockAnalysis.com, retrieved on 15 August 2026. Returns are rolling performance figures as displayed by the source:
https://stockanalysis.com/
Federal Reserve effective rate and 10-year yield: https://fred.stlouisfed.org/series/DFF and https://fred.stlouisfed.org/series/DGS10
Broad Dollar Index: https://fred.stlouisfed.org/series/DTWEXBGS
FOMC decision of 29 July 2026 and meeting calendar: https://www.federalreserve.gov/newsevents/pressreleases/monetary20260729a1.htm and https://www.federalreserve.gov/monetarypolicy/fomccalendars.htm
US consumer price index for July 2026: https://www.bls.gov/cpi/ and https://www.cnbc.com/2026/08/12/cpi-inflation-report-july-2026.html
ECB decision of 23 July 2026 and meeting calendar: https://www.ecb.europa.eu/press/calendars/mgcgc/html/index.en.html
German 10-year government bond yield, daily Svensson series: https://api.statistiken.bundesbank.de/rest/download/BBSIS/D.I.ZST.ZI.EUR.S1311.B.A604.R10XX.R.A.A._Z._Z.A
Bank of Japan decision of 31 July 2026: https://www.boj.or.jp/en/mopo/mpmdeci/mpr_2026/k260731a.pdf
30-year Japanese government bond auction of 6 August 2026: https://www.mof.go.jp/english/policy/jgbs/auction/calendar/eresul/eresul20260806.htm
EIA Brent forecast and Strait of Hormuz flows: https://www.eia.gov/outlooks/steo/
Daily Brent and WTI spot prices, Energy Information Administration: https://fred.stlouisfed.org/series/DCOILBRENTEU and https://fred.stlouisfed.org/series/DCOILWTICO
Chairman Kevin Warsh press conference, 29 July 2026: https://www.federalreserve.gov/mediacenter/files/FOMCpresconf20260729.pdf
Jackson Hole Economic Symposium, 27 to 29 August 2026: https://www.kansascityfed.org/research/jackson-hole-economic-symposium/
Strait of Hormuz developments in August 2026: https://www.cnbc.com/2026/08/11/hormuz-oil-prices-us-iran.html and https://www.aljazeera.com/economy/2026/8/12/oil-prices-rise-as-attacks-dent-hopes-for-strait-of-hormuz-reopening
Argentina country risk and Merval performance: https://www.riotimesonline.com/argentina-markets-merval-peso-friday-august-14-2026/
Brazil Ibovespa and the Selic rate: https://www.riotimesonline.com/brazil-markets-ibovespa-real-friday-august-14-2026/
Liquidity Desk | liquiditydesk.org