

Introduction
On 2 August, Iranian foreign minister Abbas Araghchi agreed that the Strait of Hormuz would reopen. Within eight days Brent fell from $89.84 to $83.55 a barrel and US WTI from $86.69 to $78.18. Gasoline was 4.1% cheaper on the week, diesel 4.7%. The thing that had held the world economy hostage since February appeared to loosen its grip.
In the July edition we described a wound stitched with thin thread. Over the last ten days of July the thread tore. On 17 July three American soldiers were killed in Jordan. On 23 July Brent touched $100 and the US bond market began pricing an inflation shock. On 28 July Iran fired ballistic missiles at an American base, and on 29 July the United States struck back. Then, in the space of a week, everything was stitched shut again.
This issue is about what remains underneath. Because almost every number that looks better this month looks better for the wrong reason. US unemployment is falling because people are giving up looking for work. Inflation is falling because it measures a month that no longer exists. China has made the largest injection in the history of its own series and received a record low in credit growth. And markets rose 5% in a week on an employment report that showed jobs being shed.
The wound has healed on the surface. The question is what tissue lies underneath.

Block 1: Central Banks
Three of the four major central banks met between 23 and 31 July. None of them moved. All three had a minority that wanted tighter policy.
But the unchanged rates conceal movement that the headlines do not show. The Fed is slowly expanding its balance sheet. The Bank of Japan is shrinking its own by 3.7% in a month. And the ECB, whose balance sheet appears at first glance to collapse by €176 billion, is in fact barely moving. This is why we track quantities, broken down by cause, rather than the announced levels.
1.1 Federal Reserve
The Fed balance sheet (WALCL) stands at $6.738 trillion as of 29 July, against $6.736 trillion on 24 June, a rise of $2.5 billion on a last Wednesday against last Wednesday anchor. Inside the month, though, the balance sheet climbs: $6.725 trillion on 1 July, then 6.736, 6.743, 6.747, before easing to 6.738. The first week of August takes it to $6.749 trillion. Since quantitative tightening ended in December, the Fed is no longer draining liquidity. It is slowly putting it back.
On 29 July the committee held the target range at 3.50 to 3.75%, but on a vote of 9 to 3, with all three dissenters wanting a hike. This is hawkish dissent, which sets the meeting apart from almost anything in the past three years.
Kevin Warsh was unambiguous at the press conference: “There is no soft target, no implicit target. There is only a target and it is 2 percent.” The Fed “will not flinch” and “will not be constrained by market prices”. The decision is not a pause but a “thorough review”, and the current moment is a “period of vigilant thinking, not vigilant waiting”. On the autumn, he expects “all the action between September and December”.
Regime: neutral, with a slight upward tilt in quantities. Since quantitative tightening ended, the balance sheet is not shrinking but slowly growing, and the Fed is the only one of the two Western central banks for which that is true. The vote points the other way, with three members wanting a hike. The numbers and the composition diverge, and that divergence is precisely where the Fed stands right now.
1.2 European Central Bank
On 23 July the ECB held all three rates: deposit facility 2.25%, main refinancing 2.40%, marginal lending 2.65%. The decision was unanimous, but Lagarde said that “some colleagues raised the question of whether to act now”.
The statement is cautious in the same way. The outlook for energy prices is “close to the baseline of the June projections and well above the levels recorded prior to the conflict”, uncertainty remains high, and “the full inflationary impact of the energy shock has yet to play out”. Risks to inflation are to the upside, risks to growth to the downside. And explicitly: “We are not pre-committing to a particular rate path.”
The balance sheet looks like the story of the month, and it is not. From €6.117 trillion on 26 June to €5.941 trillion on 31 July, a fall of €176.0 billion over five weeks, or 2.88%. Almost all of it happens in a single week: €134.2 billion vanishes by 3 July, while the remaining four weeks together account for €41.8 billion.
The cause is not policy. The Eurosystem weekly financial statement says so plainly: the decrease of €159.7 billion in gold and gold receivables reflected quarterly revaluation adjustments, at a price of €3,535.677 per fine ounce. This is a quarter-end accounting revaluation, not liquidity withdrawn. Strip it out and the balance sheet shrinks by €16.3 billion over five weeks, or 0.27%.
The more honest measure is excess liquidity, because revaluations do not touch it. It falls to €2.147 trillion from €2.199 trillion, a drop of €51.2 billion, or 2.33%. The breakdown as at 6 August: current account holdings €363.7 billion, deposit facility €1.958 trillion, reserve requirements €174.7 billion.
Six days after the meeting, the ECB blog published something the statement does not say. Niccolò Battistini and Giovanni Trebbi conclude that, unlike the 2022 episode, the current inflation is first and foremost a supply shock rather than a demand one, and that “a supply-driven inflation episode does not automatically call for the same forceful tightening that demand-pull inflation would warrant”. This is the ECB semi-officially explaining why it stopped after one hike.
Regime: neutral. The rate is unchanged, and the balance sheet, cleaned of the gold revaluation, contracts by less than a third of a percent over five weeks. The portfolios are running off without reinvestment, but at a pace that does not move liquidity. Markets price a deposit rate of 2.75% by early 2027.
1.3 Bank of Japan
On 31 July the Bank of Japan held its short-term policy rate at 1.00%, the highest level since September 1995, on a vote of 8 to 1. The sole dissenter, Hajime Takatomi, wanted 1.25%.
The balance sheet is shrinking sharply: ¥639.6 trillion in June against ¥664.4 trillion in May, a fall of ¥24.8 trillion, or 3.7% in a single month. The monetary base is down 13.8% year on year in July, deepening from minus 13.7%.
The yen appreciated 3.18% in July, from 162.61 to 157.43 to the dollar, but not because carry trades unwound. Tokyo most likely intervened in the currency market after the yen fell to a forty-year low. Official intervention data is published on 28 August.
Regime: the most aggressive genuine tightening of the four, executed through quantities rather than rates.
1.4 People’s Bank of China
Here everything reverses against the July edition. The balance sheet is growing: CNY 49.43 trillion in June against CNY 48.38 trillion in May, a rise of CNY 1.05 trillion, or 2.2% in a month. Bank balance sheets too, by CNY 2.97 trillion.
Rates do not move. The one year loan prime rate stands at 3.00%, the five year at 3.50%, a fourteenth consecutive month at a record low. The reserve requirement ratio is 7.50%, the seven day reverse repo rate 1.40%, the fourteen day 1.65%. The medium-term lending facility holds at CNY 500 billion.
But one line changes the whole picture. Injections through outright reverse repo reached CNY 2.4 trillion in July against CNY 1.1 trillion in June, a peak for the entire available history of the series. At the same time ordinary reverse repo is effectively switched off: CNY 1 billion on 7 August, against a record low of zero in June 2026.
So the PBoC is injecting with record force through one instrument while having stopped another. The result is in Block 2.
Regime: quantitative expansion without transmission.
Block 1 Synthesis
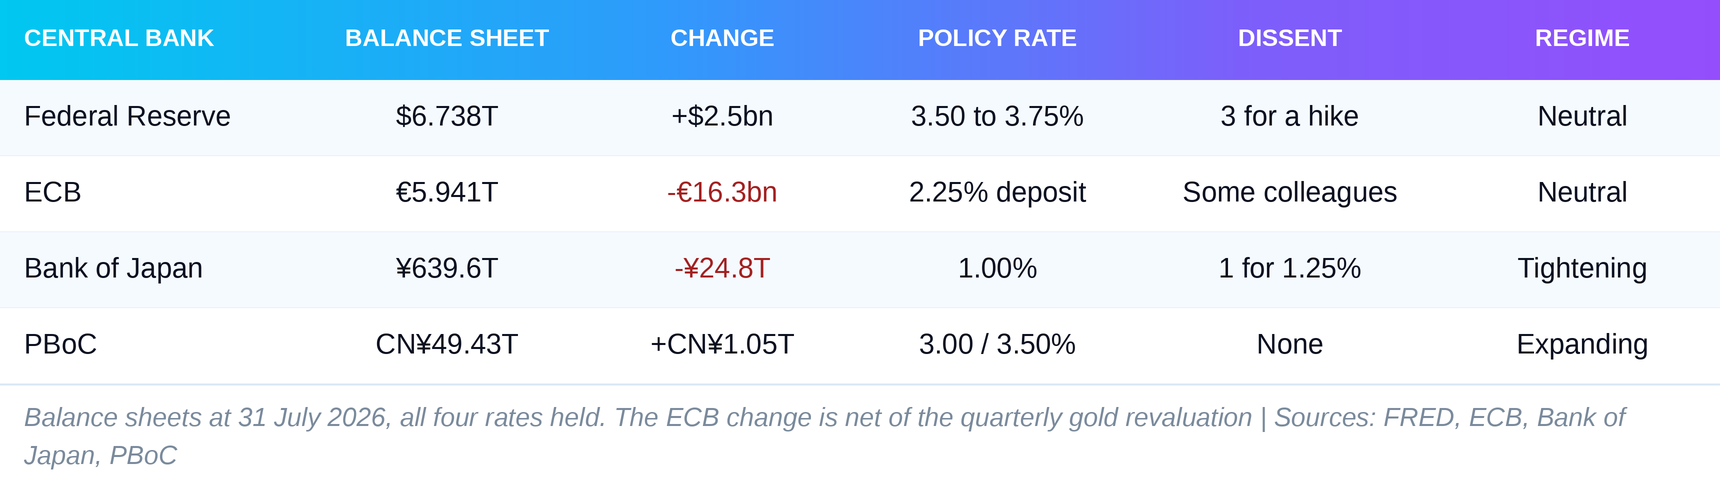
The Fed, the ECB and the Bank of Japan share the same shape: a minority that wants tighter policy. The majority is waiting, and for the same reason. None of them hiked.
Block 2: Money and Credit Transmission
2.1 United States
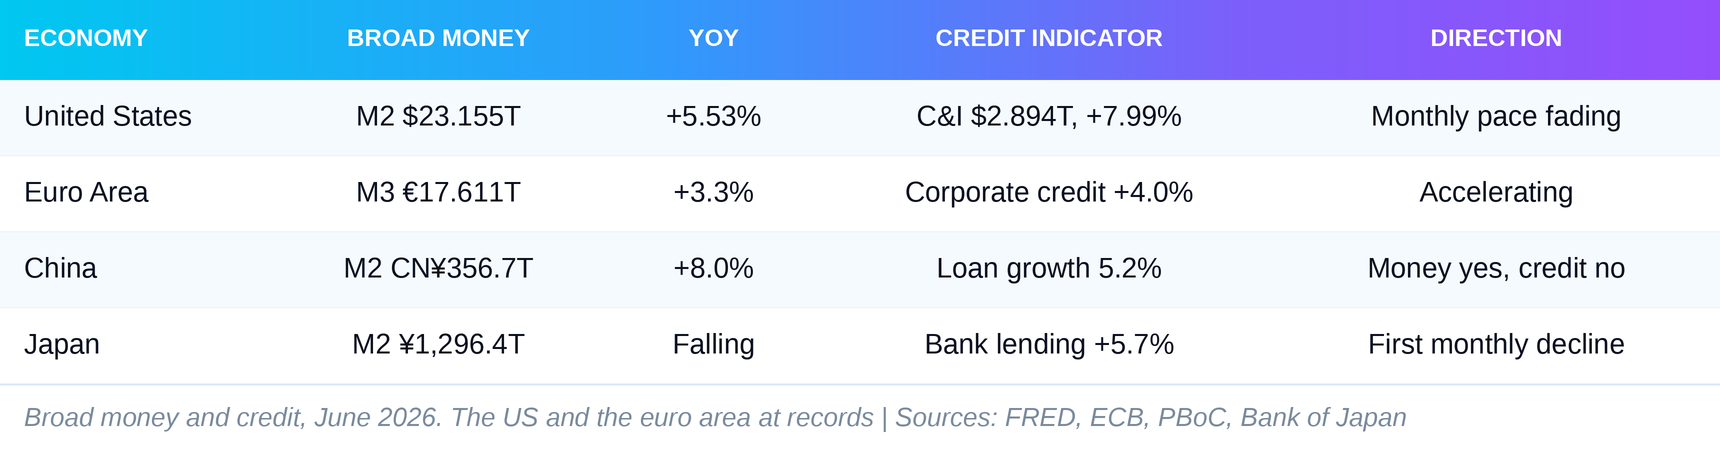
M2 set a new record of $23.155 trillion in June, up from $23.056 trillion in May, a gain of 5.53% year on year. But the monthly pace is slowing, from plus 1.12% in May to plus 0.43% in June.
Commercial and industrial loans (BUSLOANS) stand at $2.894 trillion, up 7.99% year on year. The annual figure still looks strong. The monthly one does not:
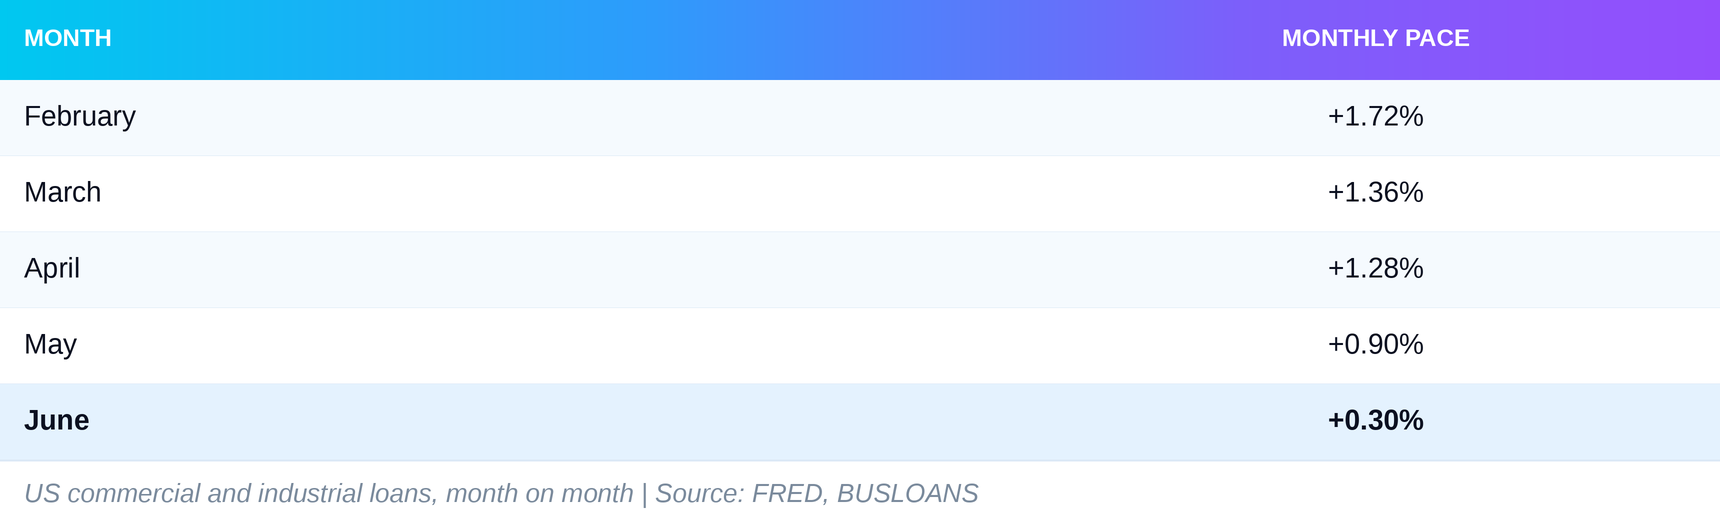
Five consecutive months of deceleration, without a single exception. This is precisely the engine the July edition argued was neutralising the tightening from central banks. It has not stopped. It is fading.
2.2 Euro Area
M3 set a new record of €17.611 trillion in June, up from €17.523 trillion, and the annual rate accelerates to 3.3% from 3.2%. Credit to non-financial corporations rises to €5.467 trillion, with its annual rate climbing to 4.0% from 3.4%. Household credit runs at 3.0%, mortgage lending at 3.1%.
There are two things beneath the surface that the ECB itself reports. Credit standards for business loans tightened in the second quarter, and growth in corporate bond issuance fell from 4.5% to 3.4%. So the acceleration in bank credit is partly a switch out of the bond market rather than new credit.
2.3 China
M2 set a record of CNY 356.7 trillion in June, with a monthly gain of 0.86%, far above the 0.18% of the previous month. M1 jumps 3.12% in a month. Total social financing, or TSF, the broadest measure of credit reaching the economy, recovers to CNY 3.36 trillion from CNY 2.03 trillion, and new bank loans triple to CNY 1.61 trillion from CNY 520 billion.
And despite all of that:
The annual rate of M2 slows to 8.0% from 8.6%, below a forecast of 8.5%
Loan growth is 5.2%, the floor of the entire series
June TSF sits below the CNY 4.22 trillion of a year earlier and below a consensus of CNY 3.77 trillion
Loans to the private sector stand at CNY 82.90 trillion, below the peak of CNY 84.00 trillion reached in June 2025
Fixed asset investment deepens its decline to minus 5.7% from minus 4.1%
Consensus for July TSF, released on 13 August, is CNY 1.22 trillion. It is expected to collapse back.
The central bank is injecting at record scale, the money moves into transactional balances, and there it stops. This is liquidity circulating inside the system without leaving it.
2.4 Japan
M2 falls to ¥1,296.4 trillion from ¥1,298.1 trillion, and M3 with it, to ¥1,640.0 trillion from ¥1,641.8 trillion. The July edition recorded new records on both. The turning point is this month.
Bank lending, however, is still growing at 5.7% year on year, and loans to the private sector rise to ¥596.5 trillion. So private credit is holding while the monetary quantities are already contracting, with the monetary base at minus 13.8%.
Block 2 Synthesis
Block 3: Net Fed Liquidity and Its Relationship to M2
Net Fed Liquidity is calculated as the Fed balance sheet minus the Treasury General Account minus overnight reverse repo. This is the liquidity genuinely available to the financial system.
As of 29 July it stands at $5.825 trillion, against $5.812 trillion on 24 June, a rise of $12.4 billion for the month. The components: balance sheet $6.738 trillion, Treasury account $910.8 billion, reverse repo $2.6 billion.
The buffer is exhausted. Reverse repo is $2.6 billion. In 2023 it stood above $2 trillion. That means every further issue of government debt is now financed directly out of bank reserves rather than out of cash parked to one side. The mechanism that absorbed fiscal pressure for three years is gone.
The divergence with M2 keeps widening. Compared on a like for like basis, from the last Wednesday of July 2025 to the same date this year, M2 adds $1.212 trillion, from $21.943 trillion to $23.155 trillion. Net liquidity over the same period does not stand still. It falls by $291.8 billion, from $6.117 trillion to $5.825 trillion. The distance between the two opens from $15.826 trillion to $17.330 trillion, a further $1.5 trillion in twelve months.
The decomposition shows where the fall comes from. The Fed balance sheet over the year actually grows by $95.6 billion. But the Treasury General Account absorbs $540.3 billion, and reverse repo, which used to absorb that pressure, empties from $155.5 billion to $2.6 billion. The Fed is adding liquidity, the Treasury is withdrawing nearly six times as much, and that difference is the net tightening nobody announced.
When M2 grows while net liquidity falls, monetary expansion is not coming from the federal balance sheet. It is coming from bank credit and from the fiscal deficit. The July edition put it that way and it still holds. What is new is that bank credit has now decelerated for five consecutive months.
Block 4: Credit Stress
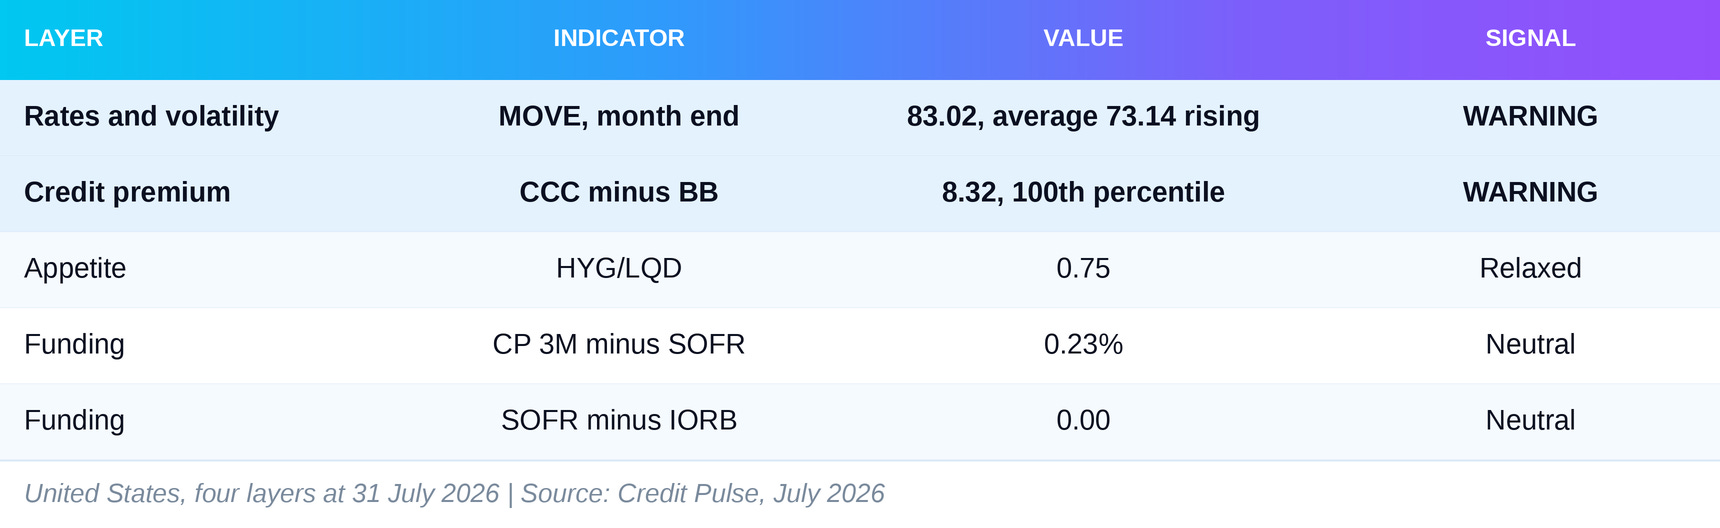
The full breakdown of credit stress appears in our separate monthly issue, Credit Pulse, which publishes the week before this one and tracks four layers, rates and volatility, credit premium, appetite and funding, separately for the United States, Europe and Asia, with percentiles and thresholds for every indicator. The figures here come from the July issue, published on 2 August. Only what matters and what moves the regime is kept.
The United States enters a warning regime for the first time since the series began. Two of the four layers are in warning.
Europe is calm across all four layers. The euro high yield spread is 2.65%, the Italian to German spread 81.4 basis points, appetite sits in the 92nd percentile, and the clean funding spread is 17 basis points.
Asia is neutral, entirely through Japan and through two loaded springs. The Hong Kong dollar is at 7.8433, seventeen pips from the weak end of its band, while three month HIBOR is 72 basis points below SOFR. The thirty year Japanese yield closes the month at 3.980, two basis points from its threshold.
The two warnings do not contradict each other. They explain each other. MOVE jumps because on 23 July the bond market began pricing an inflation shock. The CCC minus BB spread widens to a peak for the entire available window while BB itself does not move. So the widening is confined to the weakest part of credit rather than being broad. This is exactly the signature of expensive energy: the higher quality absorbs the hit without difficulty, the lower quality does not.
Three thresholds sit one or two basis points away: US funding, the Japanese long end and the Hong Kong dollar. Any of them could turn in a single day.
Block 5: Transmission into Risk Assets
This block is anchored on 7 and 8 August rather than 31 July, because the decisive move happened in the first week of the month.
5.1 Equities
Monthly performance to 8 August:
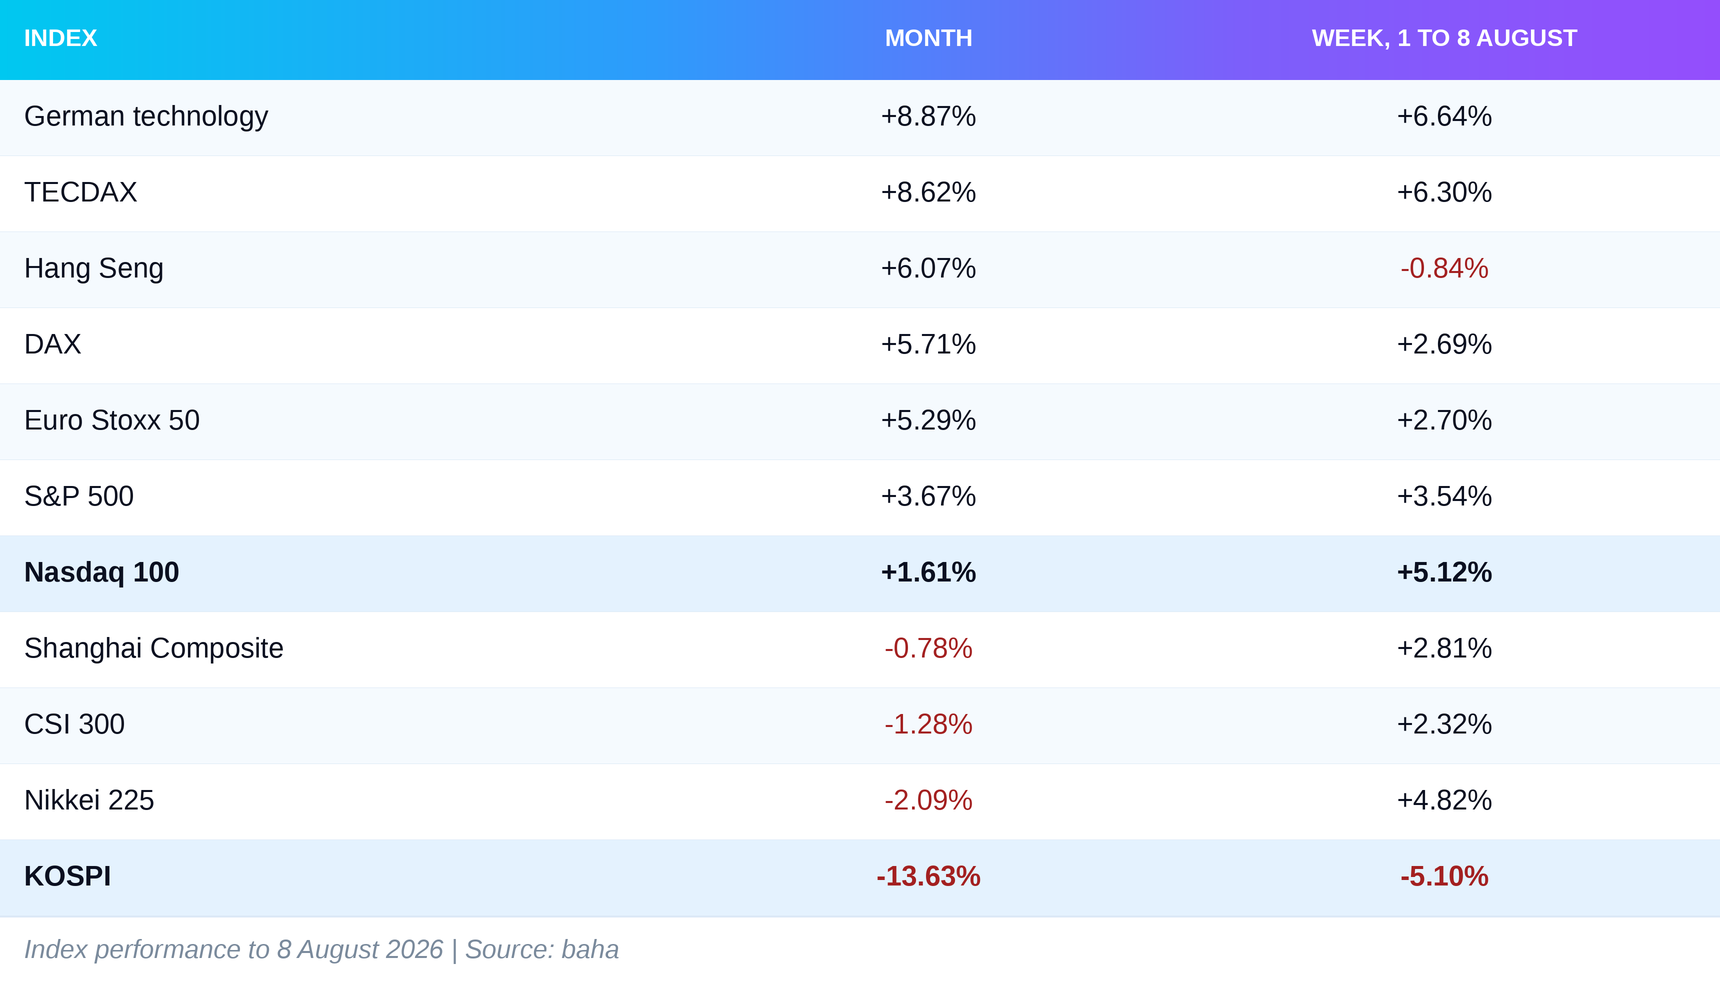
The two extremes tell the month. The Nasdaq 100 is up 1.61% for the month and up 5.12% in the last week alone, meaning it was down around three and a half percent and recovered all of it after 7 August. The employment report showed jobs being shed and the market rallied. Warsh said he expects “all the action between September and December”. The market has just handed him the reason.
KOSPI is down 13.63% in a month, after gaining 33.18% in May and losing 8.10% in June. This is no longer a correction.
European banks keep going. The European banks index moves from 370.05 on 30 June to 390.70 on 31 July, a gain of 5.58%, and reaches 402.90 on 7 August, with a record for the series on 6 August. For the month to 7 August that is 9.45% against 5.29% for the Euro Stoxx 50.
The July edition explained that premium through improved margins after the June hike. But in July the ECB did not hike, and the banks accelerated. So the driver is no longer the past decision. It is the slope of the curve and the expectation of September.
5.2 The Next 30 to 60 Days
The base regime remains risk-on, but for steadily narrower reasons. Private credit in the United States has decelerated for five consecutive months, China’s is at the floor of its series, Japanese monetary quantities are contracting, and the only genuine acceleration is euro area bank credit, against tightening standards.
The condition that has to hold is that second-round inflation does not start. Oil is back at $83, but gas, diesel and liquefied natural gas have not come back. If those prices stay where they are through the end of the third quarter, the gap between US and euro area inflation will widen, and the ECB will get a reason to hike in September at precisely the moment the Fed gets a reason to cut.
The primary risk is not geopolitical but domestic to the United States: the labour market cracked faster than inflation cooled. The employment report of 7 August showed 23,000 jobs lost in July against a consensus of 80,000 gained, and revisions took a further 103,000 off the previous two months. Labour force participation is at a four-year low. Core PCE, the measure the Fed watches most closely, stands at 3.29% against a 2% target. If Warsh has to choose between the two, the three dissenters of 29 July will not be the minority that decides.
The dates: 12 August, US CPI for July. 13 August, Chinese credit data, with consensus for TSF to collapse to CNY 1.22 trillion. 27 to 29 August, Jackson Hole, where Warsh said his speech is still a blank sheet of paper. 28 August, Tokyo publishes its currency intervention data. 10 September, the ECB meets.
Block 6: Key Data Changes
The table tracks three groups. Balance sheets show where liquidity is created or withdrawn at the source. Money supply shows whether it reaches the broader system. Credit stress shows whether markets notice the difference at all.
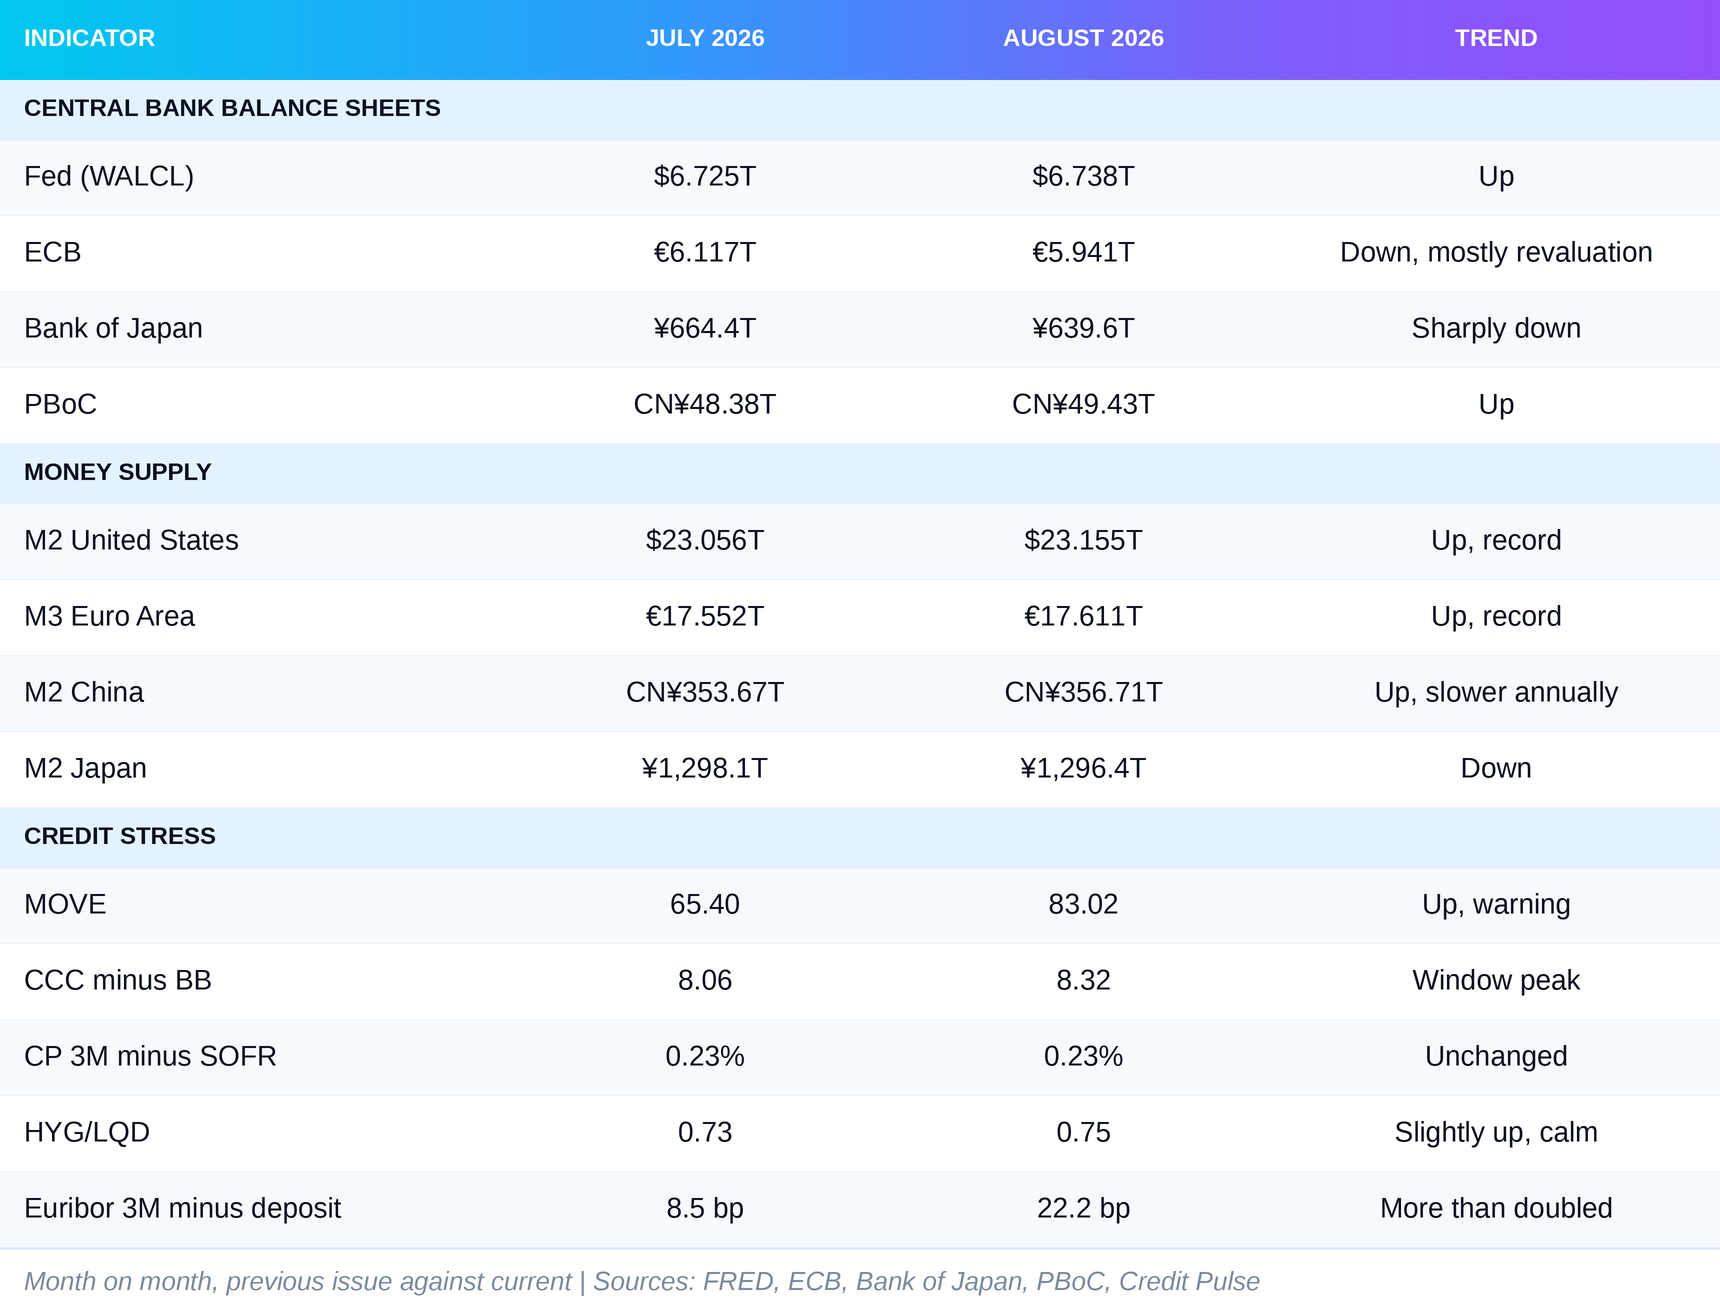
Methodology note. The July column carries the figures the July edition published, not the figures for the calendar month of July. The ECB balance sheet is reported at its announced level, but €159.7 billion of the total €176.0 billion decline is a gold revaluation at the end of the second quarter. The Euribor value is the difference between three month Euribor and the ECB deposit rate. The clean funding spread, adjusted for expectations of the September meeting, is 17 basis points and remains within the neutral band.
Final Liquidity Verdict
Regime: risk-on at the surface, wearing thin underneath.
At the start of the year the market expected rate cuts and looser liquidity through 2026. The wound at Hormuz cancelled that expectation. Not because central banks decided otherwise, but because the inflation that came out of it took away their ability to decide at all.
That is why none of the four eased this month. The Fed held, with three dissenters wanting the opposite. The ECB held, having hiked in June. The Bank of Japan held at its highest level since 1995. China sits at a record low for a fourteenth consecutive month. The wound is in one place, and the inflammation is stopping four systems at once.
The balance sheets look more dramatic than they are. More than ninety percent of the ECB’s decline is a gold revaluation, and the real drain is 0.27% over five weeks. The Fed’s balance sheet is actually growing. The only central bank genuinely shrinking quantities is the Japanese one.
The real tightening is somewhere else, and nobody announced it. Over a year, US net liquidity falls by $291.8 billion while the Fed balance sheet grows by $95.6 billion. The Treasury absorbs the difference, and the reverse repo buffer that soaked up that pressure for three years is now zero. With no idle cash left to absorb new issuance, the deficit is being funded out of bank reserves instead.
The compensation is fading too. The July edition argued that private credit was neutralising the tightening from central banks. The monthly pace of US commercial and industrial loans has fallen for five consecutive months, from 1.72% in February to 0.30% in June. In China the contrast is sharper still: the largest outright reverse repo injection in the history of the series, alongside credit growth at the floor of that same series. There is money. There is no credit.
That is why M2 is at a record everywhere while the liquidity that actually reaches markets is not. The distance between the two in the United States opened by a further $1.5 trillion over twelve months.
The next thirty to sixty days will answer which breaks first, inflation or employment. If inflation returns, the three dissenters of 29 July become the majority and easing is postponed again. If employment keeps falling, the Fed will be cutting in a month with triple-digit oil behind it. Either way liquidity stays where it is now: enough to hold markets up, not enough to expand them.
Healed on the surface does not mean cured. It only means it can no longer be seen.
Sources
Federal Reserve; FRED (WALCL, WTREGEN, RRPONTSYD, BUSLOANS, M2SL, BAMLH0A1HYBB, BAMLH0A3HYC, ECBASSETSW); European Central Bank (monetary policy statement of 23 July, daily liquidity conditions, Eurosystem consolidated financial statement of 3 July and 17 July, ECB Blog of 29 July); Bank of Japan; People’s Bank of China; US Bureau of Labor Statistics; US Bureau of Economic Analysis; Trading Economics; TradingView; baha.