

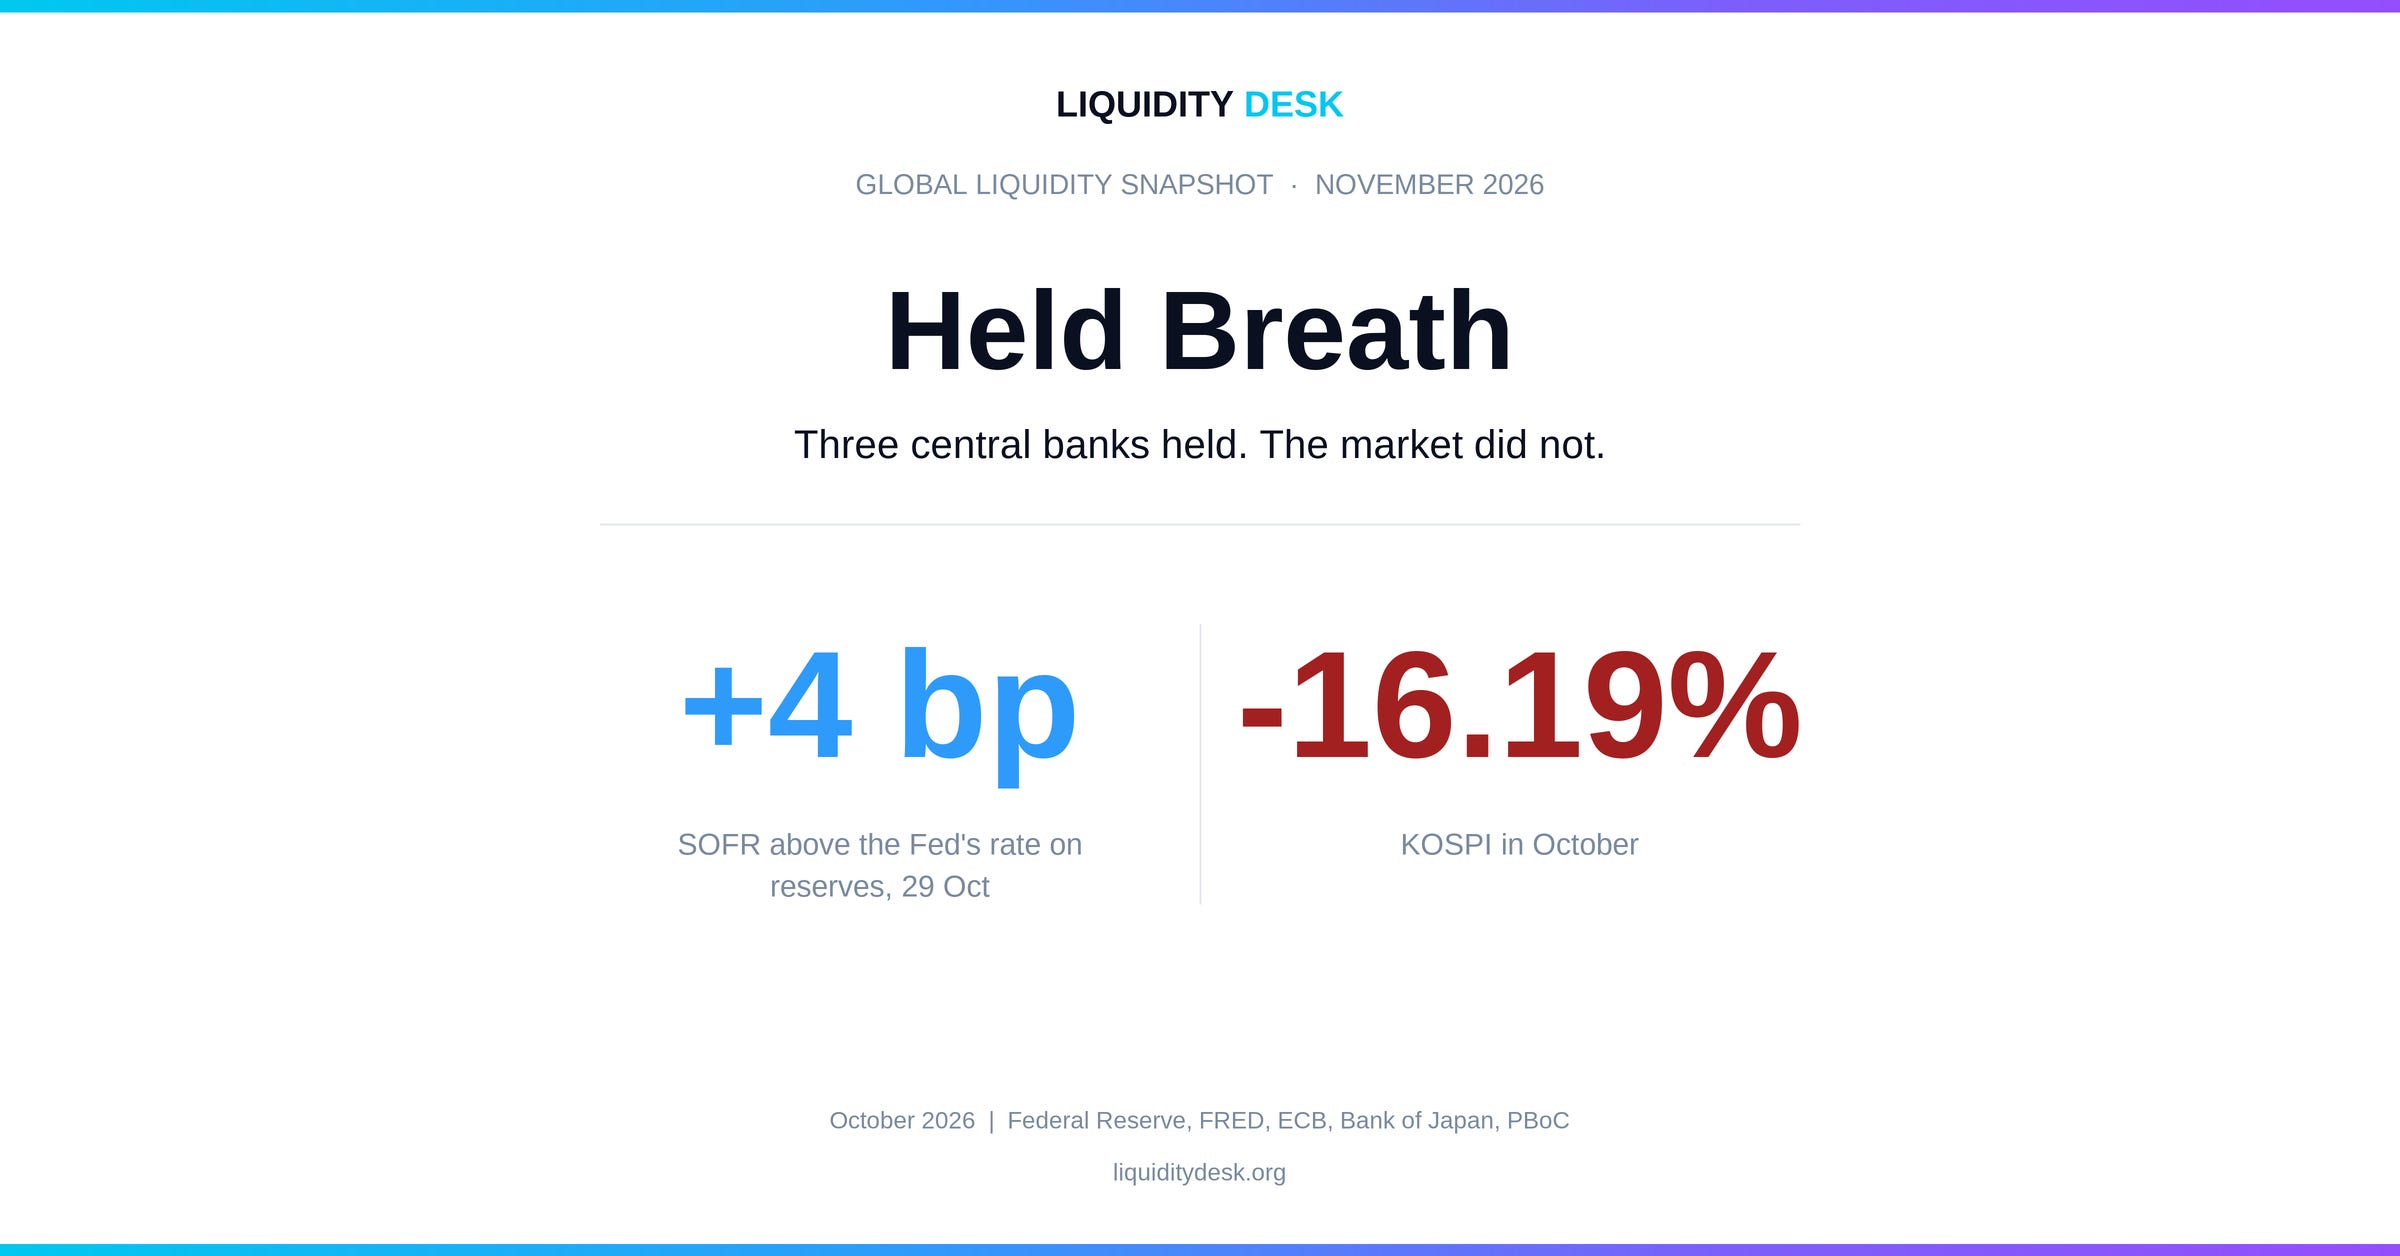
Three central banks held rates within three days, and at all three a hike was on the table. Quantities barely moved. The overnight money market, however, now pays more than the Fed pays on reserves.
Introduction
On 30 October South Korea’s KOSPI fell 3.48% in a single session. The night before, Alphabet lost more than 12% on Wall Street after its third-quarter revenue disappointed and revived doubts about whether the enormous investment in artificial intelligence will pay off. SK hynix, one of the largest makers of memory for AI servers, lost 7.08% on the day. Over the whole of October the KOSPI is down 16.19% and the Nasdaq 100 6.65%. A month earlier the Nasdaq 100 was the strongest index in our table. Now September’s winners are among the biggest losers, while the Russell 2000 and the broad European STOXX Europe 600 finish the month higher.
In the same three days the three large central banks met: the Fed on 28 October, the ECB on 29 October and the Bank of Japan on 30 October. None raised rates. Yet at all three a hike was on the table. At the Fed two members voted for one. At the ECB the Governing Council debated whether one was appropriate. At the Bank of Japan one member proposed 1.50%. This is not a pause in the usual sense. It is a held breath: the decision has been postponed, not cancelled.
Beneath the pause, quantities are almost standing still. Net Fed Liquidity is $17.6 billion smaller, euro area excess liquidity €33.3 billion smaller, the Bank of Japan’s balance sheet is practically motionless, and China’s central bank added liquidity in September. But even with a held breath the body keeps burning oxygen. Since 23 October SOFR, the rate on secured overnight money, has been above the rate the Fed pays on bank reserves for five sessions in a row. The question this month is what happens inside the system while the central banks wait.
Central Banks
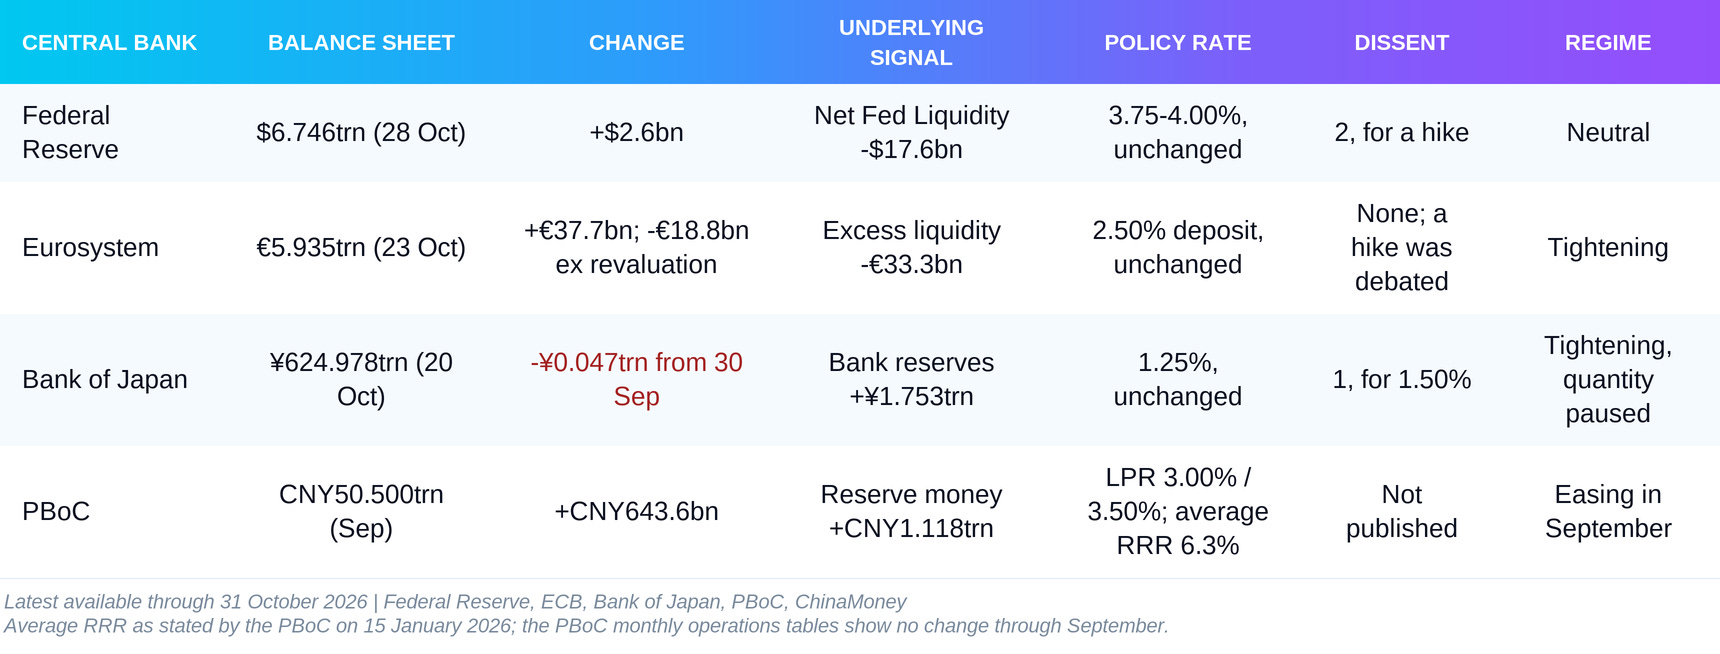
Three of the four banks held rates, but holding does not mean doing nothing with the quantity of money. The Fed is neutral on both price and quantity. The Eurosystem keeps withdrawing liquidity, and the market tightens on its behalf through long-term rates. The Bank of Japan pauses its quantitative shrinkage for the first 20 days of October. China’s central bank is the only one that added liquidity in the latest measured month.
Federal Reserve
The Fed balance sheet stands at $6.746 trillion as of 28 October, against $6.743 trillion on 30 September. The difference is $2.6 billion, so the balance sheet is standing still. Maturing Treasuries are rolled over, and principal from mortgage-backed securities is reinvested in Treasury bills. The instruction to the New York Fed also keeps one permission in place: to buy Treasury bills when needed to maintain ample reserves. A permission is not a purchase, and no such purchases show up in the October balance sheet.
On 28 October the Fed kept the target range at 3.75-4.00% by a vote of 10 to 2. Lisa Cook and Beth Hammack dissented because they wanted a 25 basis point hike. A month earlier the hike was unanimous, 12 to 0. Now the decision is a hold and the dissent points towards tightening. Interest on reserve balances, the rate the Fed pays banks on their reserves, stays at 3.90%. Net Fed Liquidity falls by $17.6 billion over the month, as the Net Fed Liquidity section shows in detail.
Regime: neutral. Price and quantity are standing still, but two members already want more expensive money.
European Central Bank
The Eurosystem balance sheet grows from €5.897 trillion on 25 September to €5.935 trillion on 23 October, an increase of €37.7 billion. This is not an injection. The quarterly revaluation of gold and foreign currency at the end of September, booked in the statement as of 2 October, adds €56.5 billion to assets. Without it the balance sheet is €18.8 billion smaller. This is exactly why the headline size of the balance sheet should not be read in a revaluation month. A larger balance sheet after a revaluation is not more money for banks.
Excess liquidity, the measure revaluations do not touch, confirms the direction. It falls from €2.109 trillion on 30 September to €2.076 trillion on 29 October, a decline of €33.3 billion, after a fall of €33.0 billion the month before. The APP and PEPP portfolios keep shrinking because maturing principal is not reinvested. On 29 October the ECB kept the deposit rate at 2.50%, the main refinancing rate at 2.65% and the marginal lending rate at 2.90%. Christine Lagarde said the Governing Council had debated whether a hike was appropriate but decided unanimously to wait. Part of the work has already been done by the market: the average 10-year government bond yield in the euro area is about 35 basis points higher than when the September projections were made.
Regime: tightening. Rates are on hold, the quantity keeps draining, and long-term yields are tightening on the ECB’s behalf.
Bank of Japan
In the previous issue the Bank of Japan’s balance sheet was ¥641.281 trillion as of 20 September. Ten days later, on 30 September, it was ¥625.025 trillion. Almost the entire fall of ¥16.3 trillion comes from the government bonds on the balance sheet, which drop from ¥520.303 trillion to ¥504.008 trillion. This is the continuation of the plan for smaller purchases, under which maturing bonds are not fully replaced. In the first 20 days of October the balance sheet is practically motionless.
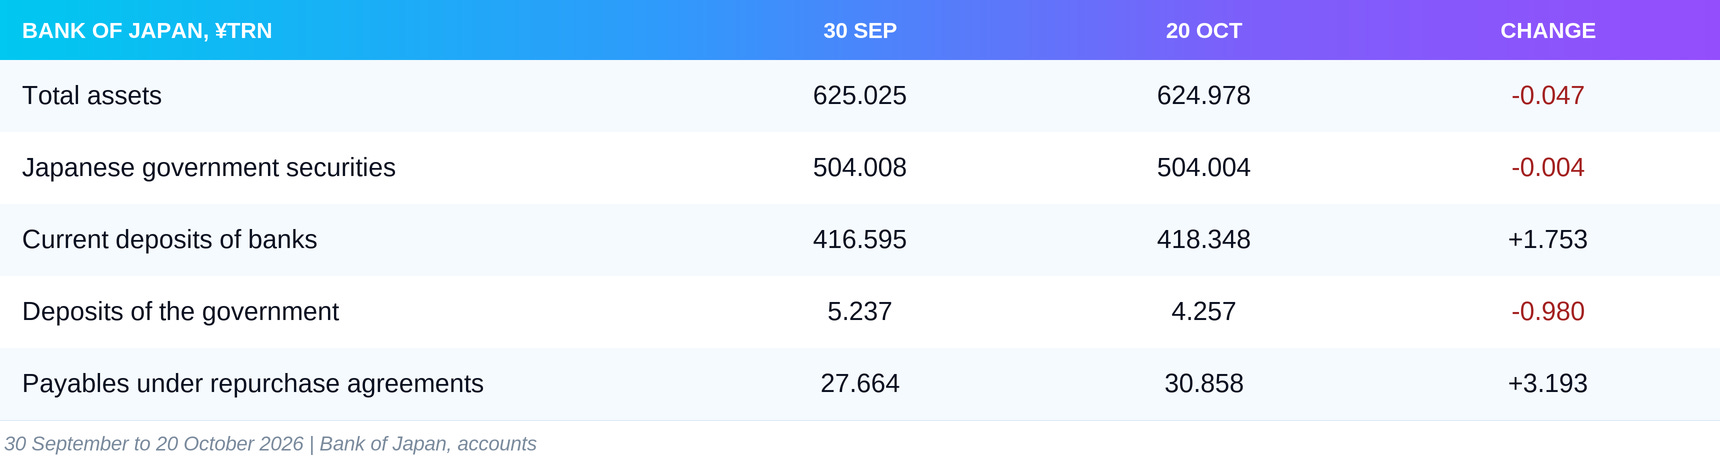
Current deposits, which are the banks’ reserves, rise by ¥1.8 trillion after falling sharply in September. Part of this comes from the government spending out of its account at the central bank. At the same time the Bank of Japan absorbs ¥3.2 trillion through repo transactions, in which it hands out bonds against cash. The monetary base for September is 15.2% lower than a year earlier. The October figure is published on 4 November and will enter the December issue.
On 30 October the Bank of Japan kept its policy rate at around 1.25% by a vote of 8 to 1, with Hajime Takata proposing 1.50%. The board decided unanimously that from January 2027 sales of exchange-traded funds from its portfolio will accelerate from about ¥330 billion to about ¥860 billion a year at book value. This is a future pace, not an October sale.
Regime: tightening, with a pause in quantities. The monetary base is shrinking 15.2% year on year, but in the first 20 days of October the balance sheet does not move.
People’s Bank of China
The latest published balance sheet of the People’s Bank of China is for September, and it reverses August’s direction. Assets grow by CNY 643.6 billion to CNY 50.500 trillion. Reserve money grows by CNY 1.118 trillion, more than the balance sheet itself, because government deposits at the central bank fall by CNY 380.8 billion. When the state spends from its account, the money goes to the banks. September’s operations confirm the direction, with a net injection of CNY 556.4 billion.
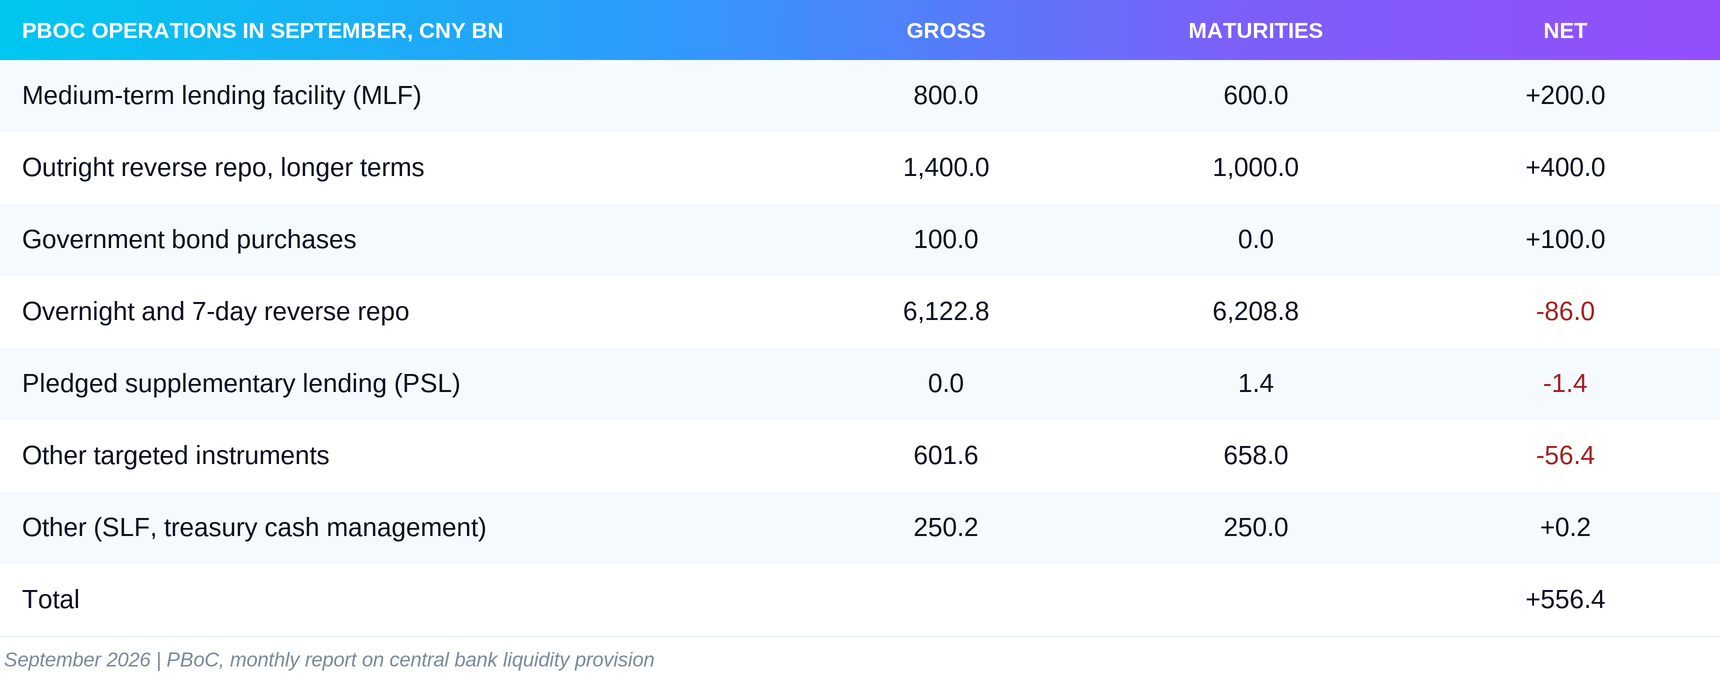
The money comes through the medium-term instruments, not the targeted ones. The targeted programmes are net negative, and the new quotas of CNY 700 billion announced on 29 September do not yet show up in September’s operations. The one-year Loan Prime Rate, the benchmark for bank lending, stays at 3.00% and the five-year at 3.50%. The latest official figure for the average reserve requirement ratio, the share of deposits banks must hold at the central bank, is 6.3%, given by Deputy Governor Zou Lan on 15 January 2026. The PBoC’s monthly operations tables from January to September 2026 show no change.
In October the PBoC also announced new safety nets. On 19 October Governor Pan Gongsheng said the bank would consider moving its main operations from seven days to overnight. On 26 October it created BNSF, a facility that lets large fund managers obtain financing during mass redemptions from bond funds. No size or rate has been announced. A safety net is not liquidity that has been provided.
Regime: easing in September. The balance sheet, reserve money and net operations all grow. October has not yet been measured.
Central Bank Synthesis
Money and Credit Transmission
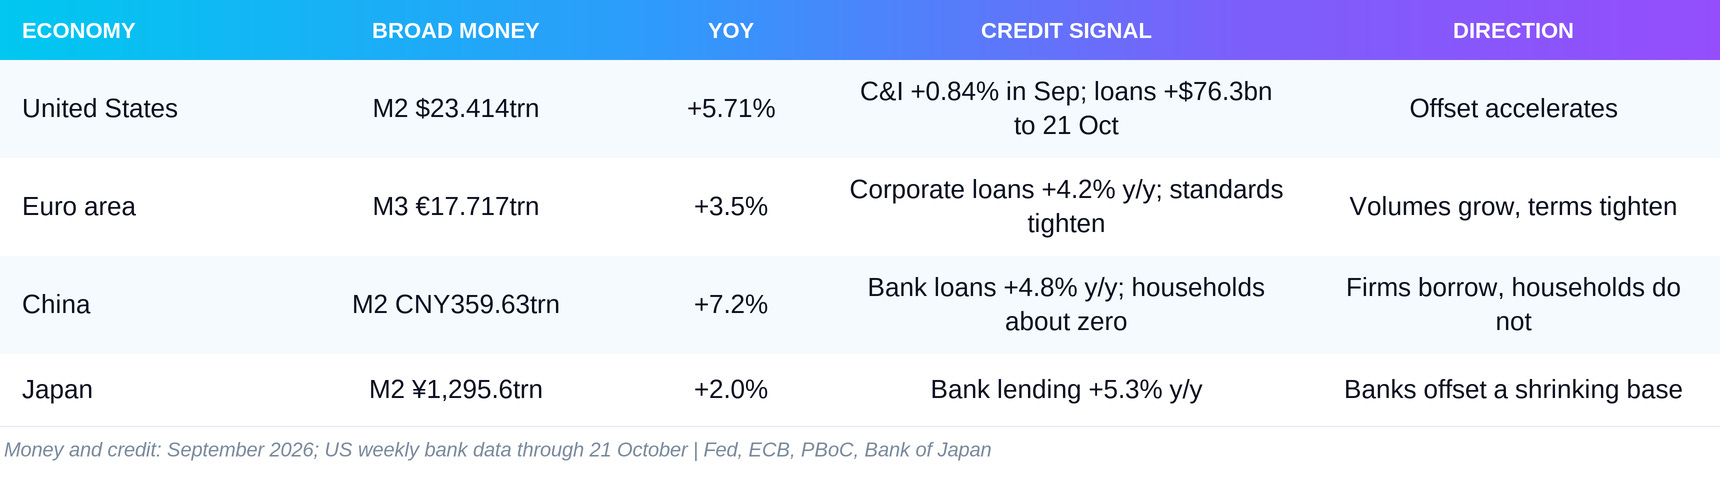
In the previous issue bank credit was the detour along which the system kept moving without help from the central banks. But the data then were for August, before the three hikes. The September data are the first real test. The detour held. In the US the traffic on it is even accelerating. In the euro area volumes are still growing, but banks are already closing some lanes.
United States
US M2 stands at $23.414 trillion in September, up 0.49% on the month and 5.71% on the year. The August level has been revised from $23.343 trillion to $23.301 trillion, so the monthly change should not be calculated from the figure published last month. Commercial and industrial loans, bank lending to businesses, grow 0.84% in September to $2.959 trillion, and the annual pace accelerates to 9.96%.
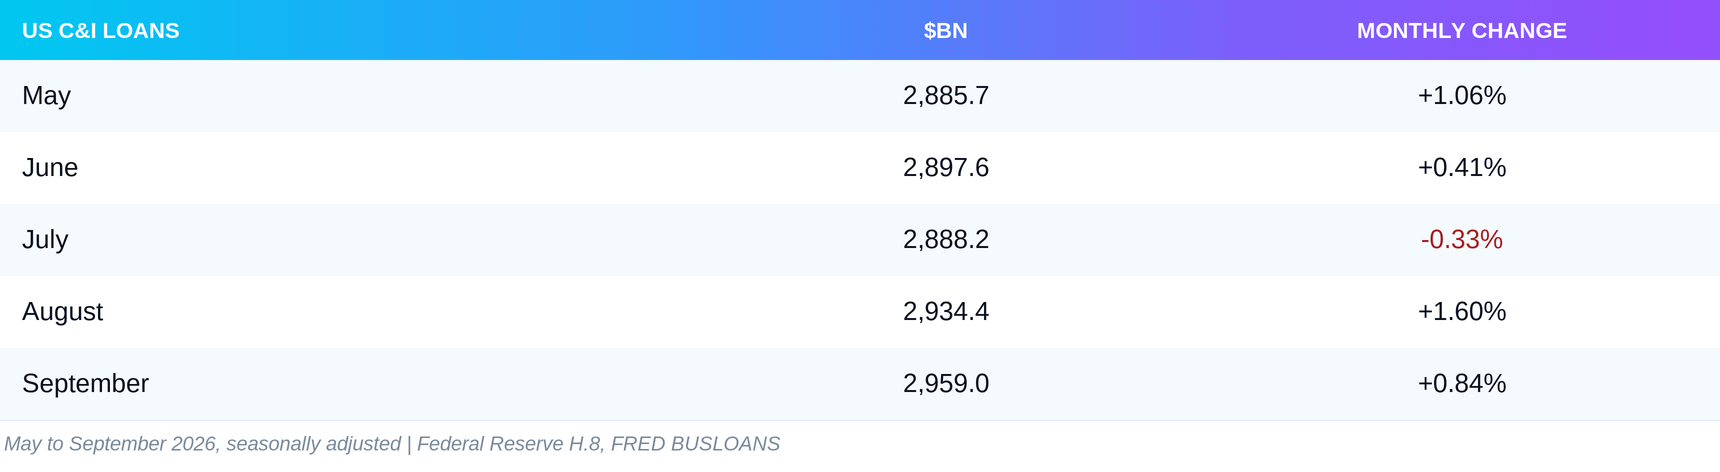
August’s increase has been revised from 1.62% to 1.60%. The weekly data run to 21 October. In the three weeks after 30 September bank loans and leases grow by $76.3 billion and deposits by $76.7 billion. In the previous issue loans added $51.1 billion over four weeks, so the weekly pace is almost twice as high. And unlike August and September, banks are this time also buying securities, by $44.3 billion, so total bank credit grows by $120.6 billion. One technical note: in the week to 30 September banks sold $5.2 billion of auto loans to non-bank lenders. That is a transfer of credit, not credit that has disappeared. The offset has not only survived the hike. It is accelerating.
Euro Area
M3 stands at €17.717 trillion in September, up 3.5% on the year and unchanged from August. Adjusted loans to non-financial corporations grow 4.2% and loans to households 3.1%, also unchanged.
Here we owe a correction. Last month we wrote that the corporate bond channel was closing, because firms’ net debt issuance in August was -€0.2 billion. The revised data do not confirm it.
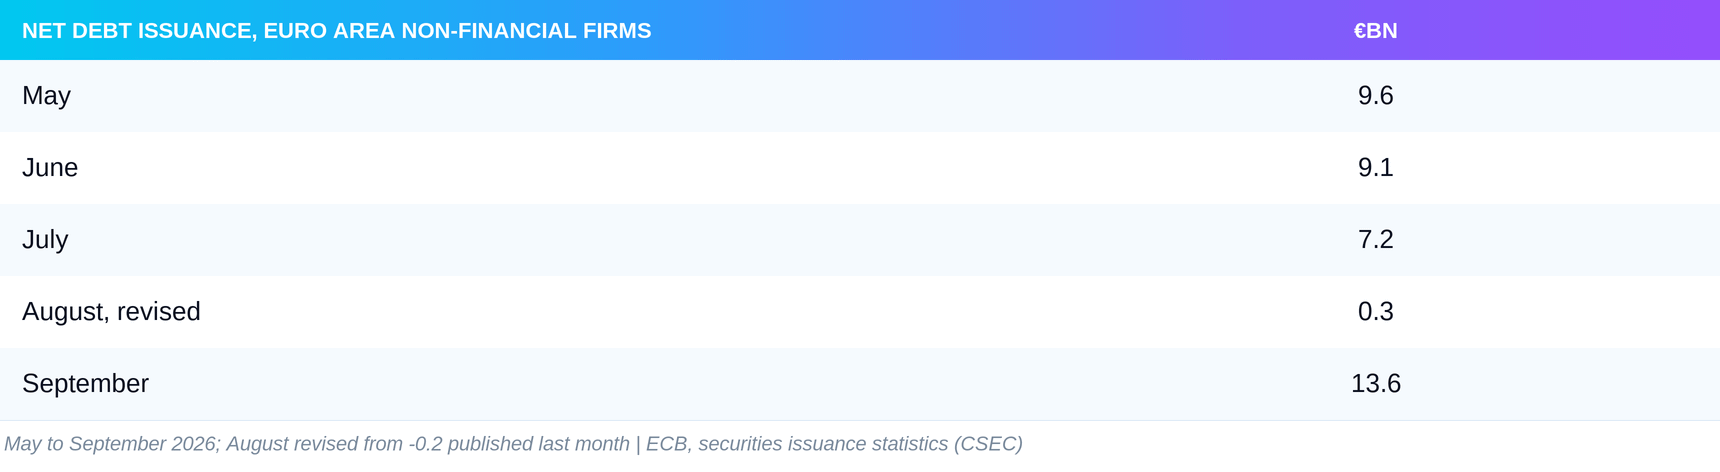
August has been revised to plus €0.3 billion, and September is the strongest of the five months. The bond channel narrowed over the summer, but it did not close.
The volumes are the good news. The surveys are the bad news. They show what banks and firms think about the coming months, and credit standards, the conditions banks set for lending, usually tighten before credit slows.
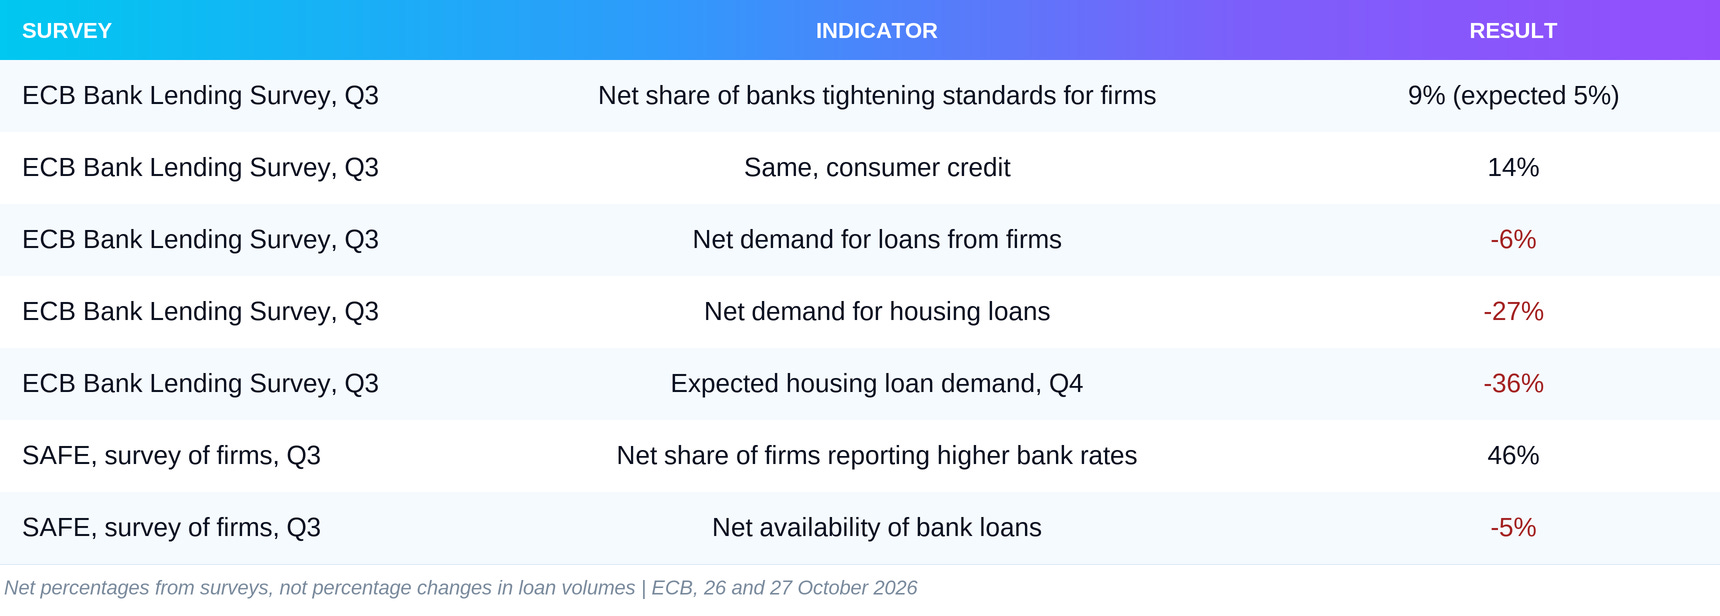
These are net shares from surveys, not percentage falls in the volume of credit. Banks tightened conditions for firms more than they themselves expected three months ago. Demand for housing loans is falling sharply and is expected to fall further. According to the bank lending survey, banks’ access to funding from household deposits is deteriorating at the sharpest pace since the series began in 2011. Volumes are still growing, but banks are already tightening the terms.
China
China’s M2 stands at CNY 359.63 trillion in September, up 0.79% on the month. The annual pace, however, keeps slowing, from 7.5% in August to 7.2%, and the data are preliminary. Total social financing, the broadest measure of credit to the real economy, adds CNY 3.548 trillion in September, almost the same as a year earlier (CNY 3.530 trillion).

The share of government bonds falls from 60.9% to 43.3%, and this time bank loans carry more than a third of the flow. Firms, however, are paying down bonds on a net basis. Yuan bank loans grow 4.8% year on year, against 4.9% in August. From the cumulative data, enterprises and organisations add about CNY 1.29 trillion in September, while households add practically nothing.
The PBoC’s quarterly report on where credit goes shows two different worlds beneath these figures. Corporate loans grow 8.0% year on year, and loans to small and medium-sized technology firms 20.1%. Household loans fall 2.0%, and property loans 5.2%. Fixed asset investment excluding rural households is 7.2% lower over the first nine months, and private investment 10.4% lower. The enterprises in these data are not only private firms, so we cannot say how much of the corporate credit reaches the private sector. Credit in China goes where the state directs it, not where households seek it. The central bank can add liquidity, but it cannot make households borrow. That is pushing on a string.
Japan
Japan’s M2 stands at ¥1,295.6 trillion in September, up 2.0% on the year, and M3 at ¥1,638.3 trillion, up 1.2%. Seasonally adjusted M2 rises 0.20% on the month. Broad money remains practically motionless. Bank lending by major, regional and shinkin banks reaches ¥682.0 trillion, up 5.3% on the year, with August’s pace revised from 5.4% to 5.3%. At major and regional banks alone the growth is 5.7%. The Bank of Japan’s survey of 50 large banks shows slightly stronger demand from firms, with the index at 3 against -1 in the previous survey. Standards barely change, but banks are widening their lending margins. The central bank is draining the water, and commercial banks are still putting it back: the monetary base is shrinking 15.2% year on year while bank credit grows 5.3%.
Money and Credit Synthesis
Net Fed Liquidity and Its Relationship to M2
Net Fed Liquidity is the Fed balance sheet minus the Treasury’s account at the Fed and minus overnight reverse repo. It shows how much of dollar liquidity is not locked in the government’s account or parked back at the central bank.
From this issue all three components are taken on the same Wednesday. Until now the Treasury account entered as a weekly average, while the balance sheet and reverse repo were single-day values, so we were mixing an average with a point. The method is already used in Credit Pulse from October. The change affects the comparison with the previous issue. We then published Net Fed Liquidity of $5.794 trillion for 30 September. Under the new method the same date is $5.747 trillion. The difference of $46.6 billion comes from the method, not from the economy.
Net Fed Liquidity
As of 28 October Net Fed Liquidity is $5.730 trillion, against $5.747 trillion on 30 September. The decline is $17.6 billion, or 0.31%.

The Fed balance sheet barely plays a part. The whole movement is between the Treasury account and reverse repo. Reverse repo on 30 September is an extreme case: at quarter end banks shrink their balance sheets for the reporting date, and money market funds park cash at the Fed for a day. Afterwards it is practically zero again.
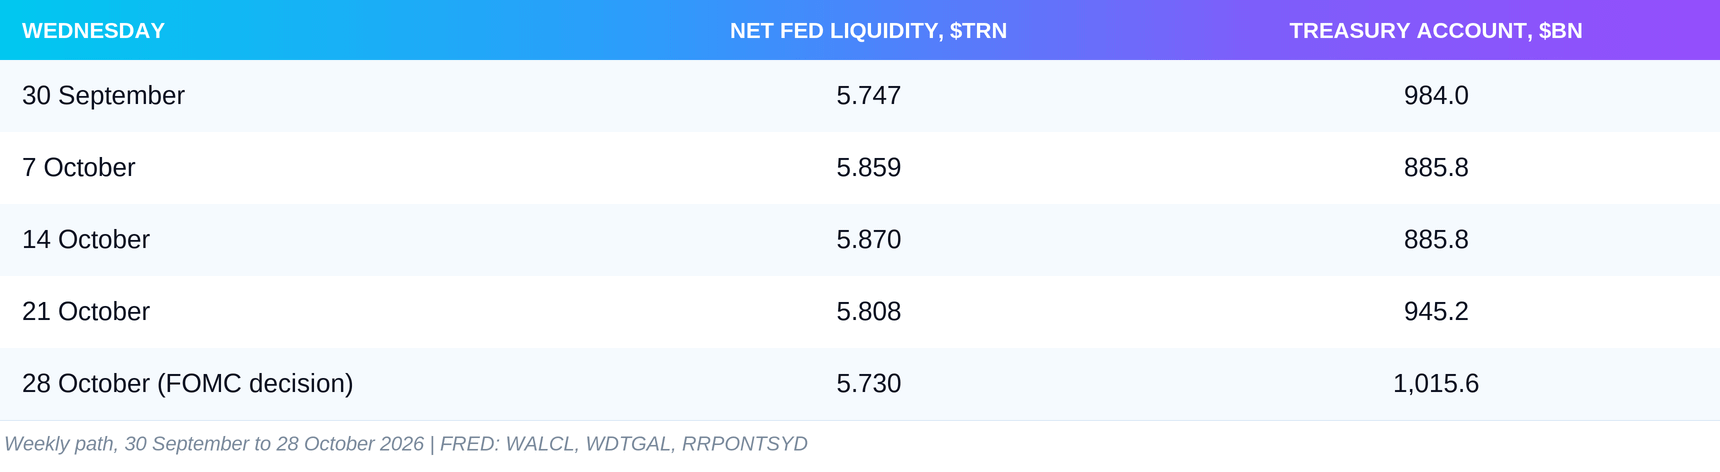
The month has two halves. Until 14 October the Treasury spends from its account and Net Fed Liquidity rises to $5.870 trillion, the highest since 22 July. The account then refills by $129.8 billion in two weeks and reaches $1,015.6 billion. That is the highest Wednesday level since the start of 2025, the beginning of our extracted data. Reverse repo has nothing left to give. Every refill of the Treasury account runs through bank reserves. When the buffer is empty, every dollar the government collects leaves the banks.
Net Fed Liquidity is not the accounting level of reserves. Other items on the Fed’s balance sheet move them too, and in October Wednesday reserves even rise slightly, from $2,881.7 billion to $2,895.2 billion. Two Fed notes from October explain why the total is not the whole story. The first, from 16 October, shows that total reserves and a single average rate can hide an uneven distribution across individual banks. The second, from 30 October, estimates that for every dollar of new longer-term Treasuries the balance sheets of large dealers grow by about 21 cents, of which 13 cents is repo financing. More issuance means more demand for overnight money. That explains why the price of overnight money is reacting even though the quantity barely changes, as the Credit Stress section shows.
M2 vs Net Fed Liquidity
The comparison covers the same one-year window, September 2025 to September 2026, using the last Wednesday of each month for Net Fed Liquidity.

The annual decomposition of Net Fed Liquidity: the Fed balance sheet adds $134.6 billion, the drain of reverse repo adds another $17.6 billion, and the higher Treasury account removes $226.1 billion. The three parts sum exactly to -$73.8 billion. Over one year the Treasury has drawn about 1.7 times as much out of the system as the Fed balance sheet has added. Last month the annual decline was -$201.7 billion. The two figures are not comparable, because the window then ended in August and the method was the old one, with the weekly average of the Treasury account. The direction, however, is the same. This is not a measure of privately created money. M2 is a monthly average, Net Fed Liquidity a weekly snapshot. The divergence says something narrower: broad money is growing, while the federal liquidity plumbing is smaller than a year ago.
