

Scope
All the main data for the second quarter of 2026 are now available, with two important qualifications: the GDP estimate is the first preliminary release, while the corporate statistics on profits and capital expenditure will not be published until 1 September. July data are considered separately. They show the direction in which Japan entered Q3, but they do not change the assessment of Q2.
Where the Economy Stands
Japan is in a slowing-growth phase with a weak private domestic foundation. Real GDP rose by 0.3% from the previous quarter, or 1.1% at an annualised rate. That is growth, but it is slower than the 0.5% recorded in Q1 and weaker in quality than the headline suggests.
The engine was a combination of manufacturing, government consumption and net exports. The manufacturing PMI, which shows how broadly orders, output, employment, delivery times and inventories are improving, remained above 54 throughout the quarter. The official industrial production index, released later, confirmed that actual output volume rose by 1.9% in June, while government consumption provided meaningful support to GDP. Net exports also helped, but mainly because imports fell in the national accounts, not because the physical volume of exports accelerated convincingly.
The brake was private domestic demand. Household consumption was virtually unchanged in the GDP accounts, real spending remained below year-earlier levels, and business investment contracted by 1.2% from Q1. Positive real wages have yet to turn into a stable spending cycle. This is primarily a cyclical brake, amplified by more persistent structural problems: an ageing population, cautious household behaviour and dependence on imported raw materials.
For the Bank of Japan, this is an uncomfortable picture. Underlying consumer inflation slowed in Q2, but producer prices and corporate pricing intentions accelerated sharply. The Bank raised its policy rate to 1.0% in June, yet credit continued to expand. The central case is therefore not rapid easing, but a cautious hold with a bias towards further tightening only if higher production costs pass persistently into wages and consumer prices.
Macro Verdict
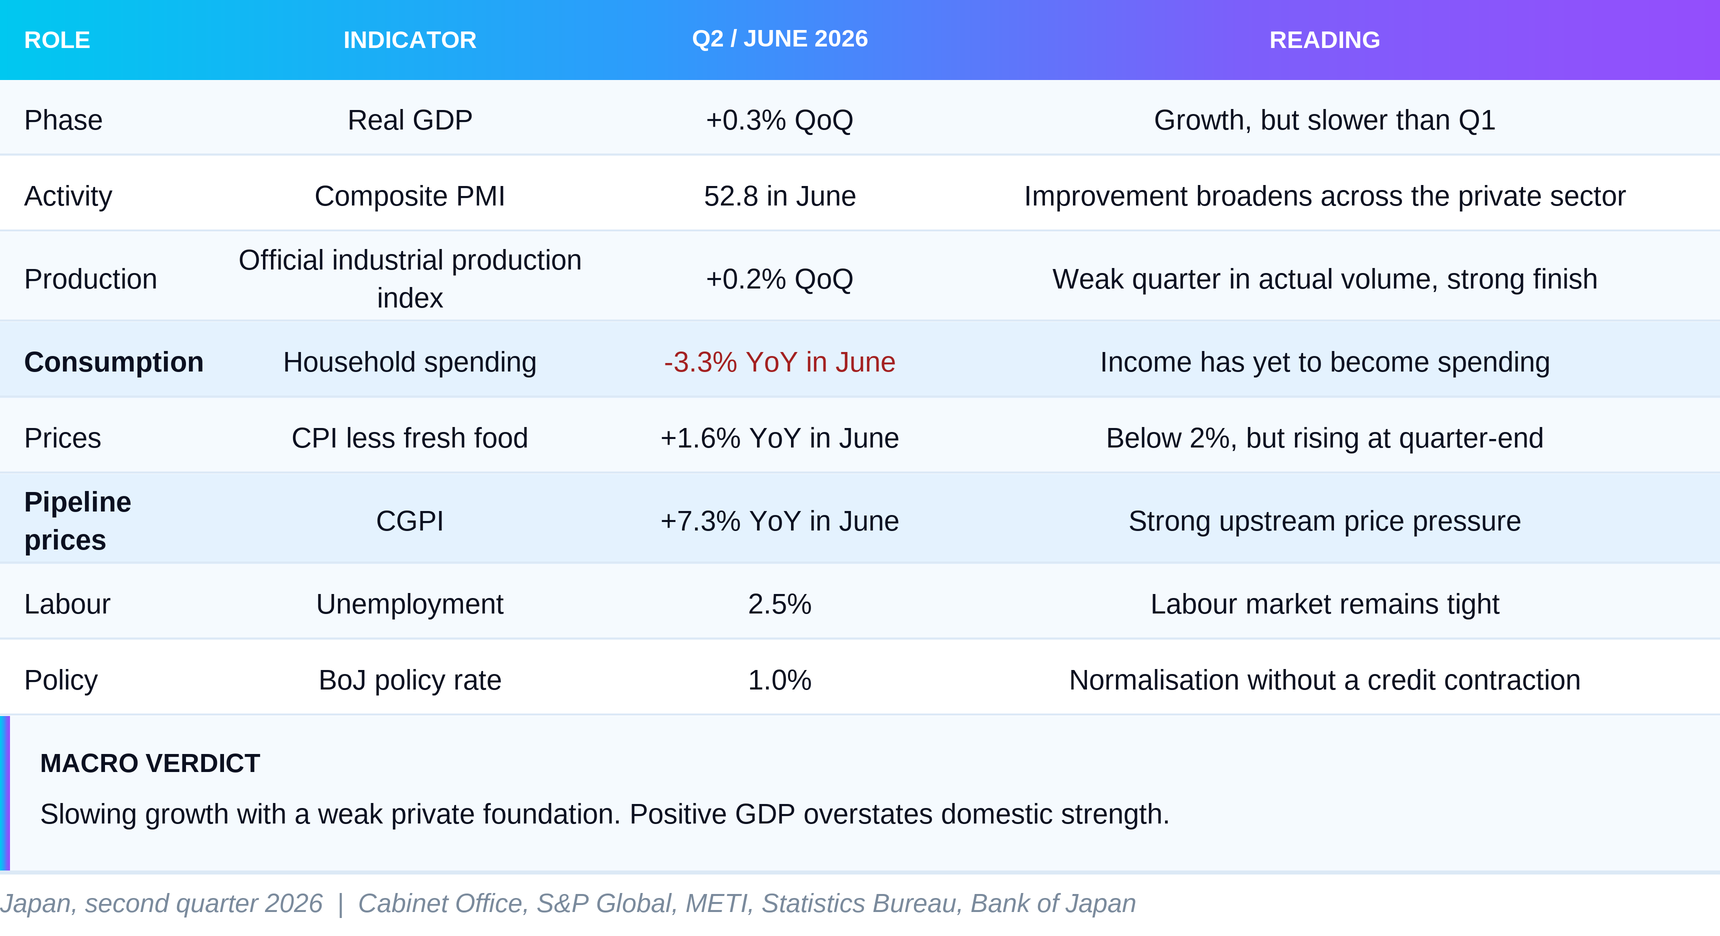
The table brings together Japan’s two contrasting faces. The corporate side shows expansion, labour shortages and strong producer prices. The household side shows weak spending, low confidence and almost unchanged consumption. Until those two halves begin moving in the same direction, the economy is not in a sustainable acceleration phase.
The Trajectory
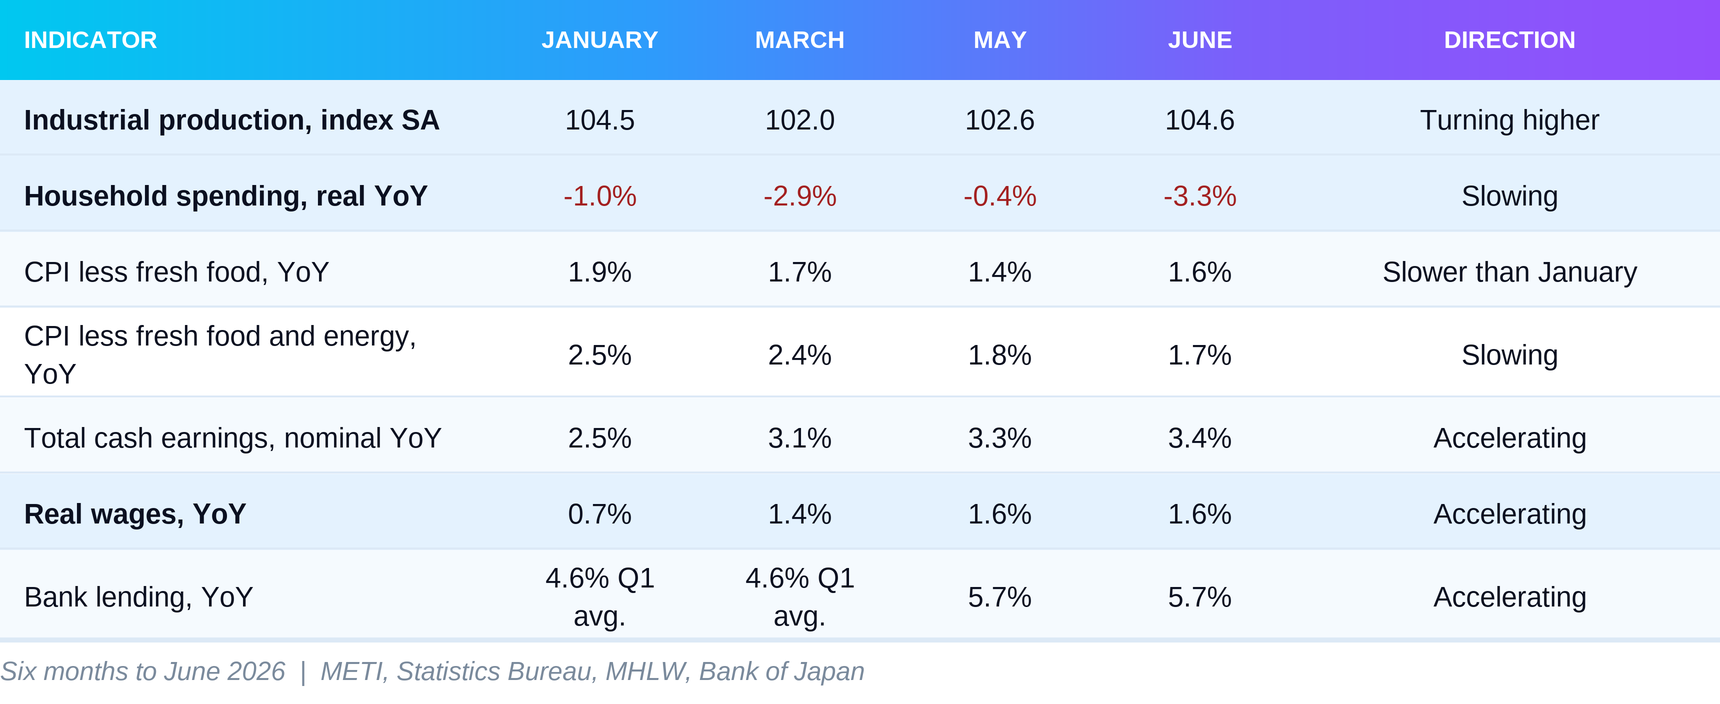
The three most important rows are industrial production, household spending and real wages. Officially measured industrial output turned higher after a weak middle section of the six-month window and reached its highest level of the period in June. This points in the same direction as the manufacturing PMI, but the two indicators are not the same. The PMI provides an early signal of how broadly conditions are improving across firms, while the METI index measures actual production volume. Their agreement shows that the PMI signal was confirmed by realised output. The problem lies in the composition: some orders and material accumulation were brought forward because of supply concerns and higher costs. The strong end to Q2 may be the genuine beginning of a new manufacturing cycle, but it may also be production borrowed from Q3.
The second row prevents us from calling the period an acceleration. Real household spending improved in April and May, but fell by 6.4% from the previous month and by 3.3% from a year earlier in June. This is not a statistical footnote. Private consumption is the largest part of the economy and was virtually unchanged in the GDP accounts. If income rises but spending does not follow, the multiplier from wages to sales, profits and investment remains weak.
The third row is why the assessment is not more pessimistic. Real wages were positive in every month of Q2, while nominal total cash earnings growth remained above 3%. Unemployment was 2.5%, and the ratio of job openings to applicants remained above one. Households therefore have a better income base than they did a year ago. What is still missing is evidence that they are willing to use it.
The price trajectory is also split. Japan’s standard core CPI, which excludes fresh food, declined from the beginning of the year. The narrower measure excluding fresh food and energy fell from 2.5% in January to 1.7% in June. At the same time, corporate input prices and the CGPI accelerated. Consumer inflation describes cooling in price pressure already realised, while producer prices warn about the next wave.
What Pulled Growth Up and What Dragged It Down
Real GDP rose by 0.3% from Q1, but the contributions show why that figure needs to be read carefully. Net exports added roughly half a percentage point. Exports made a small positive contribution, while most of the support came from lower imports. When imports fall, GDP improves mechanically because foreign production is subtracted from the national result. For living standards and domestic demand, however, weak imports can signal lower activity rather than stronger competitiveness.
Government consumption was the second clear source of support. It grew by 1.6% during the quarter and added about 0.3 percentage points. That helped keep the economy above zero, but it does not automatically create a self-sustaining private cycle. Public investment was almost unchanged, while the movement in public inventories absorbed much of the positive effect.
Private demand as a whole made no contribution. Consumption was almost unchanged, residential investment provided no support, and business investment contracted by 1.2%, subtracting about 0.2 percentage points from growth. This is the most important negative number in the release. The PMI and Tankan describe changes reported by companies in current conditions and plans, but realised capital expenditure moved in the opposite direction.
Inventories require a separate reading. Private inventories added about 0.3 percentage points to GDP, while industrial inventories rose by 2.8% in June alone. In a normal recovery, companies accumulate inventories because they expect sales. When raw materials are expensive and supply is uncertain, they may accumulate them defensively. The first mechanism signals future growth. The second pulls orders and production forward from the next period. Q2 data do not yet allow a clean distinction between the two, but weak household spending tilts the balance towards caution.
The Quarter Month by Month
April began strongly on the corporate side. The manufacturing PMI held at 55.1, showing a broad improvement in sector conditions, while the official industrial production index confirmed that actual output volume rose by 0.5% from March. Retail sales increased by 2.1%. Services remained in expansion, but at 51.0 the PMI did not show the same breadth of improvement. Real household spending rose during the month without moving above its year-earlier level. This was a month of visible movement, but not of broad domestic strength.
The divergence widened in May. The manufacturing PMI remained high at 54.5 and continued to point to broad improvement across factories, but officially measured industrial output almost stalled and was 2.1% below May 2025. The services PMI slipped to 50.0, the dividing line between expansion and contraction. Retail sales continued to rise, while core machinery orders fell by 12.4% during the month. The period looked better in the PMI and nominal sales than in actual production volume and investment execution.
June ended the quarter with the strongest industrial picture and the weakest consumer one. Actual industrial production volume rose by 1.9%, with the largest positive contribution coming from increased output in the production machinery sector. Services recovered to a PMI of 52.2. At the same time, retail sales fell by 3.9% from May and real household spending collapsed by 6.4%. The trade deficit widened, and the seasonally adjusted current-account surplus declined for a third consecutive month. Japan entered Q3 with confirmed manufacturing momentum but no confirmation from consumers.
July as a Direction for Q3, Not Part of Q2
July data are excluded from the quarterly averages and were not used to determine the phase. They are useful for only one question: whether June’s divergence began to close or carried into Q3. So far, the answer is mixed.
Private-sector PMI readings continued to signal growth, but not acceleration. The manufacturing PMI edged down from 54.8 to 54.5, the services PMI from 52.2 to 51.2, and the composite PMI was almost unchanged at 52.7. Improvement therefore still covers more firms than deterioration, but this does not prove a new jump in actual output. If June’s officially measured industrial increase marked the start of a stronger cycle, orders and realised production must remain high in August and September without firms reducing inventories through weaker output.
On the household side, there is one encouraging but soft signal. Consumer confidence rose from 33.8 to 34.9. This continues the recovery from April, but the level is not strong enough to override weak real spending. Confidence can change before purchases, which gives the increase some leading value. To become an economic engine, however, it must be followed by positive real spending and broader sales growth, not just higher nominal turnover.
Prices provide a stronger signal. National CPI accelerated to 1.9%, the standard core measure to 1.8%, and the index excluding fresh food and energy to 1.9%. Tokyo CPI also rose across all the main measures. July’s consumer prices are therefore beginning to reflect some of the pressure already visible at companies. Against that stands the almost stalled monthly movement in the CGPI, only 0.1%, despite a high annual increase of 7.2%. If the CGPI continues to lose monthly momentum, July’s CPI may prove to be limited catch-up rather than the beginning of a new wave.
The external and monetary signals are also moderate. The seasonally adjusted trade deficit narrowed from June but remained substantial. M2 maintained annual growth of 2.2%, M3 slowed to 1.4%, and the monetary base continued to contract. The picture does not show a sudden liquidity shortage, but it does show a gradual withdrawal of the broadest monetary support. July therefore does not change the phase. It raises the probability that the inflation risk remains alive while growth continues at a moderate rather than accelerating pace.
The Engine
The main engine in Q2 was corporate production, supported by government consumption and the accounting contribution of the external sector. This is not one clean source of growth, but a combination that keeps the economy above zero while households and realised investment lag.
The manufacturing PMI was 55.1 in April, 54.5 in May and 54.8 in June. The quarterly average was 54.8, convincingly above the 50 threshold, which means business conditions improved across a broad share of firms. The separate official METI index showed that actual industrial output also increased, although by only 0.2% from Q1. Behind June’s 1.9% increase in volume was greater output in production machinery, electrical and communications equipment, and food. The early PMI signal was therefore confirmed in realised production only at the end of the quarter.
Tankan confirms that companies did not experience Q2 as a recessionary environment. The business conditions index for large manufacturers rose from 17 in March to 22 in June. For large non-manufacturers, it increased from 36 to 37. Labour shortages remained pronounced, while financial conditions reported by companies did not deteriorate. Fixed-investment plans for FY2026, from April 2026 to March 2027, point to an increase of 6.8% for all companies and 11.5% for large firms.
This is the positive structural theme. Japanese companies have an incentive to invest in automation, software, production equipment and energy efficiency because labour is scarce. The negative employment conditions index in Tankan indicates a shortage, not a surplus, of workers. Capital expenditure is therefore not merely a cyclical choice but also a response to demographics. If investment intentions are realised, they can raise productivity and turn labour scarcity from a constraint into a driver of technological renewal.
Yet the size and durability of this engine have not been confirmed in the national accounts. Real business investment fell by 1.2% in Q2, while core machinery orders rose by only 0.2% during the quarter after large monthly swings. The gap between intention and execution is critical. Tankan says what companies plan for the full fiscal year. GDP says what they actually did from April to June. For now, the second carries more weight in classifying the phase.
The external sector adds another conditional source of support. Exports measured in yen grew at double-digit rates every month, but their physical volume rose by only 3.4% in April, 0.4% in May and 0.2% in June. Of June’s 19.3% increase in export value, almost all came from a higher unit value rather than more goods shipped. That is positive for exporters’ nominal revenue, but it is not the same as a broad real boom.
The current account shows why Japan’s external position cannot be reduced to trade in goods. The seasonally adjusted surplus was JPY 4.2 trillion in April, JPY 3.1 trillion in May and JPY 1.4 trillion in June. It remained large for Q2 as a whole but weakened each month. The main stabiliser is income from Japan’s accumulated foreign assets. Net income from those assets, mainly dividends and interest after corresponding payments to foreign investors, totalled almost JPY 8.9 trillion before seasonal adjustment during the quarter. This is a structural strength: Japan can receive income from abroad even when trade in goods and services is weaker.
But this buffer is not the same as a domestic production impulse. Income from foreign assets supports the national balance and corporate owners without necessarily creating immediate jobs, investment or consumption in Japan. The sharp June decline in net income from Japanese assets abroad, mainly dividends and interest, also reminds us that these monthly flows are volatile. The external balance reduces vulnerability, but it does not solve the private-demand problem.
Government consumption was the more reliable short-term stabiliser. It can smooth a weak period and support employment and income. The limitation is that public support cannot replace private demand indefinitely. The engine will become sustainable only when manufacturing orders turn into real capital expenditure and higher wages begin to support consumption. A combination of more expensive imported materials, weaker global demand and exhaustion of front-loaded orders would stop it.
The Brake
The main brake is the weak transmission from income to private demand. Japan’s labour market looks strong enough to support consumption. Unemployment was 2.5% in every month of Q2. There was more than one open position for every applicant. Nominal cash earnings rose by an average of about 3.4% from a year earlier, and real wages were positive. Even so, households did not increase their spending sustainably.
Real household spending was 0.5% below its year-earlier level in April, 0.4% lower in May and 3.3% lower in June. The Q2 average improved from Q1 but remained negative. Retail sales recorded a strong April and May, then contracted by 3.9% in one month in June. Consumer confidence recovered from 32.2 in April to 33.8 in June but remained low. The national accounts confirmed the final result: private consumption made no meaningful contribution to growth.
There are several possible explanations for this divergence. Households may be rebuilding savings after a prolonged loss of purchasing power. Income growth may be concentrated among large companies and regular employees, while smaller firms and non-standard employment lag. Consumers may also regard positive real wage growth as temporary because food, energy and imported goods remain sensitive to the currency and commodity prices. Under such uncertainty, additional income is not spent immediately.
In the short term, this brake is cyclical. Real wages are already improving, consumer inflation slowed during Q2, and confidence gradually increased. If all three trends persist, consumption has room to catch up. July confidence at 34.9 offers an initial positive signal, but it is not spending and does not enter the Q2 assessment.
Beneath the cyclical layer, however, lies a structural cause. An ageing population, a higher propensity for precautionary saving and a long history of weak nominal growth make Japanese households slower to change their behaviour. Workers can receive a higher wage without immediately assuming that it will continue to rise. That is why the sustainable wage-price cycle sought by the BoJ requires more than one good year of negotiated pay increases.
The second brake is business investment. The 1.2% fall from Q1 directly conflicts with the investment-renaissance narrative. It may be a temporary pause caused by uncertain energy prices, supply conditions and external demand. It may also indicate that planned capital expenditure is being delayed as margins narrow. Tankan expects sales across all enterprises to increase by 2.5% in FY2026 but current profits to fall by 6.5%. A company expecting higher revenue and lower profits has an incentive to automate, but also a reason to postpone the project.
There is an important limit to the available information. At the cutoff date, the Ministry of Finance corporate statistics for April-June had not yet been published. We therefore cannot honestly say whether profits actually fell, nor can we replace realised capital expenditure with Tankan plans. The first GDP estimate remains the best available measure of investment already executed, while Tankan provides a conditional forward view. The distinction is not a formality: the difference between realised and planned spending determines whether the weakness is a one-off pause or the beginning of a delay cycle.
Property and construction provided no offsetting impulse. Residential investment was virtually neutral and public investment edged lower. With a higher interest rate and rising construction costs, this channel is unlikely to lead the cycle. This is not a systemic property crisis, but rather the absence of an additional engine.
The brake will loosen if real incomes remain positive and household spending stays above zero for several consecutive months, while real capital expenditure begins to follow the Tankan plans. Until then, the private sector looks active in the PMI and Tankan, but not convincing enough in realised demand.
Prices
Consumer inflation slowed in Q2, but pressure further up the chain intensified. This is the second axis of the macro map and the reason the Bank of Japan cannot respond to weaker private growth with automatic easing.
Headline CPI was 1.4% in April, 1.5% in May and 1.6% in June. Japan’s standard core CPI, which excludes fresh food, was 1.4%, 1.4% and 1.6%. The narrower measure excluding fresh food and energy slowed from 1.9% in April to 1.7% in June. The decline is clearer relative to March: from 2.4% to 1.7%. At the level of consumer prices already realised, there was no broad renewed inflation acceleration in Q2.
Producer prices tell the opposite story. The CGPI rose by 5.4% from a year earlier in April, 6.6% in May and 7.3% in June. Import prices in yen increased even faster, showing the role of the currency and commodities. In Tankan, the input-price index for large enterprises jumped from 46 in March to 62 in June, while the output-price index rose from 28 to 40. Companies are not only paying more, but increasingly expect to raise their own prices.
The gap between the CGPI and core CPI was roughly six percentage points at the end of the quarter. That does not mean consumer inflation must accelerate by the same amount. Companies can absorb part of the cost through lower margins, change products or delay price increases. But a gap that large is rarely irrelevant. It creates a choice between higher final prices and lower profits.
That choice matters especially for smaller companies, which have less leverage when negotiating raw materials and financing. Large exporters can offset part of the cost through higher yen revenue. Domestically focused companies depend more heavily on households’ willingness to accept new prices. Weak consumption limits that willingness. The same producer shock can therefore sustain inflation risk while slowing real growth through pressure on margins.
July offers a warning but does not rewrite Q2. Headline CPI accelerated to 1.9%, the standard core measure to 1.8%, and the index excluding fresh food and energy to 1.9%. Tokyo CPI also increased. At the same time, the CGPI remained high at 7.2% year on year but rose by only 0.1% from June. The first Q3 signal is therefore a recovery in consumer inflation alongside a loss of monthly momentum in producer prices. More than one month is needed to determine which mechanism will dominate.
The Underappreciated Detail
The underappreciated detail is that the Bank of Japan is tightening while credit is accelerating. The monetary base contracted by an average of 12.4% from a year earlier in Q2, with the decline deepening to 13.7% in June. This shows that some extraordinary central-bank liquidity is being withdrawn. On 16 June, the BoJ raised its policy rate from 0.75% to 1.0%.
At the same time, M2 grew by an average of 2.3%, M3 by 1.6%, and lending by major, regional and shinkin banks increased by 5.6%. In June, credit was 5.7% above its year-earlier level, while lending by major banks accelerated further. This does not look like an economy in which the higher policy rate has already cut off financing.
The distinction between the monetary base and bank credit matters. The monetary base is liquidity created directly by the central bank. Credit is liquidity reaching companies and households through the banking system. The first is shrinking while the second is growing. Normalisation is under way, but financial conditions are not yet restrictive in a broad sense.
There is also a more cautious interpretation. Faster credit growth may reflect a need for working-capital financing as raw materials and imports become more expensive, rather than a new investment cycle. If lending grows while real capital expenditure falls, part of the credit may be financing costlier inventories and current expenses. Credit growth is therefore supportive, but it is not independent proof of acceleration.
What It Means
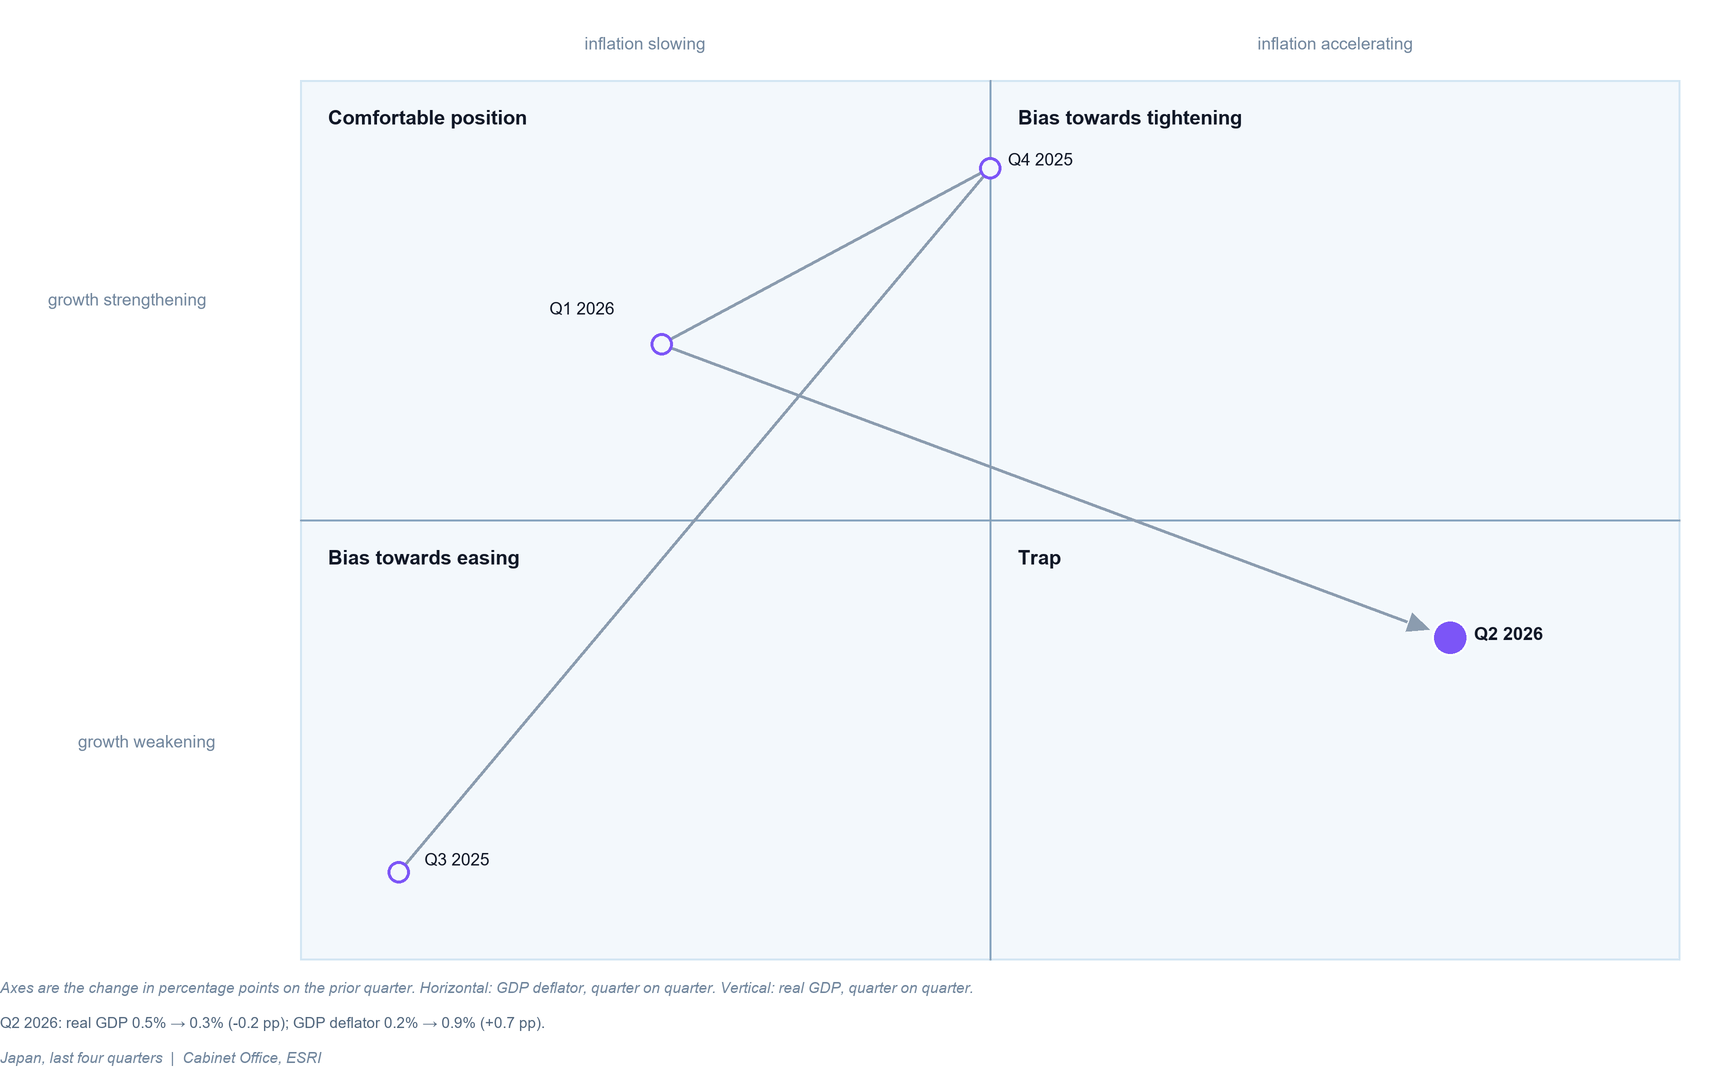
On the growth-inflation map, Japan is in the most uncomfortable quadrant: growth is weakening while future inflation pressure remains tilted upwards. Realised consumer inflation slowed in Q2, but producer prices, import prices and Tankan pricing indices warn that the relief may be temporary. This is not outright stagflation because GDP and the private sector are still growing. It is, however, an environment in which every central-bank decision carries a cost.
The Bank of Japan held its policy rate at 0.75% in April, although three members preferred 1.0%. In June, the Bank raised it to 1.0% by a 7-1 vote. The decision acknowledges two things at once: underlying inflation is moving towards the target over the medium term, while real interest rates remain negative and financial conditions remain supportive. Q2 credit growth confirms the second point.
What is already confirmed? Normalisation has not stopped the economy. The PMI remained in a zone of broad improvement, while the official index recorded a small increase in actual industrial volume for the quarter and a strong June. Unemployment did not rise, and bank lending accelerated. The data also confirm that private demand is insufficient: consumption made no meaningful advance, business investment fell, and imports weakened in the national accounts. Price pressure on companies is also confirmed.
What remains an assumption? We still do not know whether producer prices will pass through to consumers or be absorbed by corporate margins. We do not know whether Tankan investment plans were delayed from Q2 into the coming quarters or will be revised lower. Nor do we know whether positive real wages will change household behaviour. These three unknowns matter more for the BoJ’s next move than the headline GDP number alone.
The central case is for the Bank to hold at 1.0% in the near term and demand confirmation before another increase. Consumer inflation below 2% in June and the weak private foundation argue for patience. July’s CPI acceleration, high CGPI and negative real interest rates preserve a tightening bias. A rapid rate cut would be difficult to justify unless consumption and investment deteriorate more sharply or inflation pressure disappears.
For liquidity conditions, this means gradual rather than sudden change. The contraction in the monetary base is reducing excess system liquidity, but growing credit continues to finance the economy. Capital is more expensive, but access has not closed. Stronger companies can continue investing. Smaller firms face more expensive financing, more expensive raw materials and limited ability to raise prices at the same time.
For ordinary people, the environment is contradictory. Jobs remain available and wages are rising faster than measured inflation, but the feeling of purchasing-power recovery is returning only slowly. Households do not buy the average CPI basket. They experience specific prices for food, energy, transport and imported goods. If companies pass on the new producer pressure, positive real income could be eroded again. If they do not, the pressure will appear in profits, investment and hiring.
The market conclusion is not a direction for a specific position, but a regime. Japan is moving away from the world of endlessly cheap yen and permanent central-bank support, but it has not yet reached a restrictive monetary environment. That makes wages, margins and domestic-demand data more important than any single rate decision.
The Argument Against Our Reading
The strongest argument against the slowing-growth classification is that almost every leading corporate indicator looks like a normal expansion. The manufacturing PMI averaged 54.8 and the composite PMI remained above 50 every month, showing broad improvement among firms. Separately, the official industrial production index ended the quarter with a 1.9% increase in actual output volume in June, while Tankan improved in both manufacturing and services. Real wages are positive, unemployment is 2.5%, credit is growing by almost 6%, and companies plan a substantial increase in capital expenditure. From this perspective, Q2 is not slowing growth but the early phase of a broader acceleration that the national accounts have not yet captured.
The alternative mechanism is a time lag. Wages change first, households then become convinced that the increase is durable, and only then raise spending. Companies first announce investment budgets, then place orders, and finally the equipment enters GDP. Under this reading, the Q2 investment decline is a pause between decision and execution, while weak June household spending is noise after stronger April and May readings. Inventory accumulation is not defensive but preparation for stronger demand. Falling imports do not indicate weakness, but a temporary normalisation after earlier purchases.
This argument is serious because leading indicators should, by definition, lead realised spending. If we reject it simply because GDP is backward-looking, we risk recognising acceleration too late. The reason not to adopt the opposing thesis as the central case is that such a lag should soon leave visible evidence. Real household spending must turn positive year on year, business investment must return to growth, and inventories must be followed by final sales rather than production cuts.
We will be wrong if private consumption and business investment make positive contributions to Q3 GDP while the composite PMI remains above 52 and industrial production retains June’s increase. Under that combination, the phase should be changed to acceleration. Until then, the slower GDP rate and the zero contribution from private demand deserve more weight than the signal from leading indicators.
Risks in Both Directions
The upside risk is a faster closing of the gap between income and spending. Real wages are already positive, confidence is improving, and the labour market is tight. If households come to regard wage growth as durable, consumption could accelerate just as companies begin to execute their investment plans. Manufacturing inventories would then prove to be preparation for demand rather than borrowed growth. Stronger external demand for machinery and technology equipment would reinforce this scenario.
The downside risk is that price pressure hits households and margins at the same time. Another increase in energy prices or a weaker yen could accelerate import prices. If firms pass on the cost, real wages and consumption will deteriorate again. If they do not, profits and capital expenditure will come under pressure. Weaker global demand would reveal whether the strong PMI had been supported by advance orders. A further rate increase before domestic demand strengthens would intensify this double pressure.
The risk for the BoJ is asymmetric. Easing too early could amplify currency and import-price pressure. Tightening too quickly could interrupt the exact transmission from wages to consumption that the Bank wants to see. One weak or strong month is therefore not enough to change the regime.
What to Watch
On 24 August, final June wage data will show whether the preliminary 1.6% increase in real earnings is maintained. On 28 August, Tokyo CPI for August will provide the first price signal after July’s acceleration. On 31 August, preliminary industrial production and retail sales data for July should show whether June’s divergence between factories and households continued. On 1 September, the Ministry of Finance corporate survey will provide the missing Q2 profit and realised capital expenditure figures. On 8 September, the second Q2 GDP estimate may change the composition of growth. On 17-18 September, the BoJ will decide on the policy rate.
The threshold for a shift to acceleration is a positive contribution from both private consumption and business investment in Q3, with the composite PMI above 52. The threshold for a move down to stagnation is a composite PMI below 50 for two consecutive months, combined with renewed declines in industrial production and real spending.
Closing
Japan is growing, but Q2 does not prove that growth can carry itself. Manufacturing, government consumption and net exports support the positive result, while households and real business investment lag. The next quarter must show whether wages and corporate plans finally turn into spending, or whether the strength in Q2 was partly borrowed through inventories and weak imports. Until then, slowing growth with a weak private domestic foundation remains the most accurate classification.
Sources
Cabinet Office, ESRI, Quarterly Estimates of GDP, Q2 2026 first preliminary
Statistics Bureau of Japan, Consumer Price Index
Statistics Bureau of Japan, Family Income and Expenditure Survey
Statistics Bureau of Japan, Labour Force Survey
Ministry of Health, Labour and Welfare, Monthly Labour Survey, June 2026 preliminary
Ministry of Economy, Trade and Industry, Indices of Industrial Production
Ministry of Economy, Trade and Industry, Current Survey of Commerce
Bank of Japan, Tankan, June 2026
Bank of Japan, CGPI releases: June 2026 and July 2026
Bank of Japan monetary policy decisions: April 2026 and June 2026
Bank of Japan, June 2026: Monetary Base, Money Stock and Loans and Discounts Outstanding
Ministry of Finance, Trade Statistics
Ministry of Finance, Balance of Payments
Cabinet Office: Machinery Orders and Consumer Confidence
S&P Global, au Jibun Bank Japan PMI official release archive
Data cutoff: 21 August 2026. July observations are used only as a directional signal for Q3 and are excluded from Q2 averages and phase classification.
Not financial advice.