

Frame
This is the first monthly Macro Pulse for China after our second-quarter review. All the main July releases are now out. The last to arrive were industrial profits, on 28 August. In this issue we separate the shop window from the warehouse. The shop window is exports: record sums that look like a boom. The warehouse is what people in China buy, build and borrow at home.
Where the economy stands
The phase in July remains growth with slowing momentum. July is the weakest month of the year in the business surveys. The official composite PMI from the National Bureau of Statistics (NBS) fell to 49.3. The PMI is a survey of purchasing managers in which a reading below 50 means more firms report deterioration than improvement. The hard data, however, did not collapse. Industrial production grew 4.5% from a year earlier, and dollar exports grew 23.9%. This is a dip within the phase, not a change of phase.
The engine is exports linked to artificial intelligence: chips, servers and computers, plus cars. It is narrower than it looks. Customs price indices show that July exports grew more through price than through volume.
The brake is domestic demand. Bank loans in yuan fell by CNY 340bn in a single month, and household loans by CNY 460bn. Retail sales grew 0.6%. The brake is structural, because it rests on the property sector and household balance sheets. In July, floods and heatwaves added a cyclical layer on top.
The central bank, the PBoC, is on hold on its rate and eases only in targeted ways. Real conditions are tightening on their own, though. Inflation is falling while the rate stays put, so the real cost of money is rising. August and September send a better signal than July, but the hard data for the third quarter still have to confirm it.
Core indicators
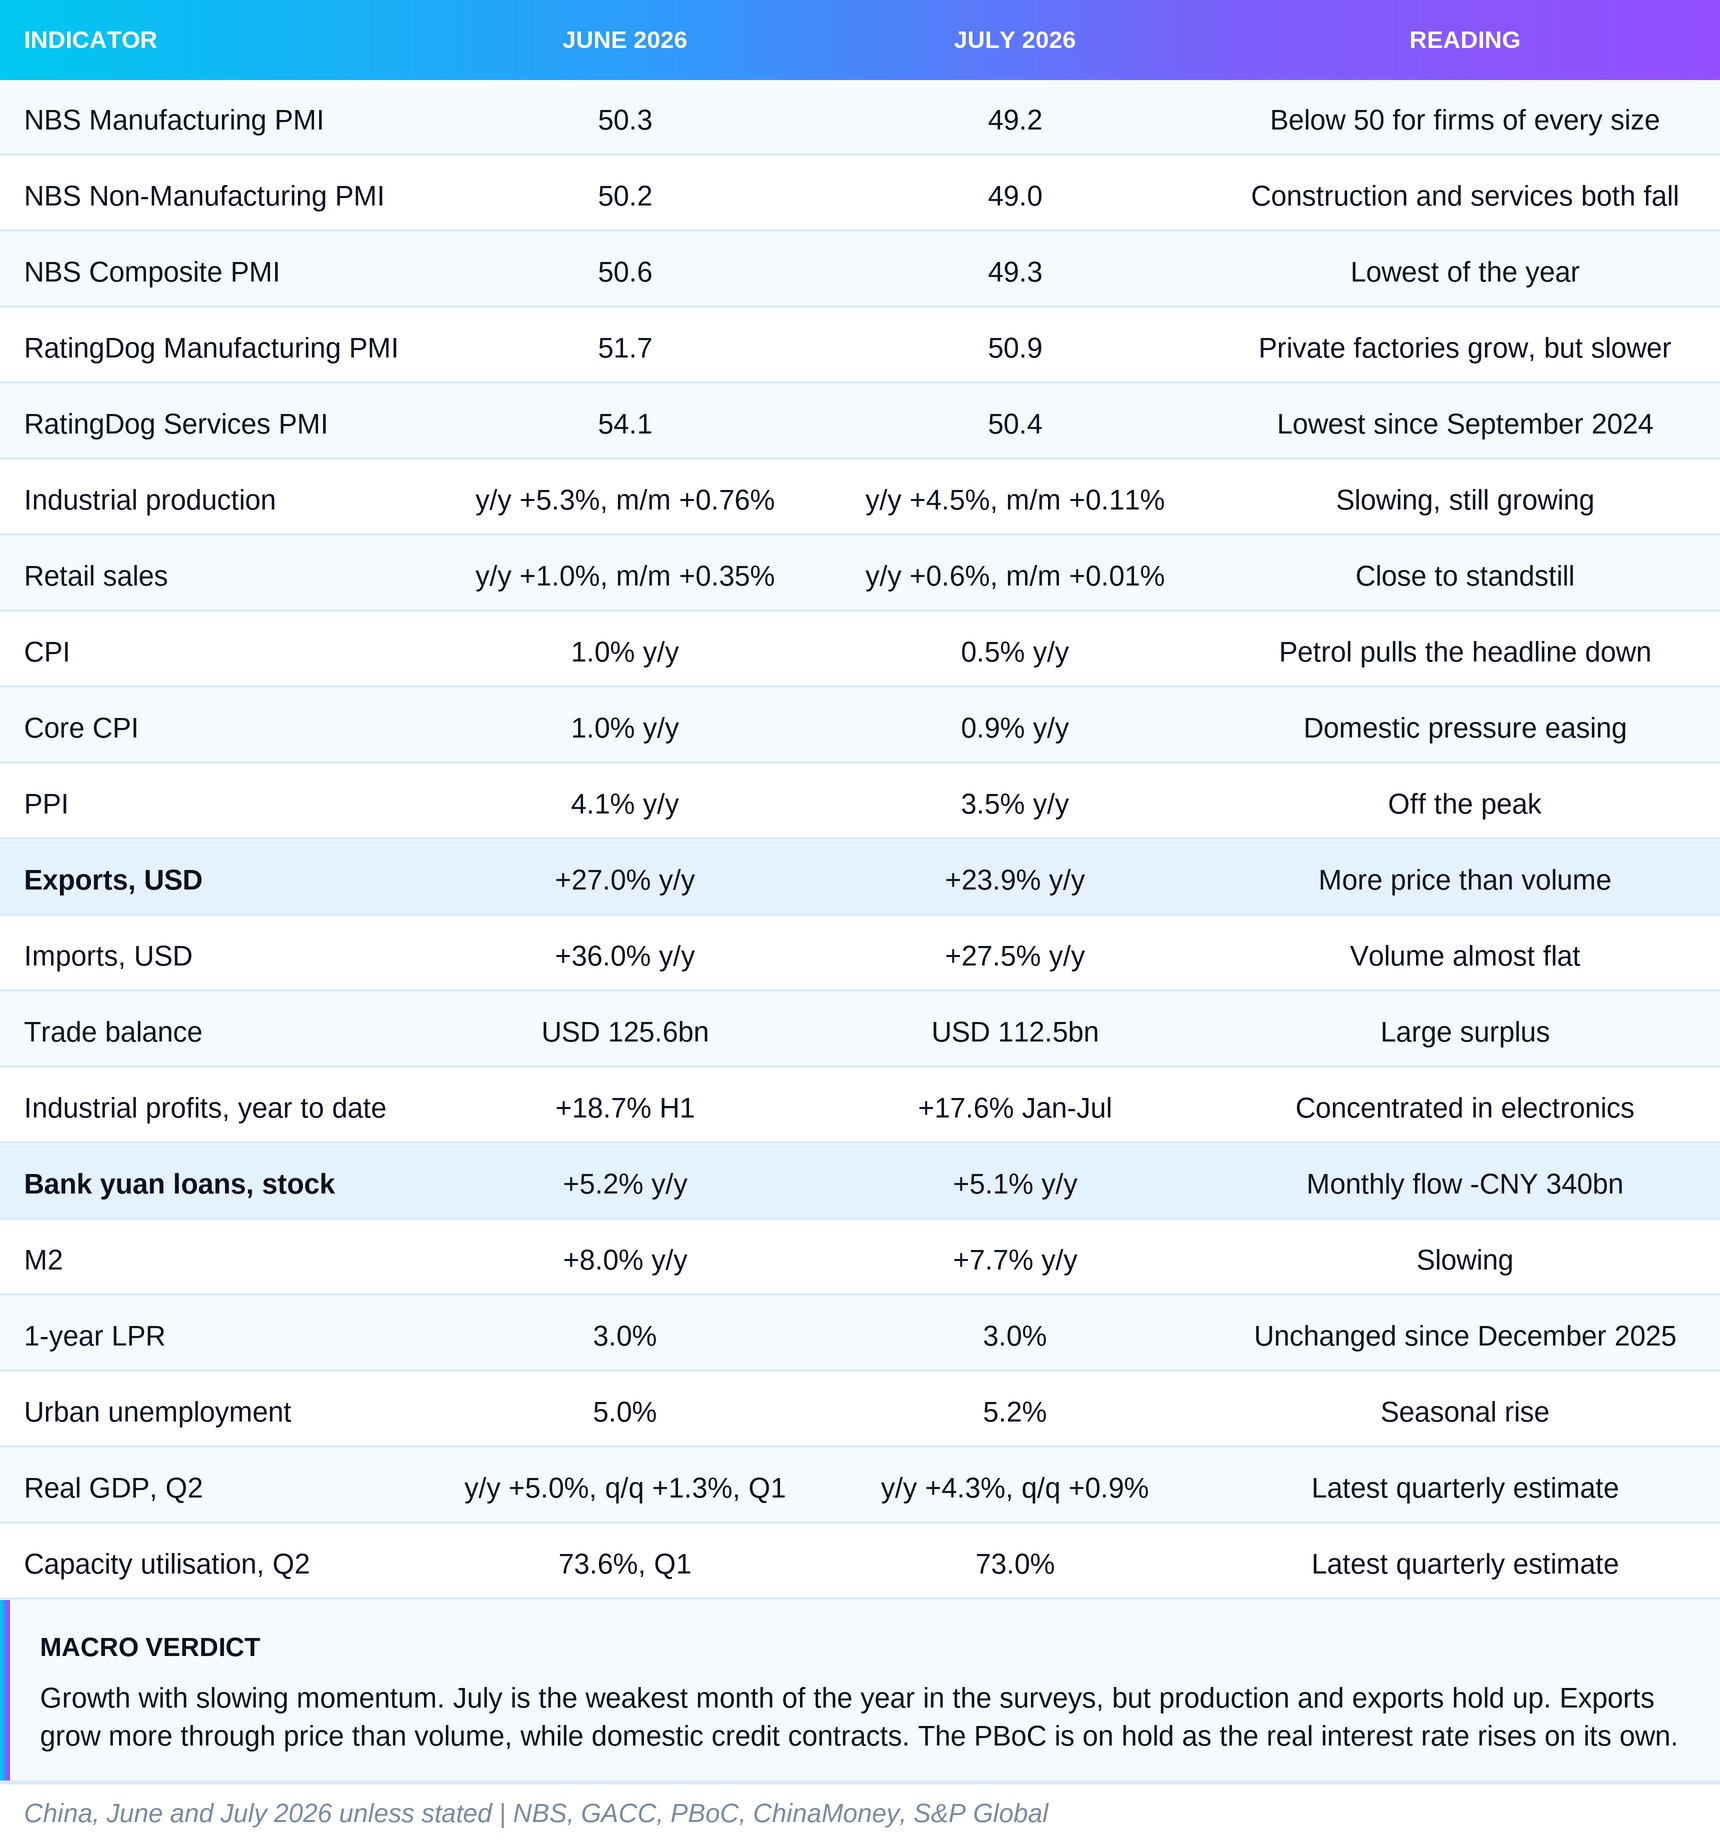
All July values are final. The monthly growth rate of retail sales was revised from 0.06% to 0.01% in the August release. NBS and RatingDog are two different surveys. NBS covers more large and state-owned enterprises, RatingDog more private and export-oriented firms, so the two are not compared directly.
The trajectory
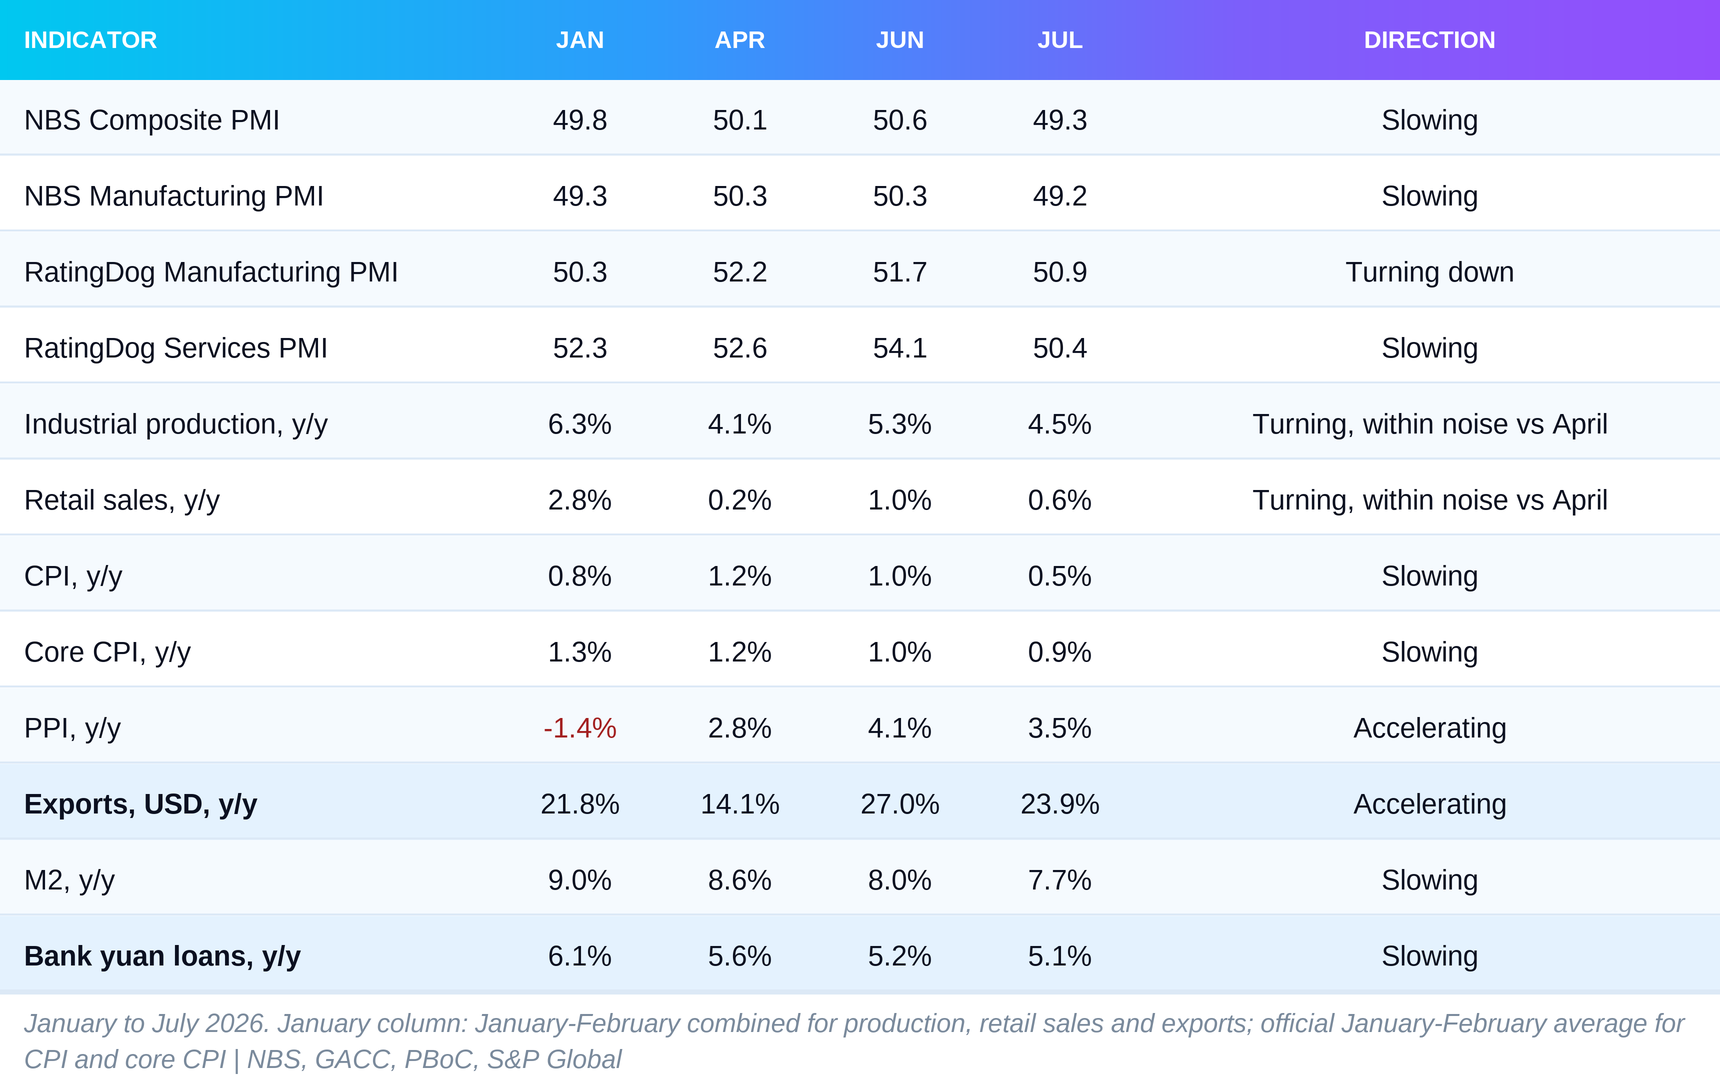
For production, retail sales and exports, the January column is the combined January and February figure, which is how Chinese agencies publish them. For CPI and core CPI it is the official average of the two months. Chinese New Year fell on 17 February in 2026 and on 29 January a year earlier. That makes January on its own look artificially low and February artificially high.
Three lines carry the story. The first is credit. M2, the broad money in the system, and bank loans have slowed every month since the start of the year. This is not a July shock. It is a slope that has lasted six months.
The second line is prices. PPI, the index of prices at which factories sell their output, is the only indicator that is clearly accelerating. Consumer prices are slowing. The gap between them is not new, but July holds it at 3 percentage points.
The third line is exports. They are growing faster than in April and faster than at the start of the year. This is the strongest number in the table and so it needs the most careful reading. We return to it in the section on the overlooked detail.
Two lines show a turn and deserve a note. Production and retail sales are above their April levels but below the start of the year. The gap with April is under half a percentage point, however, which is within normal monthly noise. The more honest reading is that both fell to a lower level in spring and have stayed there since.
RatingDog manufacturing also turns, but downwards. It is above January and below April. Private factories have lost most of their spring acceleration.
RatingDog services fell harder than any other line: from 54.1 in June to 50.4 in July. This survey covers more private firms in trade, transport and consumer services. That is where July’s floods and weak spending hit first. The official survey shows the same from another angle: new orders in services fell to 45.2 and services selling prices to 47.9. Service firms are not just selling less. They are selling cheaper to keep their customers.
August and September serve as a check on direction. The official composite PMI rose to 49.5 in August and to 50.7 in September. Industrial production accelerated to 5.2% in August and exports to 25.0%. Retail sales, however, slowed to 0.4% and M2 to 7.5%. The surveys and the factories are recovering. Credit and consumption are not following.
The engine: chips and cars
China’s engine in July has two names: electronics for artificial intelligence, and cars.
Industry shows the first. Output of computers and electronic equipment grew 19.1% from a year earlier. High-tech manufacturing grew 16.9%, faster than in June. Integrated circuit output was 20.7% higher than a year earlier, and industrial robots 30.2%. According to the NBS, new growth drivers accounted for 50.9% of industrial growth in the first seven months.
Customs data show how big the engine is. From January to July, exports were USD 393.8bn higher than a year earlier. USD 107.7bn of that came from integrated circuits and USD 51.8bn from computers and their parts. Together the two groups account for 41% of all additional exports. High-tech products as a whole grew 40.7%. Capital is moving the same way. Foreign direct investment into China fell 6.2% from January to July, but investment in high-tech industries rose 32.7% and now makes up 41.6% of the total. Domestic investment in equipment grew 9.0%, while total investment fell.
The second engine is cars. Car exports from January to July reached USD 110.8bn, up 54.9%. Here the growth is genuine volume: the number of cars exported is 53.7% higher. In July, the customs index shows the volume of cars and parts exported up 40%, at a slightly lower price. Output of new energy vehicles grew 29.9%. Total car output is flat, and domestic car sales fell 17%. China is making the cars it cannot sell at home and selling them abroad.
Is the engine sustainable? Partly. Profits show it is real. Profits of electronics makers more than doubled from January to July, up 110%. Total industrial profits grew 17.6%. But the monthly pace is fading. Profits grew 11.2% in July alone and 4.2% in August. Inventories of finished goods were 10.8% higher at the end of July. Factories are producing slightly faster than they sell.
Geography shows the limits. Exports to the United States grew only 2.6% from January to July and are now just 10.2% of the total. Exports to Southeast Asia grew 25.1%, to Hong Kong 48.2% and to South Korea 33.3%. China is not exporting more to its biggest customer. It is exporting more to its neighbours, who are part of the same chip and server supply chain.
What could stop the engine? Three things. The first is a fall in chip prices. If the global cycle of data-centre investment slows, prices fall and the value of exports drops quickly, even without fewer units shipped. The second is measures against Chinese cars. Export growth of more than 50% provokes a response in the markets the cars are entering. The third is the yuan. Between December 2025 and September 2026 the yuan gained about 5% against the dollar, which makes Chinese goods dearer for foreign buyers.
The brake: households are not borrowing, firms are not building
The brake sits in credit and in property. July is the month in which bank loans in yuan fell by CNY 340bn. In April they stood still. In July they clearly fell.
Households repaid CNY 460bn more than they borrowed. Their short-term loans, which often finance purchases, fell by CNY 340bn. Their long-term loans, which include mortgages, fell by CNY 120bn. Companies also cut their debt by CNY 130bn, and long-term corporate loans fell by CNY 230bn. The only growing channel was bill financing, in which a bank pays a company early for a receivable from a trade deal. It added CNY 376bn. That is money for day-to-day payments, not for new plants.
Total social financing, the broadest measure of credit to the economy, added CNY 1.41 trillion. CNY 1.32 trillion of that was government bonds. Without the state, the private flow was close to zero. Our September liquidity issue described this as a broken bypass. The state can still create financing. Private credit is not following it.
Property shows why. Investment in real estate from January to July was 19.2% lower, new construction starts 24.0% lower and floor space sold 11.8% lower. New home prices fell from a year earlier in every tier of cities: by 1.1% in the four largest, 2.8% in the second tier and 4.2% in the third. Prices of existing homes fell further, by 3.7% to 5.8%. Only 8 of 70 cities reported existing home prices rising or holding steady on the month. When the price of a home is falling, a household does not take out a mortgage, even at a low interest rate.
Consumption follows property. Retail sales grew 0.6%, and 2.5% excluding cars. Household appliances fell 1.9%, furniture 8.8% and building materials 14.2%. These are purchases that go together with a new home. The only strong item was telecom equipment, up 20.4%, supported by state subsidies for replacing old devices with new ones. Services are holding up better than goods. The index of services output grew 4.3% in July, and sales of services 5.0% from January to July, against 1.1% for goods. Restaurants, though, grew only 1.4%. Chinese consumers are spending on phones and travel, but saving on everything to do with the home.
The labour market is getting heavier. Urban unemployment is 5.2%, 0.2 points above June. Youth unemployment for 16 to 24 year olds, excluding students, jumped from 14.9% in June to 17.9% in July. Part of the jump is seasonal, as graduates enter the market. In August, however, it reached 18.9%, the highest in a year.
Business investment is not helping either. Total fixed asset investment was 6.7% lower and private investment 9.4% lower. The exception is equipment, up 9.0%, supported by state renewal programmes.
Is the brake structural? Mostly yes. The property downturn has lasted since 2021, and households are holding on to their savings. July adds a cyclical layer too. The NBS points to extreme heat, torrential rain and floods that temporarily halted work on building sites. That part recovers quickly: construction activity in the PMI survey fell to 47.0 in July, but was back at 50.3 by September. New construction orders tell a different story. They fell to 40.1 in July and were only 45.7 in September, far below 50. Work on site comes back when the rain stops. New contracts do not, because they depend not on the weather but on demand for housing. This is the structural part, and it needs a change in expectations for home prices, which is not yet visible.
Prices: petrol pulls down, chips push up
Consumer inflation fell to 0.5% from a year earlier, from 1.0% in June. The main reason is petrol. According to the NBS, petrol prices fell 10.7% in a single month and pulled the headline index down by about 0.35 points. On the year, petrol was only 1% dearer, after 17% in June. Food was 1.5% cheaper and pork 13.3% cheaper.
Core CPI, excluding food and energy, is 0.9%. It is the better measure of domestic demand, and it is falling too: from an average of 1.3% in January and February to 0.9% in July. One item stands out. Gold jewellery is 24.6% dearer than a year ago. That is not demand pressure but a reflection of the gold price.
PPI is 3.5%, after 4.1% in June. Prices in mining rose 16.4% and for raw materials 6.1%, while factories sold consumer goods 0.8% cheaper. The gap between PPI and CPI is 3.0 points. It shows where the pressure sits. Factories pay more for energy, metals and chemicals, but cannot pass it on to buyers at home. Margins of producers selling into the domestic market are shrinking. Profits confirm it: carmakers earned 20.4% less, and makers of cement and glass 48.2% less.
The PMI survey shows the same squeeze inside factories. In July, the index of prices factories pay for inputs was 53.2, meaning more firms paid more. The index of the prices at which they sell was 47.8, meaning more firms cut their prices. Factories were buying dearer and selling cheaper. In September both indices jumped, to 60.8 and 54.0. For the first time since spring, factories are starting to pass some of the cost on.
The check after July matters. In August CPI returned to 0.8%, core to 1.0% and PPI to 3.8%. In September input prices in the PMI survey jumped to 60.8, close to the March peak of 63.9. In our September Commodity Snapshot, Brent crude was back above USD 100, because of the war with Iran and restricted flows through the Strait of Hormuz. July’s cheaper petrol was a pause, not a turn.
The conclusion on prices is twofold. Domestic inflation is weak and does not constrain the PBoC. Imported inflation is strong and squeezes factories from within.
The overlooked detail: chips are getting dearer, not selling more
China’s exports look like a boom. In July they grew 23.9% in dollars. Over seven months the surplus reached USD 687.4bn. Headlines speak of trade strength. The customs price indices tell another story.
China’s customs agency publishes separately how much the price and how much the volume of exported goods has changed. In July the value of exports in yuan was 17.8% above last year. The price was 11.6% higher and the volume only 5.5% higher. Two thirds of the growth is price.
In electrical equipment, where chips sit, the price was 28.2% higher and the volume 3.7% higher. In machinery, where servers and computers sit, the price was 26.8% higher and the volume 0.8% lower. China is exporting almost the same volume of machines but selling them for more.
It is clearest in the chips themselves. From January to July the value of exported integrated circuits was USD 216.0bn, almost double a year earlier. The number of chips exported was only 6.2% higher. The average price of an exported chip was 88% higher. China is not exporting many more chips. It is exporting dearer ones.
Imports show the same. In July their value in yuan was 21.2% higher, but their volume only 0.4% higher. Machinery imports were 74.7% dearer and 11.3% smaller in volume. China is buying the same chips it later exports inside finished products, and paying much more for them. Chip imports from January to July reached USD 361.8bn, up 58.3%.
Why is this overlooked? Because the value of trade looks like demand. It is closer to price. Factories assembling servers are getting orders, but part of each order is a dearer component rather than more work. Import volume, the best measure of domestic need for raw materials and components, is almost flat.
This has two consequences. The first is for the engine. If chip prices fall, the value of exports will fall quickly without Chinese factories losing a single customer. The second is for the brake. Strong trade numbers do not bring strength to households. They bring profit to a narrow circle of electronics companies.
What this means
The July data give the PBoC grounds for easing, not tightening. Growth is slowing in the surveys, credit is contracting and core inflation has fallen below 1%. The last confirmed quarterly position was Q2: growth weakening and consumer inflation easing, with higher factory prices. July does not contradict it.
The PBoC, however, is on hold on its rate. The one-year Loan Prime Rate (LPR), the benchmark lending rate in China, has stood at 3.0% since December 2025. The five-year rate, the benchmark for mortgages, stands at 3.5%. Real conditions are tightening on their own. The real interest rate, meaning the LPR minus inflation, rose from 1.8 points in April to 2.5 points in July. Without the PBoC moving anything, money is becoming dearer in real terms.
Quantities give a mixed picture. In July the PBoC injected a net CNY 688bn through its operations. Bank reserves at the central bank, however, fell by CNY 104bn. The reason is that the state raised money through bonds and parked it in its account at the PBoC faster than it spent it. Government deposits rose by CNY 736bn. In August the PBoC itself withdrew a net CNY 409bn. The interbank rate did not rise and stayed around 1.4%. Banks have money. They have no one to lend it to.
On 29 September the PBoC responded, but in a targeted way. It cut the rate on PSL, its targeted loans to the state development banks, by 0.25 points to 1.50%. It raised the credit lines for technology by CNY 200bn and for agriculture and small business by CNY 500bn. From 1 October, the finance ministry, the PBoC and the banking regulator are introducing a subsidy of 1 percentage point a year on the interest on new mortgages for first homes. This is more about steering credit than about making money cheaper across the board.
In the terms of our framework, this is a hold, with passive tightening in real terms. The PBoC’s monetary policy committee, meeting on 19 September, spoke of “moderately loose” policy and “stronger counter-cyclical adjustment”. For now, the words are ahead of the actions.
What does this mean for liquidity? Liquidity in China is not missing from the banks. It is not reaching households and private firms. New money comes from government bonds rather than bank loans. That is a weaker engine, because the state spends slowly. Budget spending from January to July grew only 1.3%, and local governments’ revenue from land sales fell 30.8%.
For global markets China remains a two-sided factor. Strong exports of chips and cars are positive for supply chains in Asia. Shrinking import volumes of raw materials are negative for exporters of copper, oil and iron ore. Crude oil imports from January to July were 13.2% lower by volume.
For the ordinary person in China the picture is quiet. Shop prices barely move. Their home is losing value. Pay is rising, but work is harder to find, especially for the young. Credit is cheap, but they do not want it.
What is confirmed? That domestic credit is contracting, that core inflation is falling and that exports are growing more through price than volume. What remains an assumption? Whether the mortgage subsidy will turn housing credit around. Whether chip prices will stay high. Whether September’s recovery in the surveys will show up in the hard data.
Risks in both directions
The strongest argument against our phase is that we are underestimating the recovery. The September surveys look much better than July’s. The official composite PMI is 50.7 and new factory orders are 50.5. In our Q2 review we set exactly this as the threshold for a change: a composite PMI above 50 with new orders above 50. The September surveys meet it. RatingDog manufacturing is 52.1, the highest in five months, and construction is back above 50. If the hard data for September confirm the surveys, July will turn out to have been a temporary dip caused by the weather and oil.
The downside risk has three sources. The first is the price of chips. If it falls, the strongest number in China’s economy, exports, will lose speed with no warning in unit volumes. The second is oil. Brent above USD 100 raises factory costs just when factories cannot raise prices at home. The third is credit. If households keep repaying loans through the autumn, neither the rate nor the subsidies will reach consumption.
The risk for the PBoC is asymmetric. If it waits too long, falling inflation will push the real rate ever higher. If it eases sharply, it will pour money into a system where the problem is demand for credit, not its price.
What to watch
On 14 October, September CPI and PPI will show whether core CPI stays below 1%. If it falls below 0.8%, the pressure for a rate cut will grow. September trade data come out the same day. What matters is whether exports grow in volume, not only in value.
Around mid-October comes the PBoC’s September credit data. The key line is household loans. A positive flow would be the first sign that the mortgage subsidy is working.
On 19 October come Q3 GDP and the September monthly data. The threshold for a change of phase remains the one from our Q2 review: GDP growth of at least 4.5% with stronger consumption. If retail sales stay below 1% in September, the threshold will not be met, whatever the surveys say. The threshold for a slide into stagnation is a composite PMI below 50 for two consecutive months, together with production growth below 4%. July and August were already two months below 50, but production stayed above 4%, so the threshold has not been met.
On 20 October the LPR is set. A cut would show that the PBoC is moving from targeted measures to making money cheaper across the board.
On 31 October the official October PMIs will show whether September’s recovery is lasting.
Closing
China is selling dearer chips and more cars to the world, while at home it is repaying loans and not buying homes. The shop window is lit, but the warehouse is half empty. The engine is real, but narrow and dependent on the price of one product. The brake is broad and sits in household balance sheets. We do not yet know whether September’s recovery in the surveys is the start of a new phase or just a rebound after bad July weather.
Sources
NBS, Purchasing Managers’ Index for September 2026 (Chinese)
NBS, Purchasing Managers’ Index for January 2026, April 2026, June 2026
S&P Global, RatingDog China General Manufacturing PMI, August 2026, with the final July reading
S&P Global, RatingDog China General Services PMI, August 2026, with final July readings
S&P Global, RatingDog China General Manufacturing PMI, September 2026
S&P Global, RatingDog China General Manufacturing PMI, February 2026
S&P Global, RatingDog China General Services PMI, February 2026
NBS, home prices in 70 cities, July 2026, official commentary (Chinese)
NBS, Industrial Profits, January to July 2026 and January to August 2026
PBoC, financial statistics, April 2026, as reprinted by People’s Daily (Chinese)
PBoC, financial statistics, H1 2026, official mirror (Chinese)
PBoC, liquidity operations, July 2026 and August 2026 (Chinese)
PBoC, adjustments to monetary policy tools, 29 September 2026 (Chinese)
Ministry of Finance, PBoC and financial regulator, mortgage interest subsidy (Chinese)
Ministry of Finance, fiscal data, January to July 2026 (Chinese)
MOFCOM, foreign direct investment, January to July 2026 (Chinese)
Not financial advice.
Liquidity Desk | liquiditydesk.org