

Frame
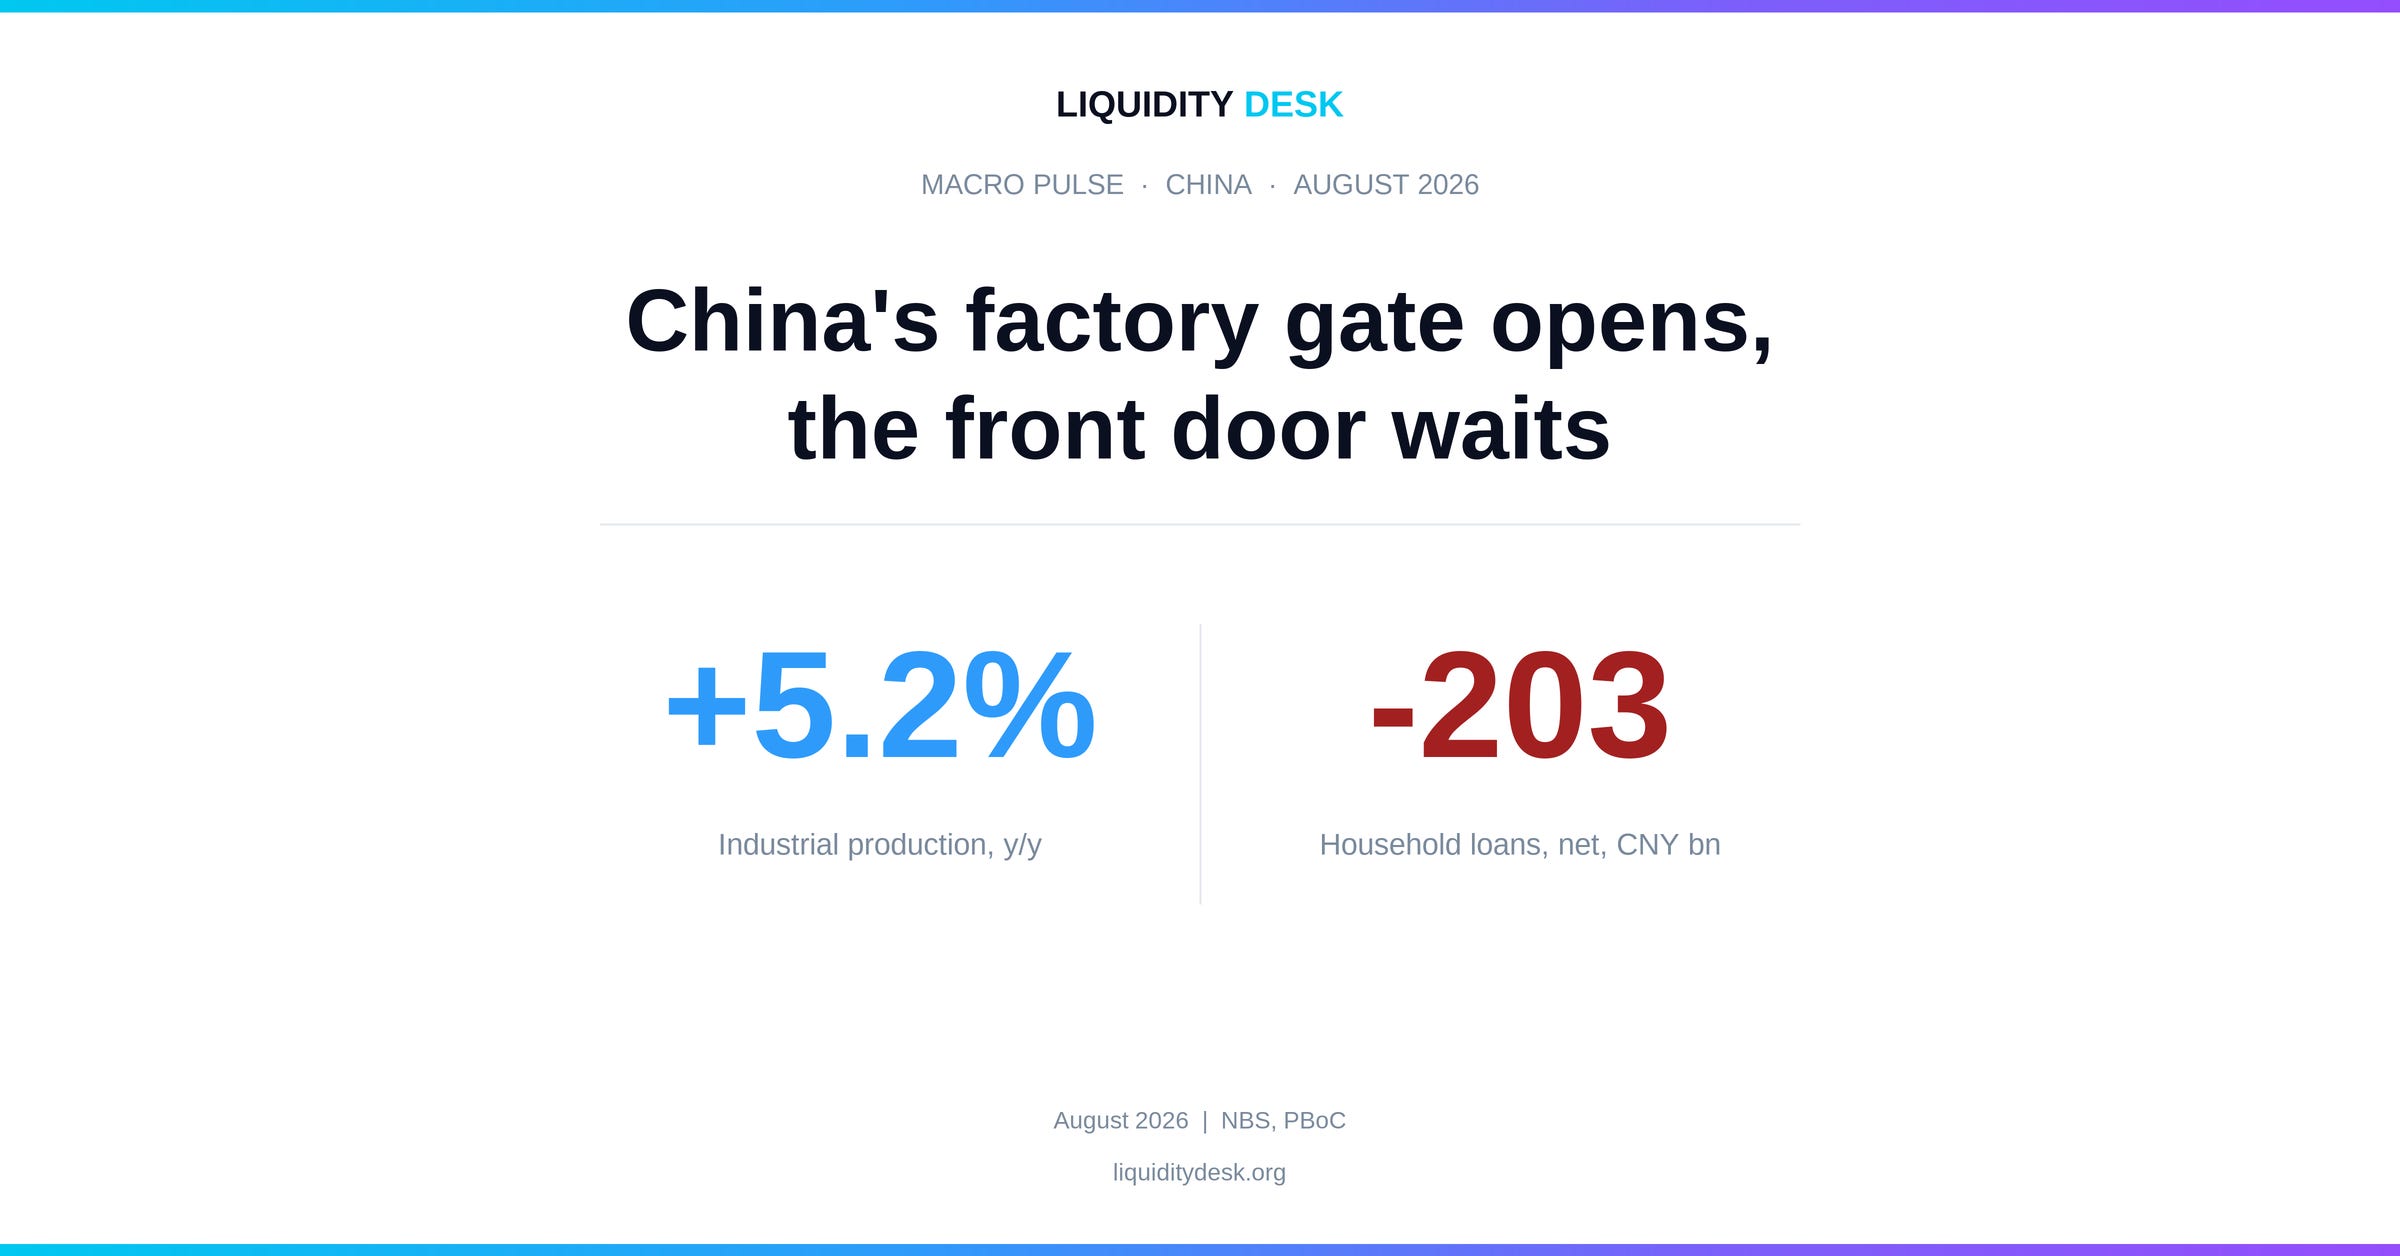
This is our second monthly Macro Pulse for China. All the main August releases are now out. The last to arrive were industrial profits, on 29 September. This month we watch two doors. The factory gate: production, exports and loans to companies. And the front door of the home: what families buy, the housing market and household borrowing. In August the first one opens. The second stays almost shut.
Where the economy stands
The phase in August remains growth with slowing momentum. August repairs July but does not erase it. Industrial production accelerated to 5.2% from a year earlier, from 4.5% in July. Dollar exports grew 25.0%. The official composite PMI, however, is 49.5, below 50 for a second month running. The PMI is a survey of purchasing managers in which a reading below 50 means more firms report deterioration than improvement. This is a rebound within the phase, not a new phase.
The engine is the same as in July: electronics and cars, sold abroad. High-tech manufacturing grew 16.7%. What is new is that companies are taking out long-term loans again, after repaying them in July.
The brake is also the same: the home. Retail sales grew 0.4%. Households repaid about CNY 203bn more than they borrowed. Property investment is 19.9% lower over eight months. The brake is structural, and one good month in the factories does not release it.
The central bank, the PBoC, has no reason to tighten. Consumer inflation is 0.8% and core inflation 1.0%. The rate stays put and easing remains targeted. The real cost of money even fell slightly in August, not because of the PBoC but because inflation rose.
Core indicators
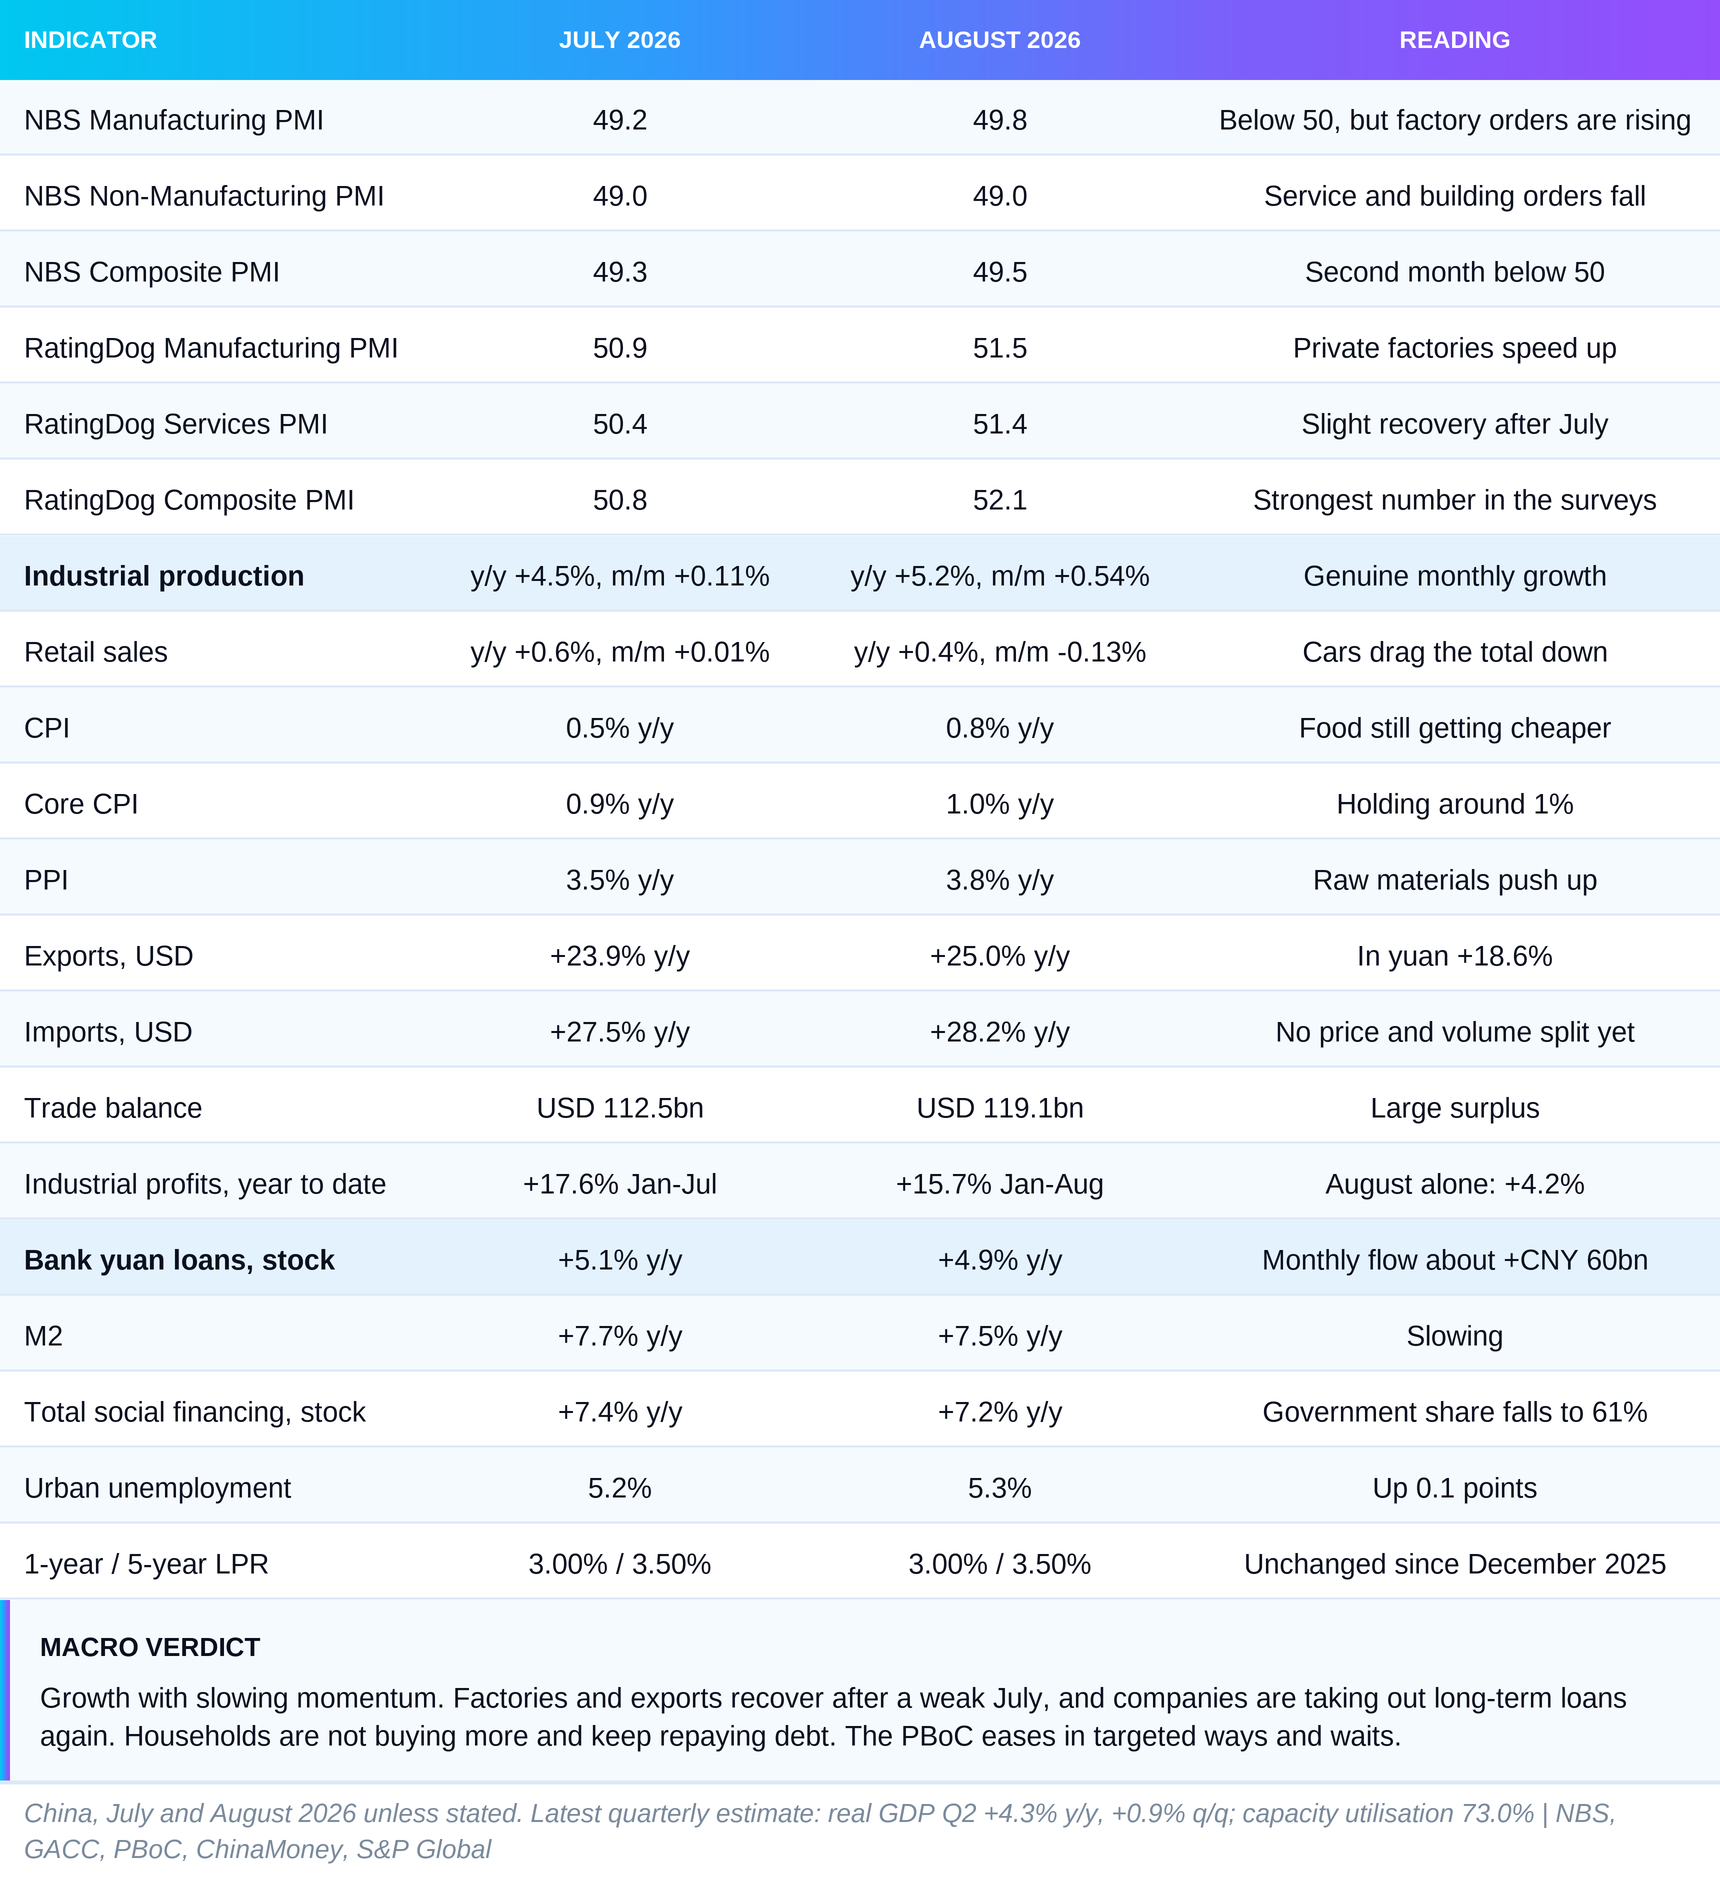
The PBoC’s August credit data are preliminary. NBS and RatingDog are two different surveys. NBS covers more large and state-owned enterprises, RatingDog more private and export-oriented firms, so the two are not compared directly.
The trajectory
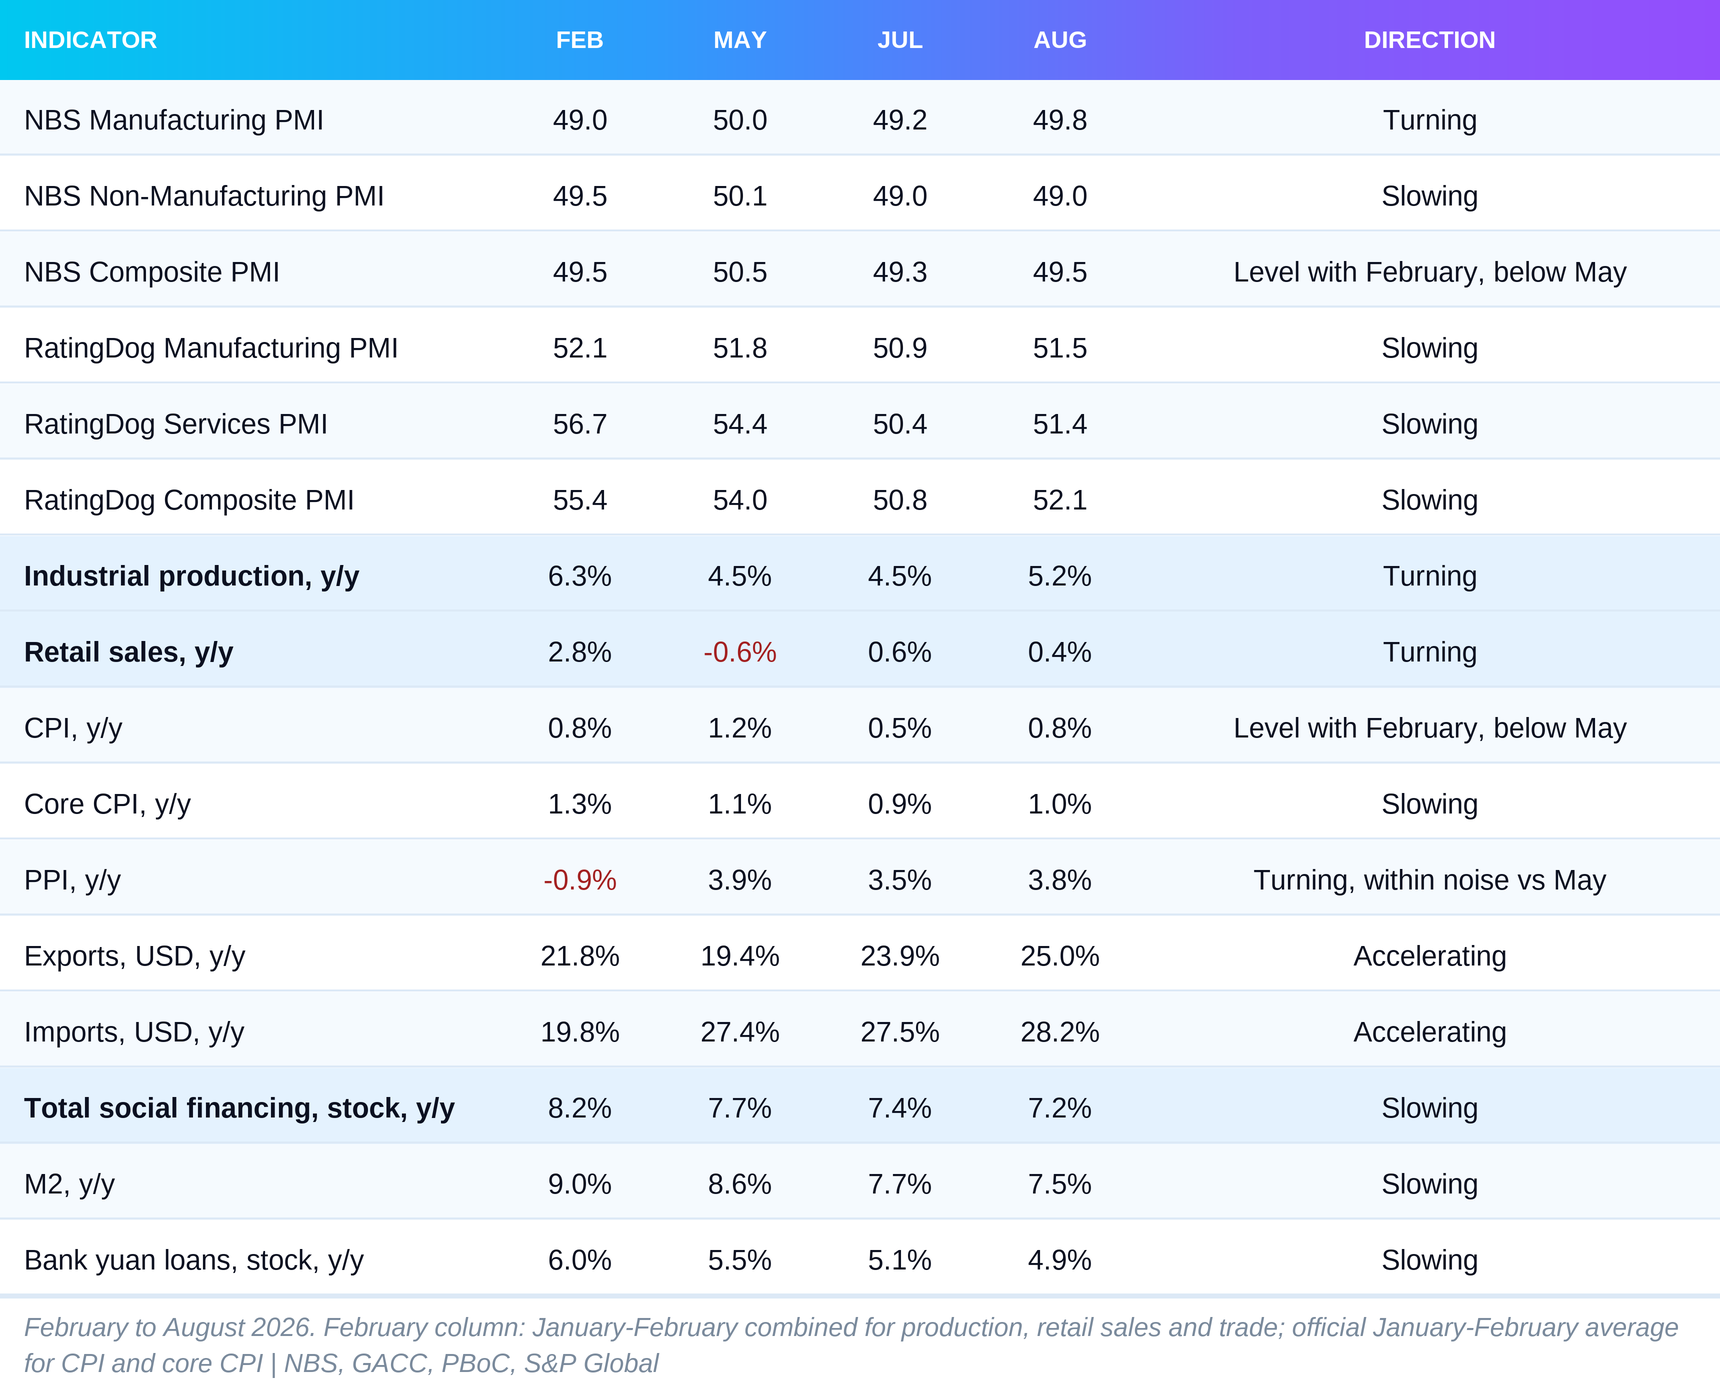
For production, retail sales and trade, the February column is the combined January and February figure, which is how Chinese agencies publish them. For CPI and core CPI it is the official average of the two months, because Chinese New Year distorts each of them on its own.
Three lines carry the story.
The first is industry. It is above May but below the start of the year. What matters is that the rebound is not just a convenient base effect. Seasonally adjusted, production grew 0.54% from July, against just 0.11% a month earlier. Factories really are producing more.
The second is retail sales. The table shows them turning, because they are above a negative May. The monthly number says otherwise: seasonally adjusted, August sales were 0.13% lower than in July. Annual growth is positive, but spending is not rising. Factories are speeding up, shops are standing still.
The third is credit. Total social financing, the broadest measure of money flowing to the economy, slows at every point in the table: 8.2%, 7.7%, 7.4%, 7.2%. M2, the broad money in the system, fell from 9.0% to 7.5%, and bank loans in yuan from 6.0% to 4.9%. All three lines show the same slope. This is the same six-month slowdown we described in July. Under the headline number, though, something new happened in August. We come back to it in the section on the overlooked detail.
The surveys need a caveat. RatingDog improved from July in both factories and services, but remains below February and May. That is why its direction is “slowing”. Recovering lost speed is not the same as a new trajectory. Spring was stronger than August.
On prices, the big jump is already behind us. PPI, the prices at which factories sell their output, was -0.9% in February and 3.9% in May. The whole rise happened in spring. From May to August the index barely moved and now stands at 3.8%. Consumer prices made no such jump. CPI is 0.8%, the same as the January-February average, and core CPI is 1.0%, below the winter 1.3%. Over six months, factory prices went up and shop prices did not.
The only lines accelerating against both earlier points are exports and imports. That is August’s strength, so we start there.
The engine: chips, cars and the neighbours
China’s factory is growing at two speeds. Industry as a whole added 5.2%. High-tech manufacturing added 16.7%, computers and electronic equipment 17.2%, and output of industrial robots was 34.6% higher than a year earlier. At the other end, cement fell 11.7% and oil refining 6.9%. The factories that sell to the world and to other companies are growing. The ones that sell to building sites are shrinking.
How big is the engine? In August China exported goods worth USD 401.4bn and imported USD 282.4bn. The surplus was USD 119.1bn in a single month. From January to August, just three groups, integrated circuits, computers and their parts, and cars, brought in USD 582.5bn of exports. That is about a fifth of all goods exports. It is not a share of GDP, because every exported chip contains imported components. But it is enough to move the entire trade statistics.
Chips repeat July’s story, only more strongly. Customs publishes both the value and the quantity of exports for its main products. The value of exported integrated circuits from January to August was USD 256.8bn, 103.9% more than a year earlier. The number of chips for the same eight months was only 4.1% higher. The average value of an exported chip is about 96% higher. In July the gap was 88%. Part of this is a shift to more expensive products rather than the same chip at double the price. China is still exporting dearer chips, not many more chips.
Cars are the opposite case. Car exports from January to August were USD 129.1bn, up 53.2%, and the number of cars exported rose 51.2%. Here the growth is almost entirely volume. At home the picture is different. Car output in August was 2.7% lower, and output of saloon cars 22.7% lower. New energy vehicles grew 21.9%. Value added in the car industry still rose 8.7%. China is making fewer cars, but with more value and more of them electric, and it is selling more and more of them abroad.
The currency adds a caveat. In yuan, August exports grew 18.6%; in dollars, 25.0%. The difference comes from a stronger yuan than a year ago. Neither number is growth in the units shipped.
The geography has not changed. From January to August, exports to the United States grew 6.2% and make up 10.3% of the total. Exports to Hong Kong grew 50.4%, to South Korea 35.3% and to Southeast Asia 25.8%. China is selling more and more to its neighbours, who are part of the same supply chain for servers and electronics.
Is the engine sustainable? The surveys say “for now, yes”. The official PMI also asks factories whether they are receiving more or fewer new orders from their customers than a month earlier. In August this index jumped 2.1 points to 50.6, meaning more factories reported rising orders than falling ones. Orders from abroad alone returned above 50, to 50.1. Profits are more cautious. Cumulative growth over eight months is 15.7%, but in August alone it was 4.2%, after 11.2% in July. Profits of electronics makers more than doubled from January to August, up 110%. The engine is real, but its profit is concentrated in a narrow circle of companies.
There is also something the data cannot show. For chips and cars we know how much of the growth is price and how much is volume. For exports as a whole we do not. The overall price and volume indices, which showed in July that two thirds of export growth was price, have not yet been published for August. Nor do we know whether some orders are front-loading, where a customer stocks up now so as not to buy later.
What could stop the engine? A fall in chip prices would cut the value of exports quickly, without China losing a single customer. Measures against Chinese cars in the markets they are entering. And a stronger yuan, which makes Chinese goods dearer for foreign buyers.
The brake: the home
Retail sales grew 0.4% from a year earlier. Excluding cars, growth was 2.5%. Car sales at larger retailers fell 18.5%. One item drags the total down, but it does not explain everything.
The breakdown shows exactly where Chinese households are not spending. Furniture sales were 7.9% lower and building materials 11.8% lower. Telecom equipment grew 27.3%, supported by state subsidies for trading in old appliances for new ones. Sales of services from January to August grew 4.9%, against 1.0% for goods. Chinese households buy phones and pay for services, but save on everything that goes into a new home.
Property remains the deepest part of the brake. From January to August, property investment was 19.9% lower, new construction starts 24.8% lower and floor space sold 12.1% lower. These are cumulative figures for eight months, not a fall in August alone. But all three are slightly worse than the January to July figures. The bottom of construction is not yet in sight.
Home prices give the first better signal. In the four largest cities, new and second-hand homes rose 0.1% from July. In Shanghai, new homes are 3.0% dearer than a year earlier. Outside the first tier, however, prices keep falling every month. From a year earlier, new homes in second-tier cities are 2.7% cheaper and in third-tier cities 4.1% cheaper. For second-hand homes the falls are 4.9% and 5.6%. Only 21 of the 70 cities tracked show a monthly rise or no change in new home prices, two fewer than in July, and only 8 for second-hand homes, the same as in July. The bottom is visible in Shanghai, not in the provinces.
Credit confirms the hesitation. Households repaid a net CNY 203bn or so in August, less than CNY 460bn in July, but still more than they borrowed. Their short-term loans, which often finance purchases, fell by about CNY 122bn. Long-term loans, which include mortgages, fell by about CNY 82bn. When the price of a home is falling, a household does not take out a mortgage, even at a low rate.
The weakness is wider than property. Total fixed-asset investment over eight months is 7.2% lower. Excluding property, the fall is 4.2%. Private investment fell 10.1%, and 6.4% excluding property. Infrastructure is 4.0% lower. The exception, again, is equipment, up 9.3%. Companies are replacing their machines, not expanding.
The labour market is getting slightly heavier. Urban unemployment is 5.3%, 0.1 points above July. The employment index for services and construction in the official PMI is 45.4, well below 50.
Is the brake structural? Yes. In July we could blame part of the weakness on floods and heatwaves. August has no such excuse. In services and construction the picture is the reverse of the factories. The new orders index there is 44.1: many more firms are receiving fewer orders from their customers than more. In construction it is just 42.4, and construction activity itself is 46.9, almost the same as in July. The rain stopped, but the new contracts did not come back. The brake will loosen when families believe their home will not lose more value. Shanghai is the first place where that may be happening.
Prices: factories get dearer, shops barely move
Consumer inflation returned to 0.8% from a year earlier, from 0.5% in July. In the month alone, prices rose 0.4%. Part of the jump is seasonal: fresh vegetables rose 5.5% from July. From a year earlier, food remains 1.4% cheaper and pork 11.8% cheaper. Excluding food, prices are 1.2% higher.
Core CPI, excluding food and energy, is 1.0%, after 0.9% in July. It is the better measure of domestic demand. It is lower than the winter average of 1.3%. A one-month rise does not reverse the medium-term picture. One item stands out again: the “other goods and services” group, which includes jewellery, is 7.3% dearer. That is more the price of gold than pressure from demand.
PPI grew 3.8% from a year earlier and 0.4% in the month. Mining prices are 17.8% higher and raw materials 6.7% higher. The prices factories pay for their inputs rose 5.8%. On consumer goods, however, factories are selling 0.5% cheaper. Costs climb up the chain but do not reach the shelf.
The gap between PPI and CPI remains 3.0 points, as in July. This gap shows where the pressure is: on producers of goods for the domestic market. The two indices measure different baskets, though, and the gap is not a direct measure of margins.
The surveys show that in August some factories began to pass costs on. In the official PMI, the index of raw material prices rose from 53.2 to 56.6. The index of selling prices jumped from 47.8 to 50.4, above 50 for the first time since May. The private RatingDog survey says the opposite: costs are rising, and firms cut their selling prices for the first time in 2026. The two surveys do not contradict each other. Larger firms can raise prices. Smaller private and export firms cannot.
Profits confirm that the pressure is sector by sector, not everywhere. Industry’s overall profit margin from January to August is 5.66%, 0.44 points higher than a year earlier. Electronics makers earn 110% more. Carmakers earn 16.0% less, power producers 15.1% less, and makers of cement, glass and other non-metallic minerals 46.7% less.
The conclusion on prices is the same as in July, but milder. Domestic inflation is low and does not constrain the PBoC. Factory inflation is high, but larger firms are starting to pass it on.
The overlooked detail: companies are borrowing long again
The credit headline for August is dull. Bank loans in yuan grew by about CNY 60bn in the month, almost nothing for an economy the size of China’s. Their annual growth slowed to 4.9%. Under that near-zero number, however, are two opposite flows.
The first is at companies. Long-term loans to enterprises and organisations rose by about CNY 320bn. In July they fell by CNY 230bn. Short-term corporate loans fell by about CNY 160bn, and bill financing, where a bank pays a company early for a receivable from a trade deal, added CNY 100bn, after CNY 376bn in July. Companies are swapping money for day-to-day payments for money that lasts years.
The second flow is at households, which repaid about CNY 203bn. The two flows almost cancel out in the total. That is why the headline misses it.
The same shift shows up in total social financing. In August it added CNY 1.66trn. CNY 1.01trn of that was government bonds, or 61%. In July the government’s share was 94%. Bank loans to the real economy in this measure turned positive at CNY 55bn, after minus CNY 590bn in July. Our September liquidity piece described July’s credit as a broken detour: the state was creating financing, and private credit was not following. August shows the first stretch where the route reconnects.
Why is this overlooked? Because the total has not changed, but its composition has. A long-term loan is a loan for a machine, a plant or a project. A short-term loan or a bill is money for wages and suppliers.
There are four caveats. The monthly flows are differences between the PBoC’s rounded cumulative figures, and the data are preliminary. The corporate category also includes organisations such as public institutions, so not all the new debt goes to private companies. A long-term loan can refinance old debt instead of buying a new machine. And one month does not make a credit cycle. If the improvement repeats in September and reaches households, we will have to change our reading of the brake.
What this means
The August data give the PBoC a mixed but readable picture. Growth is recovering in the factories and staying weak at home. Consumer inflation is low, factory inflation high. The last confirmed quarterly position was Q2: growth weakening and consumer inflation easing, with higher factory prices. August does not contradict it. The lean remains towards easing, but targeted.
The rate is not moving. The one-year LPR, China’s benchmark lending rate, has been 3.0% since December 2025. The five-year rate, the reference for mortgages, is 3.5%. The real rate, the LPR minus current inflation, fell from 2.5 points in July to 2.2 in August. July’s passive tightening has stopped. The reason is higher inflation, not action by the PBoC.
Quantities look tighter than they are. In August the PBoC drained a net CNY 409bn or so through its operations. Bank reserves at the central bank fell by CNY 311bn. This time the state did not park large sums in its account at the PBoC; its deposits grew by only CNY 30bn. The interbank rate, however, fell from 1.40% to 1.38%. If banks needed money, they would pay more to borrow it from one another. Banks have money. The problem is who wants it.
After the end of the month, the PBoC acted along the same lines. On 29 September it cut the rate on PSL, its targeted loans to the state development banks, from 1.75% to 1.50%. It raised the credit line for technology by CNY 200bn, to CNY 1.4trn, and raised the share of banks’ loans it refinances under that line from 60% to 100%. It added CNY 500bn for agriculture and small businesses, of which CNY 300bn is for private firms. These are limits, not money spent. They become a flow when banks use them.
Closer to home is the mortgage subsidy. From 1 October the state covers 1 percentage point a year of the interest on a new loan for a first home, for up to five years. The home must be no larger than 120 square metres and cost no more than CNY 1.5mn, and the subsidy covers a loan of up to CNY 1mn. On a CNY 1mn loan that is up to CNY 10,000 a year. For now the programme accepts new loans for one year. For a family that already wants to buy, this is a big discount: close to a third of the five-year benchmark. For a family afraid that its home will lose more value, it may not be enough.
What does this mean for liquidity? It is not missing in the banks. It is starting to reach companies, but not yet households. The mortgage subsidy is the first measure aimed squarely at that link. The first test will be October credit, published in November. September’s data cannot show an effect yet.
For an ordinary person in China, August looks much like July. Food is cheaper than last year. Their home, unless it is in Shanghai, is losing value. Work is slightly harder to find. Credit is getting cheaper, but they still do not want it.
What is confirmed? That factories are producing more, that companies are borrowing long-term again and that households keep repaying debt. What remains an assumption? Whether the corporate loans will become investment. Whether the subsidy will bring families back to mortgages. And how much of export strength is price.
Risks in both directions
The strongest argument against our phase comes from September. The official manufacturing PMI is 50.1, the composite 50.7, and new factory orders 50.5. In our Q2 review we set a composite PMI above 50 and new orders above 50 as the threshold for a change. The September surveys meet it. RatingDog manufacturing is 52.1. The RatingDog composite rose to 52.4, and services to 51.6. Add corporate credit, the first price rises in the big cities and the new mortgage subsidy, and the path to acceleration is clear. If the September hard data confirm the surveys, August will turn out to be the start of a new phase that this piece reads cautiously.
The downside risk has four sources. The first is chip prices. If they fall, China’s strongest number, exports, will lose speed with no warning in the unit counts. The second is front-loading. If some of August’s orders were stock-building, the autumn will give it back. The third is costs. In our September Commodity Snapshot, Brent crude is above USD 100. That hits exactly the RatingDog firms that cannot raise their prices. The fourth is credit. If the new corporate loans turn out to be refinancing, and households keep repaying debt, the factory rebound will stay separate from the home.
What to watch
On 14 October, September CPI and PPI will show whether core CPI holds at 1.0% or above. If it falls below 0.8%, pressure for a rate cut grows. September trade comes out the same day. It matters whether customs also publishes the August price and volume indices.
Around mid-October the PBoC publishes September credit data. The test has two parts: a positive household flow, and a second month of growth in long-term corporate loans.
On 19 October come Q3 GDP, the September monthly data and home prices. The threshold for a shift to acceleration stays as set in our Q2 review: GDP growth of at least 4.5% with stronger consumption. If retail sales stay below 1%, the threshold will not be met, whatever the surveys say. On housing, we watch whether the number of cities with no fall in new home prices rises above 21.
On 20 October the LPR is set. A cut would show the PBoC moving from targeted measures to cheaper money across the board.
On 31 October, the official October PMIs. The threshold for stagnation is a composite PMI below 50 for two consecutive months, together with production growth below 4%. July and August were two months below 50, but production stayed above 4%, so the threshold is not met.
Closing
China is leaving July’s weakness behind through the factory, not through the home. Exports, high-tech production and new long-term corporate loans make the rebound real. Property and household debt keep it narrow. The factory gate is open. The front door is ajar only in Shanghai. We do not know whether the corporate loans will become investment, or whether the mortgage subsidy will bring families back to buying. The answer starts to arrive with the credit data in November.
Sources
NBS, Purchasing Managers’ Index for February, May, August and September (Chinese) 2026
S&P Global, final RatingDog China General Manufacturing PMI for February, May, August and September 2026
S&P Global, final RatingDog China General Services and Composite PMI for February, May, August and September 2026
NBS, Industrial Production Operation for January-February, May, July and August 2026
NBS, Total Retail Sales of Consumer Goods for January-February, May, July and August 2026
NBS, Consumer Price Index for February, May, July and August 2026
NBS, Producer Price Index for February, May, July and August 2026
NBS, Investment in Real Estate Development and Sales, January-August 2026
NBS, Sales Prices of Residential Buildings in 70 Cities, August 2026: tables and commentary by city tier (Chinese). The count of cities with no monthly fall is our own tally from the tables.
NBS, GDP for Q2 2026 and Industrial Capacity Utilization for Q2 2026
GACC, total trade in USD for January-February, May, July and August 2026, and total trade in CNY for August
GACC, Major Export Commodities, August 2026. The average value per exported chip is our own calculation.
GACC, Trade Indices list, checked on 2 October 2026
PBoC, Financial Statistics Report for July and August 2026 (Chinese). Monthly flows by sector are our own differences between rounded cumulative figures.
PBoC, Financial Statistics Report for February and May 2026, full text on the official financial portal of Heilongjiang province, citing the PBoC (Chinese)
PBoC, total social financing, monthly flow and stock
PBoC, Balance Sheet of Monetary Authority, to August 2026 and liquidity operations in August 2026 (Chinese). The net sum across instruments is our own calculation.
ChinaMoney, LPR of 20 August 2026 and LPR history (Chinese)
Ministry of Finance, PBoC and NFRA, mortgage interest subsidy from 1 October 2026 (Chinese)
NBS, 2026 release calendar and MOFCOM, official copy of the 2026 customs release calendar (Chinese)
For information and analysis only. Not financial advice.
Liquidity Desk | liquiditydesk.org