

Frame
This is the first monthly Macro Pulse for Japan after our second-quarter review. All the main July releases are now out. Two things that were missing in August have arrived as well: the second estimate of Q2 GDP and the Ministry of Finance’s corporate statistics. Both change the picture. In this issue we separate the money that flows into companies’ tills from the money households actually spend.
Where the economy stands
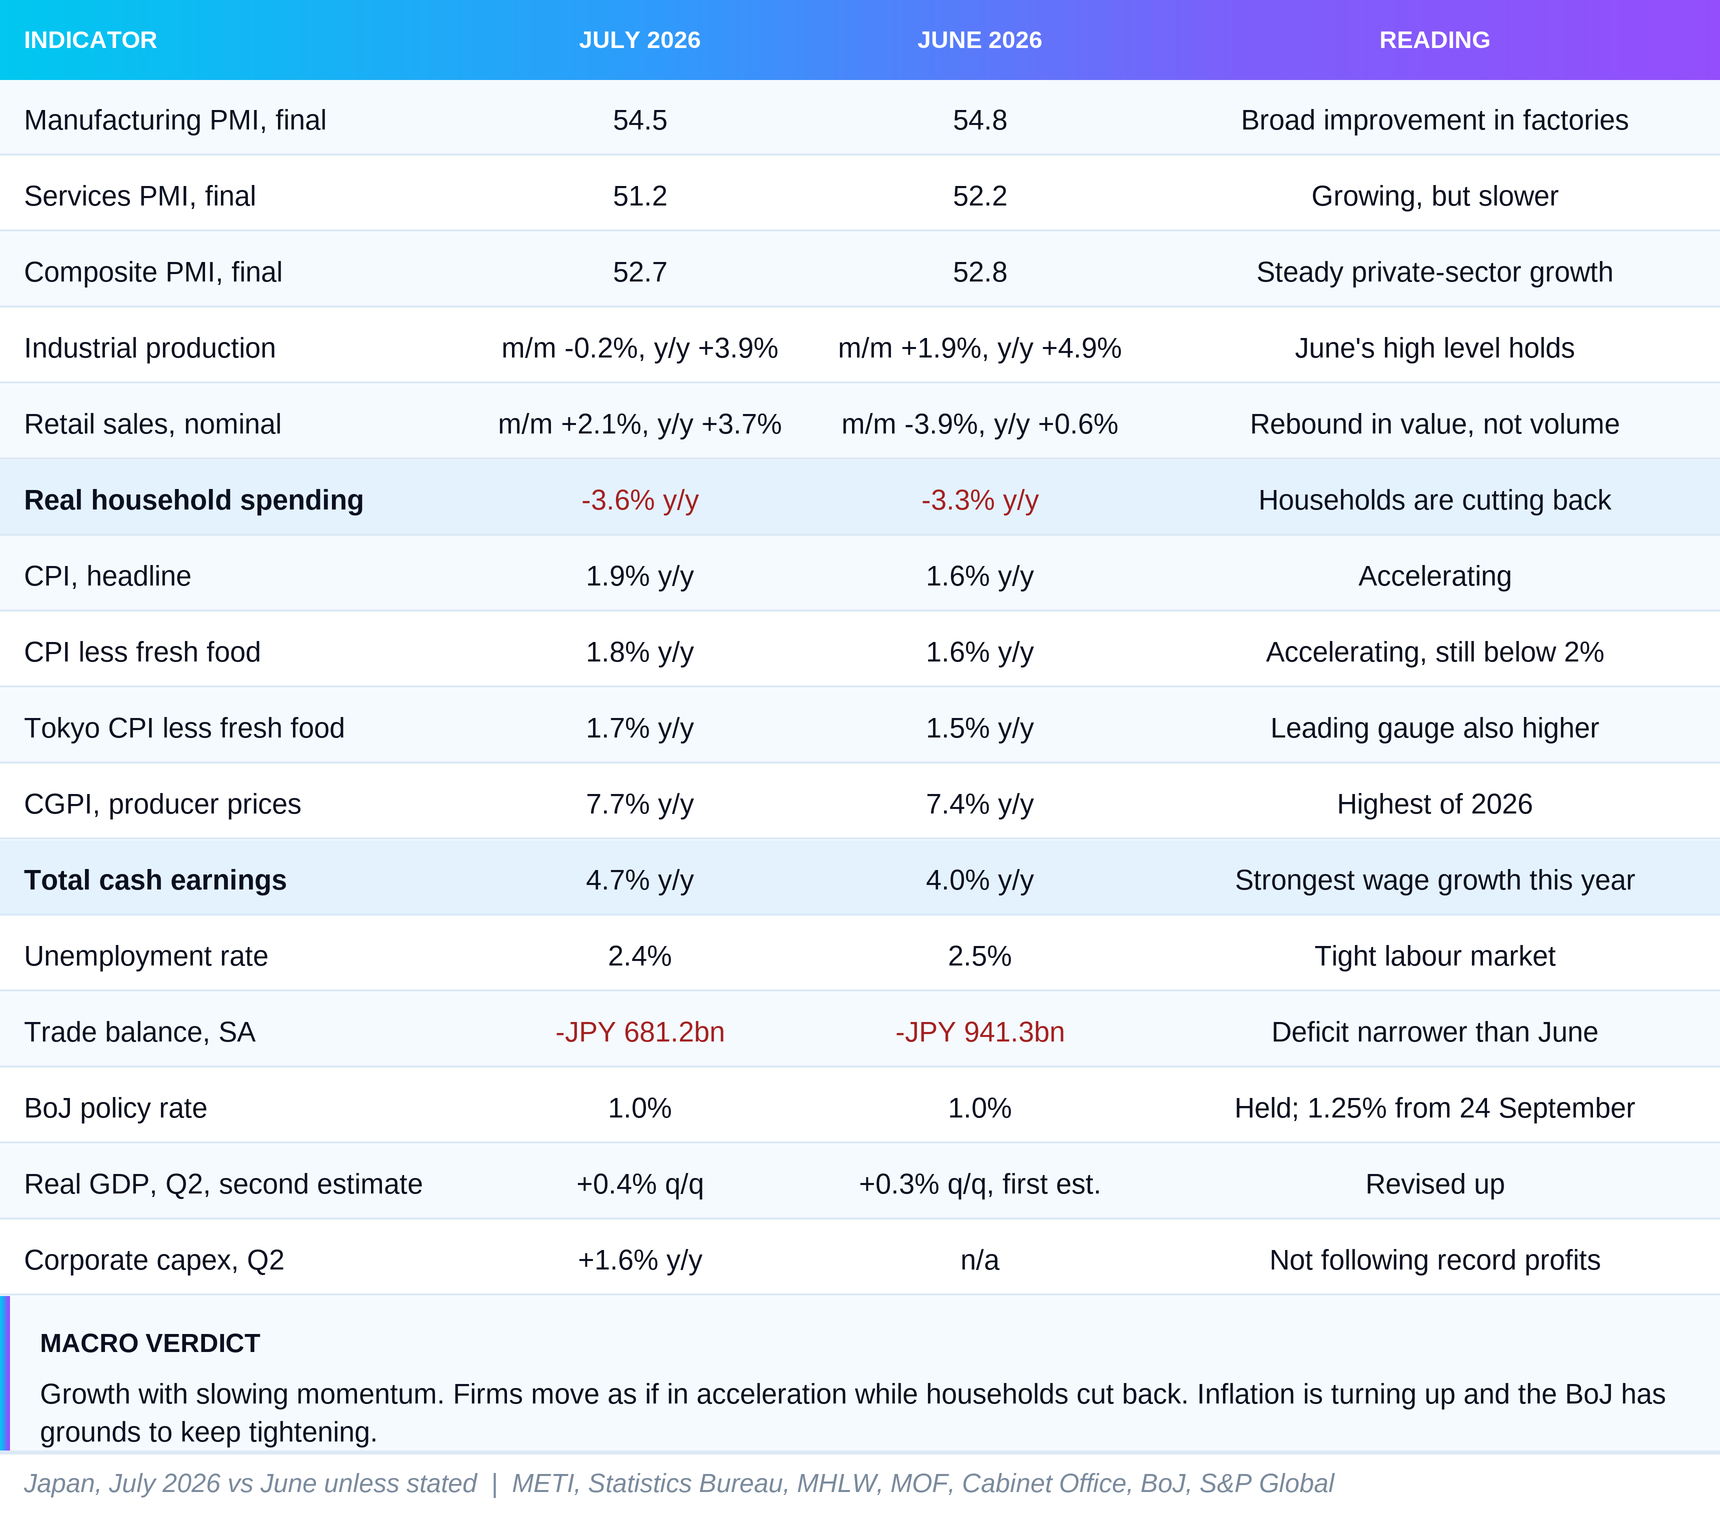
The phase in July remains growth with slowing momentum. July brought no fresh slowdown. It also did not meet the threshold we set in our Q2 review for a shift to acceleration: a positive contribution from both consumption and business investment at the same time. Japan’s economy looks like a shop with a full till and empty trolleys. Companies are earning more than ever. Households are buying less than a year ago.
The engine is global demand for chips and equipment for artificial intelligence. Export volumes are 5.2% higher than a year earlier, the fastest pace since January. Corporate profits in the second quarter were the highest since the statistics began in 1954.
The brake is households. Their real spending is 3.6% lower than in July last year, even though wages are growing at the fastest pace of the year. The brake is mainly cyclical: expensive energy after the war in the Middle East and a weak yen are eating into income. Beneath it sits a structural layer, the ageing population.
Prices are turning up and leave the Bank of Japan little room for patience. Japan’s standard core CPI, the overall index excluding fresh food, rose from 1.6% to 1.8%. The bank waited in July, the government defended the yen with intervention, and on 18 September the BoJ raised its rate to 1.25%. The bias is towards further tightening.
Core indicators
The trajectory
One month cannot decide the phase on its own. A six-month window shows whether July is a continuation or a turn. The direction compares July with January and April, following the rule set in our template.
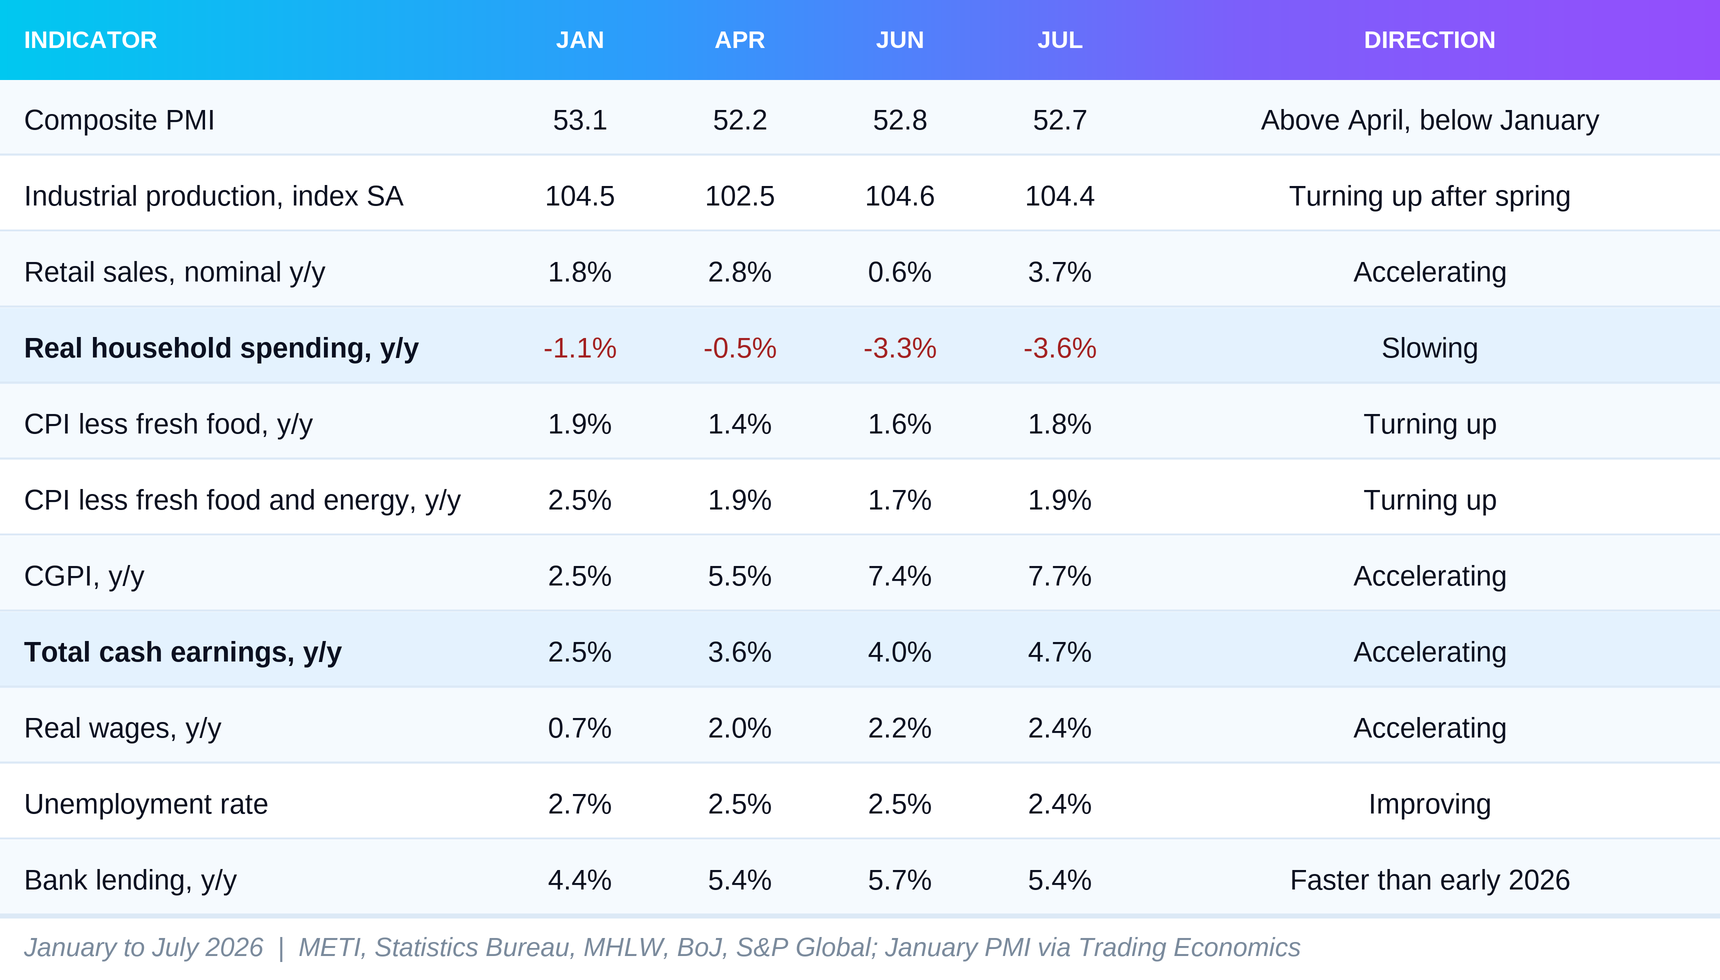
The composite PMI has moved by less than one point across the whole window. The private sector is growing at almost the same pace as at the start of the year, despite the war in the Middle East.
Three lines carry the story. The first is wages. Total cash earnings rose 4.7% from a year earlier, the fastest this year. Real wages, meaning wages adjusted for inflation, are 2.4% above last year. June was also revised up. In our Q2 review we cited 3.4% nominal and 1.6% real growth. The final data show 4.0% and 2.2%. Workers’ income base is sturdier than we thought.
The second line is household spending. It moves the other way. The annual decline deepened for a second month in a row. The monthly gain of 0.5% after June’s 6.3% slump does not change the direction. The gap between wages and spending is the most important contradiction in Japan’s data, and we return to it in the section on the brake.
The third line is prices. All three inflation measures are turning up at the same time. Consumer prices are rising faster than in April and June. Producer prices are rising faster still. This is no longer the second-quarter picture, when consumer inflation was cooling while the pressure sat further up the chain. Now it is starting to move down.
Industrial production deserves one note. The index is almost at its June level, which was the highest of the year. The small July decline is not a reversal of June’s jump. Factory shipments rose 2.1% on the month, and capacity utilisation reached its highest level of the year. Factories are not producing for the warehouse. They are selling.
The engine: chips fill the till
Japan’s engine in July comes from abroad and has a specific name: demand linked to artificial intelligence. It shows up in exports, in orders, in production and in profits.
Exports rose 23.2% from a year earlier in yen terms. Much of that is price, because a weak yen makes every good sold in dollars more expensive in yen. This time, however, volume is moving too. The physical quantity of goods exported is 5.2% above last year, after almost zero growth in May and June. The composition is clear. Exports of semiconductors and electronic components rose 49.1% by value. Exports of chipmaking equipment rose 40.7% by value and 36.2% by volume. By comparison, cars, Japan’s traditional export, rose 19.4% by value but only 0.6% by volume. Cars bring in more yen. Chips bring in more work.
Industrial production shows the same mix. In July, production machinery grew fastest, up 5.1% on the month, led by semiconductor equipment. Information and communication machinery rose 10.2%, electronic components 2.2%. The declines were elsewhere: transport equipment excluding cars, business machinery and metal products.
Orders confirm this is not a one-off. Core machinery orders, meaning private-sector orders for machinery excluding volatile orders for ships and from power utilities, fell 3.7% on the month. That is the usual monthly swing of the series. From a year earlier they are 11.2% higher than in July 2025. Firms keep ordering equipment.
How big is the engine? Here we need to be careful. Manufacturing and exports are a smaller part of Japan’s economy than household consumption. One sector can fill companies’ tills without lifting the whole economy. That is exactly what the GDP data say. The second estimate revised Q2 growth up from 0.3% to 0.4% on the previous quarter. But most of the contribution still comes from net exports and government consumption. Domestic demand as a whole still subtracts from growth.
Is the engine durable? Probably yes, in the short run. The August manufacturing PMI, a survey of purchasing managers in which a reading above 50 signals improvement, rose from 54.5 to 54.9. New orders at factories grew at the fastest pace since January 2018. The companies themselves name semiconductors and AI-related products as the reason. Factory hiring was the fastest since February 2018. This does not look like demand pulled forward, as we suspected in our Q2 review. It looks like a cycle.
What could stop it? Three things. The first is a reversal in global investment demand for AI infrastructure. Japanese equipment suppliers sit at the start of the chain and are the first to feel it if large buyers delay projects. The second is a strong yen. If the yen appreciates sharply, the same sales will bring in fewer yen and profits will shrink. The third is energy. Japan’s factories run on imported fuel, and the war in the Middle East remains an open risk to supplies.
The brake: the household wallet
The brake is in the household wallet. Real spending by households of two or more people fell 3.6% from July last year. In nominal yen the decline is 1.5%. So households are not only paying more for the same basket. They are buying less.
Retail sales look better. Sales rose 2.1% on the month and 3.7% from a year earlier. But these are nominal values. Goods in the consumer basket cost 2.7% more than a year ago. Once price increases are removed, the real growth in sales is much more modest. July’s rebound also follows a 3.9% drop in June. Taken together, the two months show a plateau, not a recovery.
Why are households spending less while wages grow 4.7%? The answer lies in who receives the wages. The wage survey measures pay for employees at firms with five or more staff. The spending survey covers all households of two or more people, including those in which nobody works. In ageing Japan, many of them live on pensions. Pensions do not rise at the pace of wages, while higher food and energy prices hit them in full. So strong wage growth and weak consumption do not contradict each other. They describe different people.
Sentiment is improving, but slowly. Consumer confidence, a Cabinet Office index of household expectations, rose from 33.8 in June to 34.9 in July and 35.5 in August. The direction is right. The level, however, remains far below February’s 39.7. In March, after the war in the Middle East broke out, the index fell 6.4 points. The survey of shop staff, taxi drivers and others in direct contact with customers, known as Economy Watchers, improved from 44.0 to 45.7. A reading below 50 means more of them see deterioration than improvement.
July also brought a local shock. On 28 July an earthquake of magnitude 7.1 on the Japanese scale struck Kumamoto prefecture. Economy Watchers cite it as a factor weighing on expectations. Its effect on national data cannot be isolated from the July figures, but for the region it is real.
The labour market shows exactly where the brake sits. Unemployment fell to 2.4%. The ratio of job openings to applicants remained at 1.18. But new job postings are 0.8% below last year. The decline is concentrated in hotels and restaurants, down 10.7%, and in trade, down 7.3%. In manufacturing, postings rose 6.8%. Employers are showing where they see demand. Factories are hiring. Sectors that live on household spending are cutting their postings.
Is the brake cyclical or structural? Mostly cyclical. The energy shock, the weak yen and dearer food can recede. Food excluding fresh produce is 3.0% more expensive than a year ago, against 5.6% in January. The pressure there is already easing. If energy and the yen stabilise, real incomes will recover and consumption has room to catch up. But beneath the cyclical layer lies a structural base. An ageing population and the dependence of many households on fixed income make Japanese consumption slower to respond to good news from the labour market. That part will not loosen after one good quarter.
The second brake sits inside companies themselves. They are earning record profits but not investing in proportion. We devote the section on the overlooked detail to it.
Prices: the pressure moves down the chain
In the second quarter consumer prices were cooling while the pressure stayed with producers. In July that picture is changing. The pressure is starting to reach consumers.
The overall consumer price index rose 1.9% from a year earlier, after 1.6% in June. Japan’s standard core CPI, excluding fresh food, stands at 1.8% after 1.6%. The measure excluding fresh food and energy, sometimes called core-core, is 1.9% after 1.7%. All three are turning up at the same time. Energy prices rose on the year for the first time since the start of 2026, despite government measures to reduce household bills. Goods prices rose 2.7%. Services remain much calmer, at 1.2%.
Producer prices tell of stronger pressure. The CGPI, the Bank of Japan’s index of prices at which firms sell goods to one another, rose 7.7% from a year earlier. Here we need to correct our own reading. In our Q2 review we wrote that the CGPI had almost lost monthly momentum in July, with growth of only 0.1%. The revised data from September show a 0.4% monthly rise and 7.7% annual growth instead of 7.2%. July was not a pause. It was the high point of the year.
Import prices in yen are 29.3% above last year. The average price of crude oil imported in July was $114.35 a barrel, 60.2% more than a year earlier. In yen the increase is 78.0%, because a weaker yen adds to the dearer oil.
The gap between producer prices and core CPI is 5.9 percentage points. That does not mean consumer inflation will reach 7%. The two indices cover different things. But it shows how much cost is still waiting to be passed on. The survey of service companies suggests the pass-through is already under way. In August they raised their selling prices at the second-fastest pace in the history of the series.
The check after July is mixed. In August headline CPI stayed at 1.9%, core CPI eased slightly to 1.7%, and core-core held at 1.9%. Energy slipped back into negative territory. The CGPI fell 0.2% on the month, mainly because electricity, gas and petroleum products became cheaper. Import prices dropped 3.0%. So the peak of energy pressure may have passed. But prices excluding food and energy are not retreating, and wages are growing at the fastest pace of the year. That is exactly the combination the Bank of Japan has been waiting for over years: inflation that holds even when energy gets cheaper.
The overlooked detail: record profits, almost no investment
In the second quarter Japanese companies earned ¥44.67 trillion in ordinary profit, meaning profit from core business plus financial income such as dividends and interest. That is the highest quarterly level since the Ministry of Finance statistics began in 1954. Growth was 24.6% from a year earlier. Operating profit, from core business alone, rose 23.7%. So the record is not only an accounting effect of the weak yen on foreign earnings.
Capital spending by the same companies rose 1.6%. In manufacturing it fell 3.7%. The arithmetic is simple. Compared with a year earlier, quarterly profit is about ¥8.8 trillion higher. Investment is about ¥0.2 trillion higher. Of every extra ¥100 of profit, about ¥2 goes into new machinery, buildings and software.
The gap is sharpest exactly where the engine is. Makers of information and communication machinery increased profit by 171.2% and cut investment by 29.3%. Makers of transport equipment, mostly carmakers, increased profit by 50.6% and cut investment by 17.0%.
Why is this overlooked? Because record profit looks like proof of a strong economy. It is proof of strong companies. The difference lies in where the money goes. Profit that stays in the till turns into dividends, share buybacks or deposits. Profit that is invested turns into orders for other firms, jobs and higher productivity.
There are several honest explanations. Construction costs are rising and make projects more expensive. The shortage of workers limits how fast anything can be built. Uncertainty around the Middle East and world trade makes companies wait. And investment generally lags profit. In June, companies in the BoJ’s Tankan survey planned 6.8% more investment for the fiscal year that began in April. If those plans materialise in the second half, Q2 will turn out to be a simple delay.
For now, however, the GDP data confirm the picture. Real business investment fell 0.9% in Q2. The till is filling. The machines are not being bought. Until that changes, the strength of Japan’s companies will not become the strength of Japan’s economy.
What this means
July’s data give the Bank of Japan more arguments for tightening than for waiting. Growth continues and the corporate sector is accelerating. Inflation is turning up precisely in the measures the bank watches most closely: prices excluding food and energy, and wages. Consumer prices are still below the 2% target, but the BoJ itself expects them to move clearly above it from the second half of the fiscal year. Our last confirmed quarterly position, for Q2, was the most uncomfortable one: growth weakening while inflationary pressure rises. July does not refute it, but it tips the balance towards the inflation side.
The bank is reacting gradually. On 31 July it left the rate at 1.0% by a vote of 8 to 1. The dissenting member proposed 1.25%. On 18 September the BoJ did exactly that, by a vote of 7 to 2. The two dissenters argued that the economy had not accelerated enough and that core CPI was still below 2%. The bank says it will keep raising rates. That decision came after the period, so it is not a July observation. But it shows how the BoJ read July.
Between the two meetings the government acted through the currency. The average rate in July was 162.45 yen per dollar, a yen 10.8% weaker than a year earlier. Between 30 July and 26 August the Ministry of Finance sold dollars and bought yen worth ¥15.4 trillion. According to Reuters and AP, the US Treasury also took part in the intervention. The effect was limited: in August the yen averaged 158.81 per dollar. Intervention buys time but does not change the direction. A lasting shift can only come from interest rates.
What does this mean for liquidity? Conditions are tightening, but not abruptly. The monetary base, the money the BoJ creates directly, was 15.7% below last year in August. Banks, however, keep lending: loans grew 5.4% from a year earlier. The real interest rate, meaning the rate minus inflation, remains negative even after the September increase. With a 1.25% rate and core CPI at 1.7% in August, it is roughly minus half a percentage point. Monetary conditions still support the economy. The BoJ says so itself.
The real tightening is coming from the bond market. The yield on 10-year Japanese government bonds (JGBs) was 2.69% at the end of June and 2.80% at the end of July. On 24 September it stood at 3.07%. The two-year yield, which tracks expectations for the BoJ rate, jumped from 1.38% to 1.91% over the same period. The market is already pricing more increases. The part of credit that depends on long-term rates is becoming more expensive faster than the BoJ rate itself.
For ordinary people the picture is split in two. An employee at a large company is getting the biggest raise in years, and work is easy to find. A pensioner or a household on fixed income pays for dearer food and energy without compensation. Higher rates will help savers in yen but will weigh on borrowers with floating-rate mortgages.
What is confirmed? That the corporate half of the economy is accelerating, that wages are rising and that inflation is turning up. What remains assumption? Whether record profits will become investment. Whether higher wages will reach spending. Whether the energy peak has already passed.
Risks in both directions
The strongest argument against our phase is that we are too cautious. The PMI is above 52, machinery orders are 11% higher than a year ago, exports are growing in volume, wages are accelerating and companies are earning record profits. August data reinforce this picture. The composite PMI jumped to 53.5. According to S&P Global, this is the fastest private-sector growth since before the war broke out in February. If record profits start turning into investment and wages into purchases, Japan could move into acceleration faster than we assumed. Today’s caution would then look like a delay.
The downside risk has three sources. The first is consumption. If real household spending stays negative, growth will depend entirely on exports, which are exposed to any turn in the global AI cycle. The second is the interest rate. If the BoJ tightens faster while households are still cutting back, domestic demand could break. The third is energy. A new escalation in the Middle East would hit factory margins and household budgets at the same time.
The risk for the BoJ is asymmetric. If it moves too late, the weak yen and wages could push inflation durably above target. If it moves too early, it could stop exactly the shift from wages to spending it has been waiting for over years.
What to watch
On 30 September, preliminary industrial production and retail sales for August will show whether factory shipments keep growing. On 1 October the September Tankan will show whether companies keep their plans for 6.8% more investment. If plans are cut while profits are at a record, the detail on profits and investment becomes the main story. On 2 October, Tokyo CPI for September gives the first price signal for the month. August wages follow on 7 October and August household spending on 9 October. Together they will show whether the gap between pay and spending starts to close. On 23 October, national CPI for September will show whether core CPI is returning towards 2%.
On 30 October the BoJ decides on rates and publishes its new Outlook Report. The question is whether the bank will raise rates again before the end of the year.
The threshold for shifting the phase to acceleration stays the same as in our Q2 review: a positive contribution to GDP from both private consumption and business investment in Q3, with the composite PMI above 52. The first estimate of Q3 GDP comes out on 16 November. If real household spending remains negative on the year in August and September as well, the threshold will not be met. The threshold for a move down to stagnation is a composite PMI below 50 for two consecutive months, together with a new decline in production.
Closing
Japanese companies have never earned more, while Japanese households are spending less than a year ago. The engine is global demand for chips. The brake is expensive energy, a weak yen and an ageing wallet. The BoJ has already started tightening. The coming months will show whether money from the till reaches the machines and the wallet. For now we do not know which will come first: companies starting to invest, or rates rising far enough to put them off.
Sources
S&P Global, Japan Manufacturing PMI, August 2026, with final July comparisons
S&P Global, Japan Services and Composite PMI, August 2026, with final July comparisons
Trading Economics, Japan Composite PMI, final January 2026 reading
Cabinet Office, Q2 2026 GDP, second preliminary estimate, 8 September
Ministry of Finance, corporate statistics, April to June 2026
Ministry of Finance, foreign exchange intervention, 30 July to 26 August 2026
Bank of Japan, Time-Series Data Search: monetary base, M2, lending, USD/JPY
Reuters, the US Treasury explanation of the joint intervention
Associated Press, confirmation of US and Japanese participation
Not financial advice.
Liquidity Desk | liquiditydesk.org