

I. Frame
This issue covers the second quarter of 2026 for the eurozone, meaning April, May and June. Every major release for the period is out. The last release included is the Eurostat batch of 14 August 2026, which brought industrial production, employment, the second estimate of GDP and the trade balance for June. July data enters only as a reading on the momentum carrying into the third quarter, not as part of the quarterly account. The breakdown of GDP by component is not yet published and arrives with the third estimate.
II. Where the economy is
The phase is acceleration, and that is a change. The previous quarters described stagnation: growth around zero, business activity below the expansion line, and whatever optimism existed resting on industry alone. The second quarter broke that pattern, though not in the way the monthly surveys suggested while it was happening.
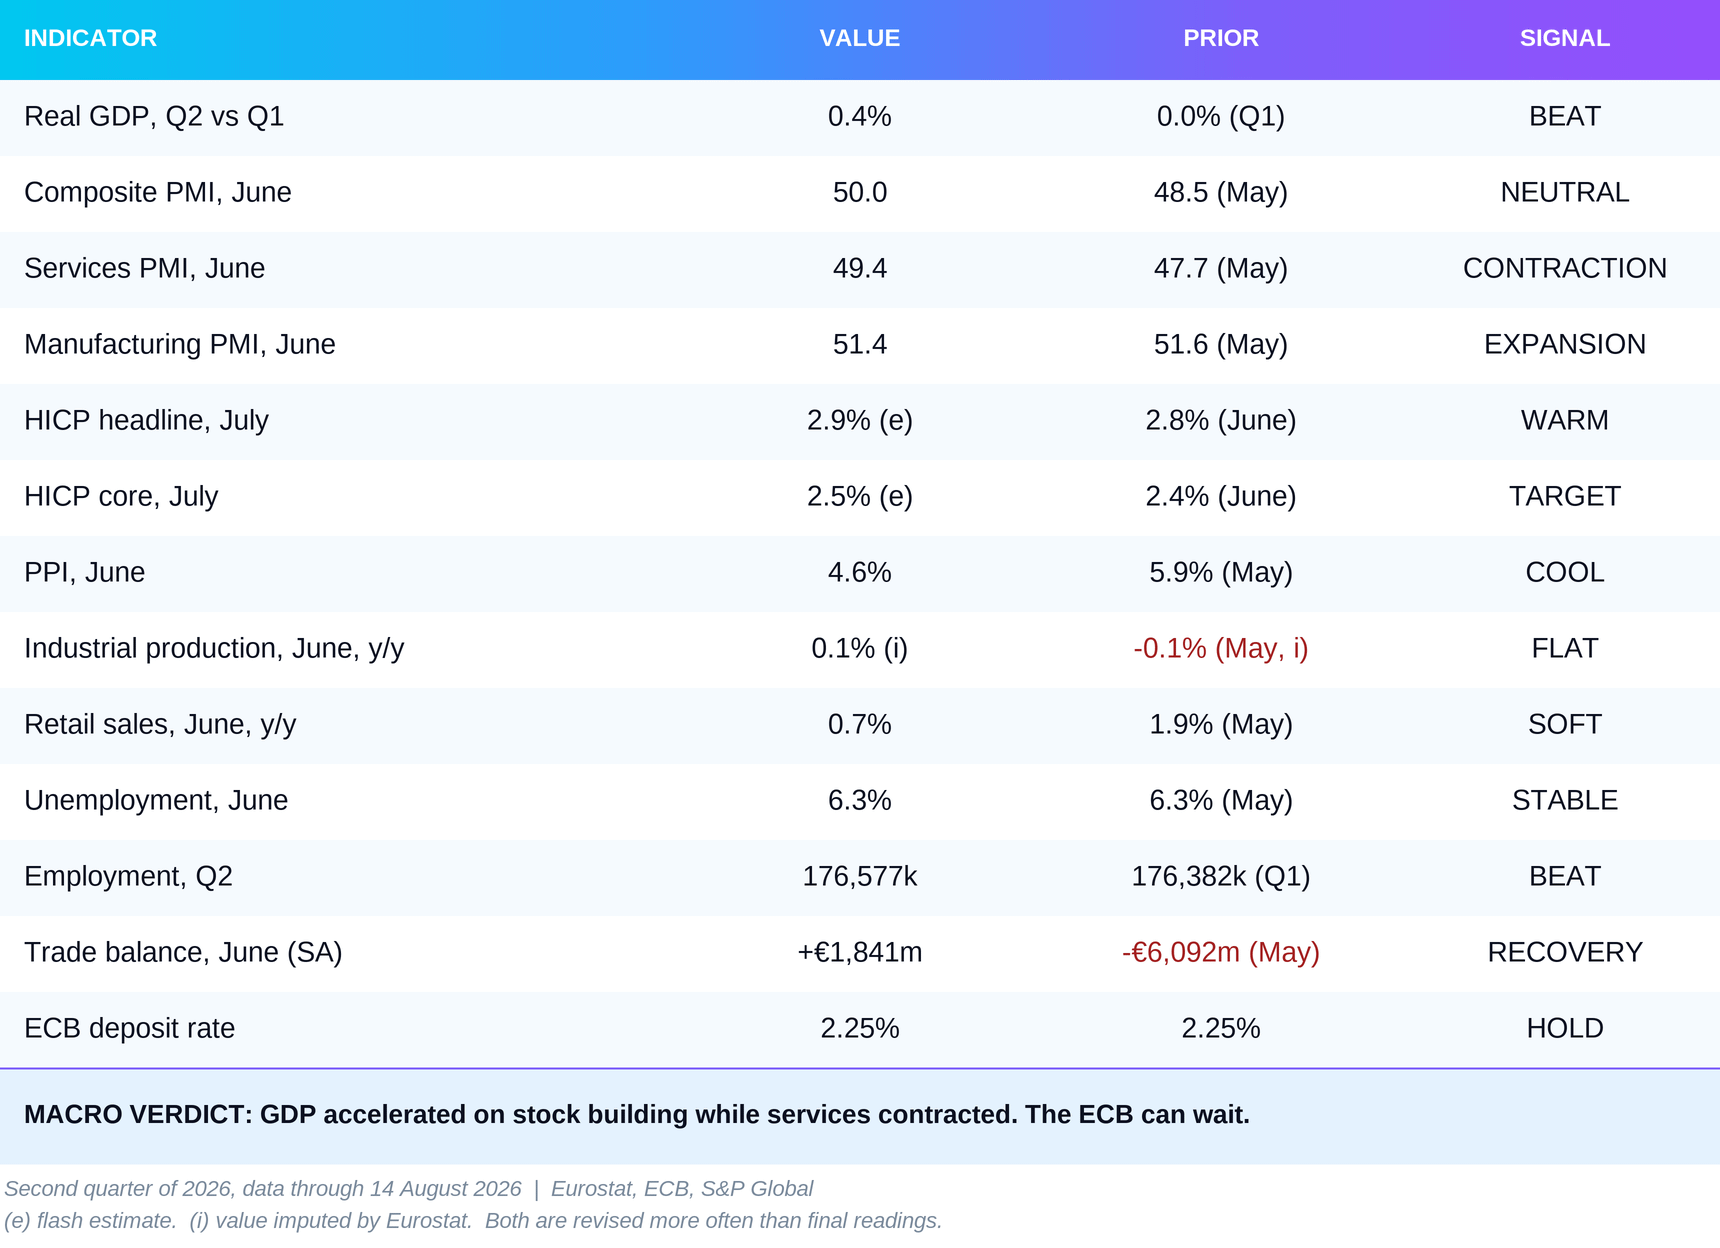
Real GDP grew 0.4% in the second quarter against 0.0% in the first. That is the strongest quarterly result since the start of 2025, and it is the number that carries the most weight, because it counts output that actually happened rather than sentiment about it.
The surveys through the same three months read weaker. The composite PMI, a monthly business survey where anything above 50 means growth, posted 48.8 in April, 48.5 in May and 50.0 in June. Two of the three months sat in contraction and the quarter averaged 49.1, down from 51.4 in the first quarter. S&P Global read its own April data as pointing to a 0.1% quarterly decline in GDP. The actual outcome was a 0.4% rise. That half point gap between the survey and the national accounts is the most interesting thing in this quarter, and the rest of this issue is largely about resolving it.
The engine is manufacturing, and its fuel has a shelf life. Factories expanded through the whole quarter, with the manufacturing PMI at 52.2 in April, its highest in close to four years, then 51.6 in May and 51.4 in June. But the April release is explicit about the cause: customers were ordering early and building safety stocks against expected price rises and supply shortages from the war in the Middle East. By May, S&P Global reported that new orders had already stalled. Stock building lifts output while it lasts, then stops.
The brake is services and the external sector. Services, roughly 70% of eurozone output, spent the entire quarter in contraction, reading 47.6 in April, a 62 month low, then 47.7 in May and 49.4 in June. The energy price spike hit margins in transport, hotels, restaurants and business services, the sectors that burn energy without producing it. Alongside that, the trade balance turned negative in March for the first time since the energy price crisis. The deficit widened to 6.1 billion euros in May before flipping back to a surplus of 1.8 billion in June. Cumulatively since the start of the year the surplus is 11.9 billion euros, far below last year’s levels.
The conclusion for policy follows from there. Growth is strengthening while inflation, which peaked at 3.2% in May, has eased since. Strengthening growth alongside decelerating inflation is a comfortable position for a central bank. The ECB raised the deposit rate once in June, to 2.25%, and has held since. It has no reason either to repeat the move or to rush into easing.
July, which falls outside the quarter, changes the composition rather than the direction. Services jumped to 51.7 and the composite index to 52.0, an eight month high. The sector that braked the second quarter is the one pulling in the third. That is momentum, not part of the account.
III. Core indicators
IV. The trajectory
Six months from January to June, with the direction of travel. July is included as an extra column because it shows the momentum the economy carries into the third quarter.
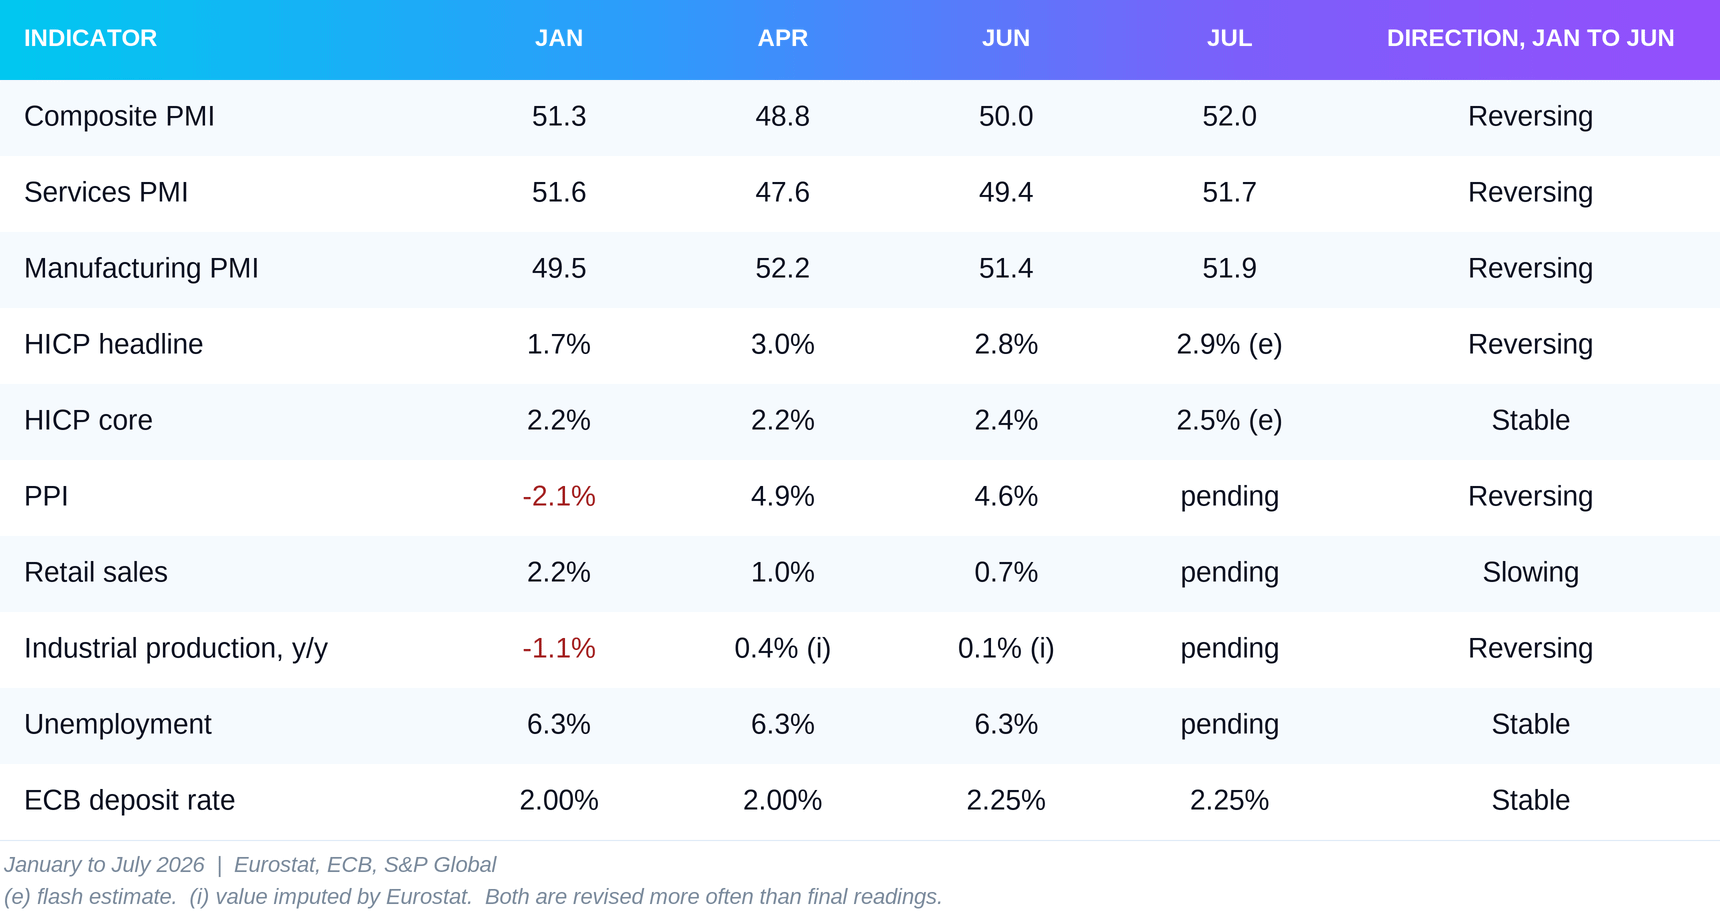
July falls outside the quarter. It is there for direction, not for the record.
Every PMI figure in the table is a final reading, taken from the S&P Global press releases. None of them is a preliminary estimate.
Three indicators carry the story. The rest are context.
The first is the composite PMI. The June reading of 50.0 sits above April’s 48.8, which is an improvement within the quarter. But it is below January’s 51.3, meaning the quarter did not recover what the shock took away. On the strict reading, the direction over three months is the opposite of the direction over six: a reversal. The July value of 52.0 shows that the reversal has now completed and, for the first time, exceeds the pre shock level. Ten weeks were enough for a full turn.
The second is HICP, the harmonised index of consumer prices, which is the eurozone’s official inflation measure. Headline inflation is reversing: higher than January (2.8% against 1.7%), lower than April (2.8% against 3.0%). The peak is behind us. But the reversal is almost entirely about energy. Core inflation, which strips energy out, moved between 2.2% and 2.4% from January to June with no direction at all. It took part in neither the acceleration nor the slowdown. That means the price relief depends on the pause in the Middle East holding, not on any change in domestic demand.
The third is retail sales. It is the only line that deteriorates at every step, from 2.2% in January to 0.7% in June. The consumer is not buying more. The consumer is buying less, every month, despite record low unemployment. The explanation sits in real disposable income: when headline inflation is 2.8% and negotiated wages are rising 2.5% on the latest quarterly reading, real incomes shrink. Households feel the difference.
V. The engine: manufacturing, and what it was made of
Manufacturing carried the quarter, and the reason it did is the most important thing in this issue.
The manufacturing PMI rose to 52.2 in April, its highest in close to four years, then eased to 51.6 in May and 51.4 in June. In April all eight countries covered by the survey posted readings above 50, the first time that had happened since mid 2022. On the face of it, a strong sector inside a weak economy.
The April releases say otherwise, in unusually direct language. Producers reported that customers were placing orders early to build safety stocks, expecting price increases and supply shortages from the war in the Middle East. Chris Williamson, chief business economist at S&P Global, wrote that the survey was “more a cause for alarm than celebration”, and pointed to the forward looking expectations index, which had sunk to its lowest in nearly a year and a half even as the headline number climbed. In the composite release the same week he was blunter still, writing that manufacturing resilience “has reflected stock building” and warning it would dampen growth in the months ahead as the stock build faded.
By May the pull forward had run its course. New orders, which in April had grown at the fastest rate in four years, stagnated outright, and S&P Global attributed the April record to advance purchasing in as many words. The May release also shows how much of the headline strength was mechanical rather than real. The manufacturing PMI is built from five sub indices, one of which is suppliers’ delivery times, and it enters inverted, because longer delays historically coincide with busier factories. In May delivery delays were the worst since June 2022, so that component pushed the index up. The other four all pushed it down. A reading of 51.6 describes a sector doing worse than the number suggests.
That distinction decides how much of the quarter carries forward. Output driven by stock building is output pulled forward from later quarters: it lifts the numbers while the stocking lasts and subtracts from them when it stops. It also explains the gap between the surveys and the national accounts. GDP grew 0.4% while the composite PMI averaged 49.1, and inventory accumulation is precisely the kind of thing that lands in GDP without being underlying demand.
The breakdown that would settle it is not out. Eurostat publishes GDP by component with the third estimate, so until then the contribution of inventories cannot be measured. Reading the 0.4% as clean demand growth is reading ahead of the data.
Services, the other 70% of the economy, worked against all of this. The services PMI read 47.6 in April, its lowest in 62 months, then 47.7 in May and 49.4 in June, contraction in every month of the quarter. The mechanism was energy: the Iran conflict, which escalated in March, pushed up fuel and electricity prices and hit margins in transport, hotels, restaurants and business services, the sectors that burn energy without producing it. A sector that size contracting is why the composite index sat below 50 for most of the quarter even with factories expanding.
The acceleration in corporate lending sits on both sides of the argument. Loans to non financial companies are growing 4.1% year on year as of June, up from about 2.5% a year earlier, the fastest pace since mid 2023. Firms borrow either to invest or to build stock. Under the reading above, the second is at least as likely as the first, which makes the credit numbers a confirmation of the stock building rather than independent evidence of expansion. Without a breakdown by purpose of loan, the two cannot be separated.
Then, in July, the two sectors swapped roles. Services jumped to 51.7, ending three months of decline, while manufacturing held at 51.9. For the first time since the war began, both sides of the economy were expanding at once. The trigger was the same one working in reverse: the June ceasefire brought energy prices down and margins in services recovered.
That is the better news in this issue, and it comes with a warning attached from the same source. In the July release S&P Global notes that new orders in services are coming mainly from domestic clients and that backlogs, meaning work already booked and waiting to be done, are being run down. Williamson adds that the conflict has flared up again since the ceasefire and that risks to growth are returning. The engine that ran in the second quarter was defensive stock building. The one that started in July runs on a geopolitical pause. Neither is the same thing as demand.
VI. The brake: the external sector
External trade is the other side of the same story, and it tells the opposite one.
In March 2026 the eurozone trade balance with the rest of the world turned negative for the first time in a long while. The deficit was small, around 800 million euros, but the fact itself was unusual for a bloc that traditionally exports more than it imports. In April the balance was effectively zero. May brought the hit: a deficit of 6.1 billion euros, the widest in more than a year. June brought a partial recovery, with a surplus of 1.8 billion.
Cumulatively from January to June the surplus is 11.9 billion euros. For the same six months of 2025 it was 83.4 billion, and in 2024 it was 91.9 billion. The external buffer has shrunk to roughly one seventh of what it was a year ago, a fall of 71.5 billion euros in twelve months.
The split between the two sides shows where it went.
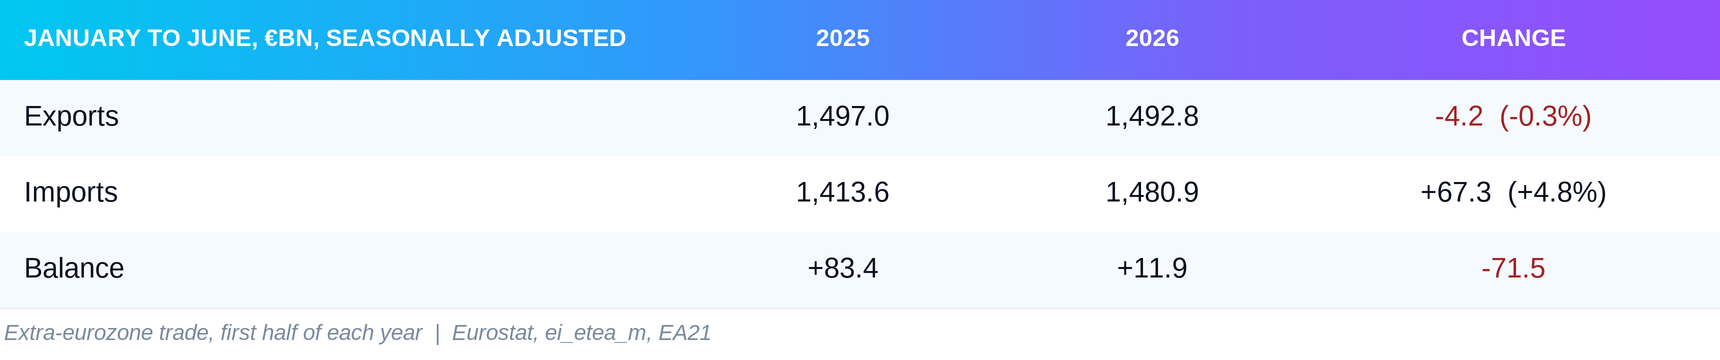
Exports are frozen: down 4.2 billion over half a year, three tenths of one percent. Imports jumped by 67.3 billion. The two differences add up exactly to the 71.5 billion of lost surplus, and almost all of it sits on the import side. The eurozone is not selling less to the world. It is paying more for what it buys from it.
The size of the brake is measurable. Net exports are a component of GDP, and when imports grow faster than exports that difference subtracts from growth. Without the breakdown by component for the second quarter, which Eurostat has not yet published, the exact contribution cannot be calculated. But the shift from surplus to deficit is large enough to be visible without it.
The mechanism has two parts. The first cause is energy. When oil and gas prices spiked in March and April, the eurozone’s energy bill rose sharply. The eurozone imports almost all of its energy, and higher prices automatically increase the value of imports without increasing the volume. That part is cyclical in origin, tied to the conflict, and reverses when prices fall. The June improvement in the balance is a sign that this is exactly what is happening.
The second cause is more troubling. Data from Trading Economics for May show that the surplus in machinery and vehicles, traditionally the eurozone’s strongest category, has fallen from 12.4 to 4.4 billion euros year on year. Chemicals show a similar picture: from 23.8 to 18.4 billion. These categories do not move with the price of oil. They reflect the competitiveness of European industry on world markets. A decline in them is a structural signal, not a cyclical wobble.
The currency market has seen it. The euro weakened sharply in June, the month of the widest deficit, falling to 1.1417 dollars per euro. The partial recovery in the balance brought the rate back to 1.1519 in July.
The distinction matters. If the brake is purely about energy, it lifts when prices fall. If it is also about competitiveness, it stays until European producers win back market share. The June data show that the energy part is already reversing. The structural part is not.
VII. Prices
Inflation is the second axis that determines what a central bank can and cannot do. For the eurozone that axis is more complicated than the headline numbers suggest.
Headline HICP inflation, the measure the ECB watches as its primary gauge, reached 3.2% year on year in May. Since then it has eased to 2.8% in June and 2.9% in July, with the July figure a preliminary estimate. The direction is down, but the pace of the slowdown is slow: around three tenths of a percentage point over two months. Inflation is not falling, it is sliding.
Core inflation, which strips out energy, food, alcohol and tobacco, is the more informative measure because it removes the noise from swings in the oil price. It stands at 2.5% in July, almost unchanged from 2.4% in February. The core measure took part in neither the May spike nor the June cooling. It has stood still for half a year. For the ECB that is good news, because it means underlying price pressure is not building. But it also means it is not fading.
The gap between producer prices and consumer prices shows where inflation is heading a few months out. PPI, the producer price index, which measures what factories charge before goods reach the shop, peaked at 5.9% year on year in May and fell to 4.6% in June. The turn is abrupt, almost a point and a half in a single month, and it is driven by the same mechanism that drives everything else here: cheaper energy after the June ceasefire. Only six months earlier, in December 2025, PPI was negative at minus 2.0%. The entire price cycle, from deflation at the factory gate to 6% inflation and back down, played out in half a year. That amplitude speaks to an external shock rather than domestic pressure.
The conclusion from the three measures together is this. The energy shock lifted headline inflation and PPI, but never entered the core. Now the shock is fading and headline inflation is slowing. The core sits near the ECB’s 2% target. Business margins, as far as the gap between PPI and HICP allows one to judge, are not under the kind of pressure that forces costs onto the consumer. The price picture does not stop the ECB from waiting.
The risk is single and specific: a fresh escalation of the conflict that repeats the March spike. That risk is not managed with interest rate policy.
VIII. The detail that gets underrated: the consumer is not feeling the recovery
One number in the July confidence data deserves separate attention, because it contradicts the rest of the picture.
Consumer confidence in the eurozone, measured by DG ECFIN, the European Commission’s economics directorate, fell to minus 5.3 points in July, its fourth consecutive monthly decline.
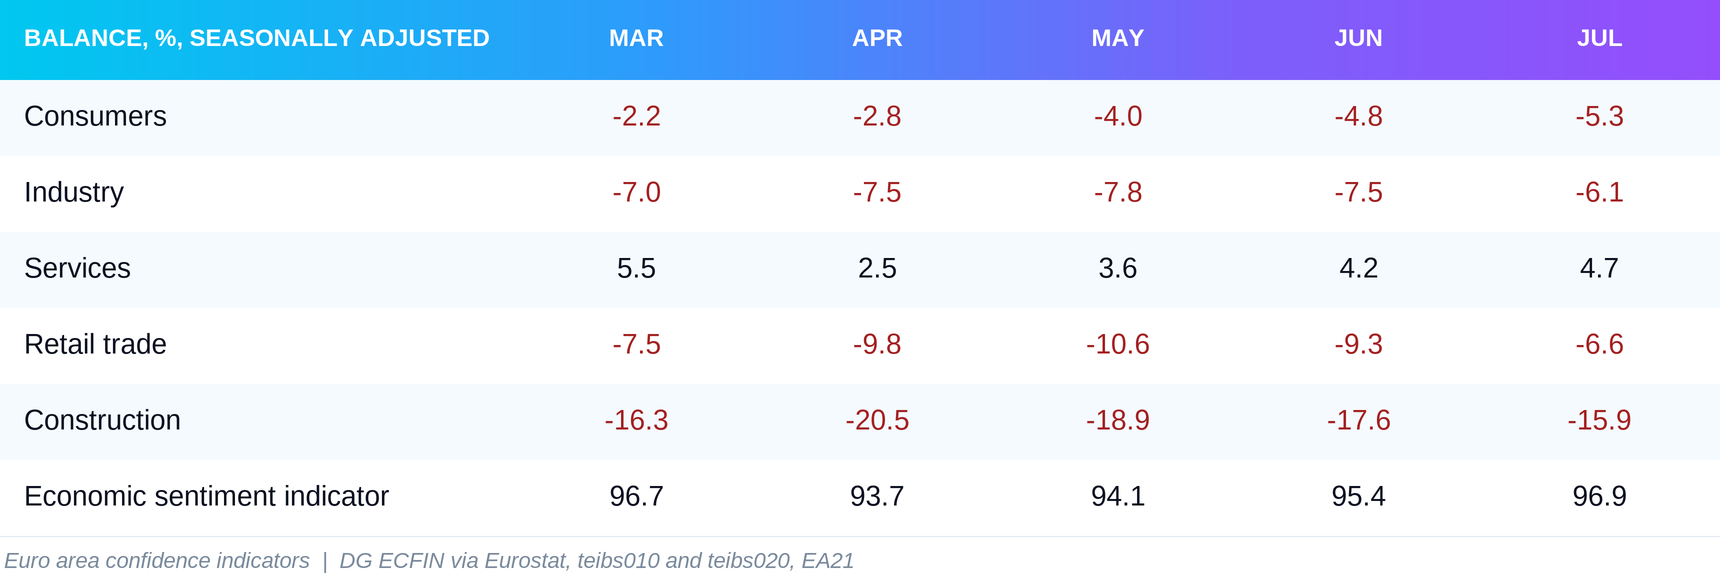
The table shows why that matters. Every business gauge bottomed out in April or May and has been recovering since. Industrial confidence turned at minus 7.8 in May, services at 2.5 in April, retail at minus 10.6 in May, construction at minus 20.5 in April. The economic sentiment indicator troughed at 93.7 in April and is back to 96.9, within two tenths of its March level. Consumer confidence has no trough. It fell in every one of those months.
Business sees the improvement. The consumer does not.
The explanation is real income. Headline inflation of 2.9% exceeds negotiated wage growth of 2.5% on the latest available quarterly reading. The gap is small, but it points the wrong way: purchasing power is shrinking slowly. Add energy bills that, even after retreating from the May peak, remain 10.0% higher than a year ago, and it becomes clear why the household reacts differently from the firm.
This divide matters for two reasons. First, it explains why retail sales fall every month despite record low unemployment. Second, it means the ECB can be patient not only because inflation is fading, but because consumer demand is not the source of price pressure. There is nothing to cool that has not already cooled.
IX. What this means
The conclusion for monetary policy does not follow from growth on its own. It follows from growth and inflation together, because the same growth rate means different things depending on whether prices are rising or falling.
The growth and inflation map, plotting the last four quarters, shows the trajectory.
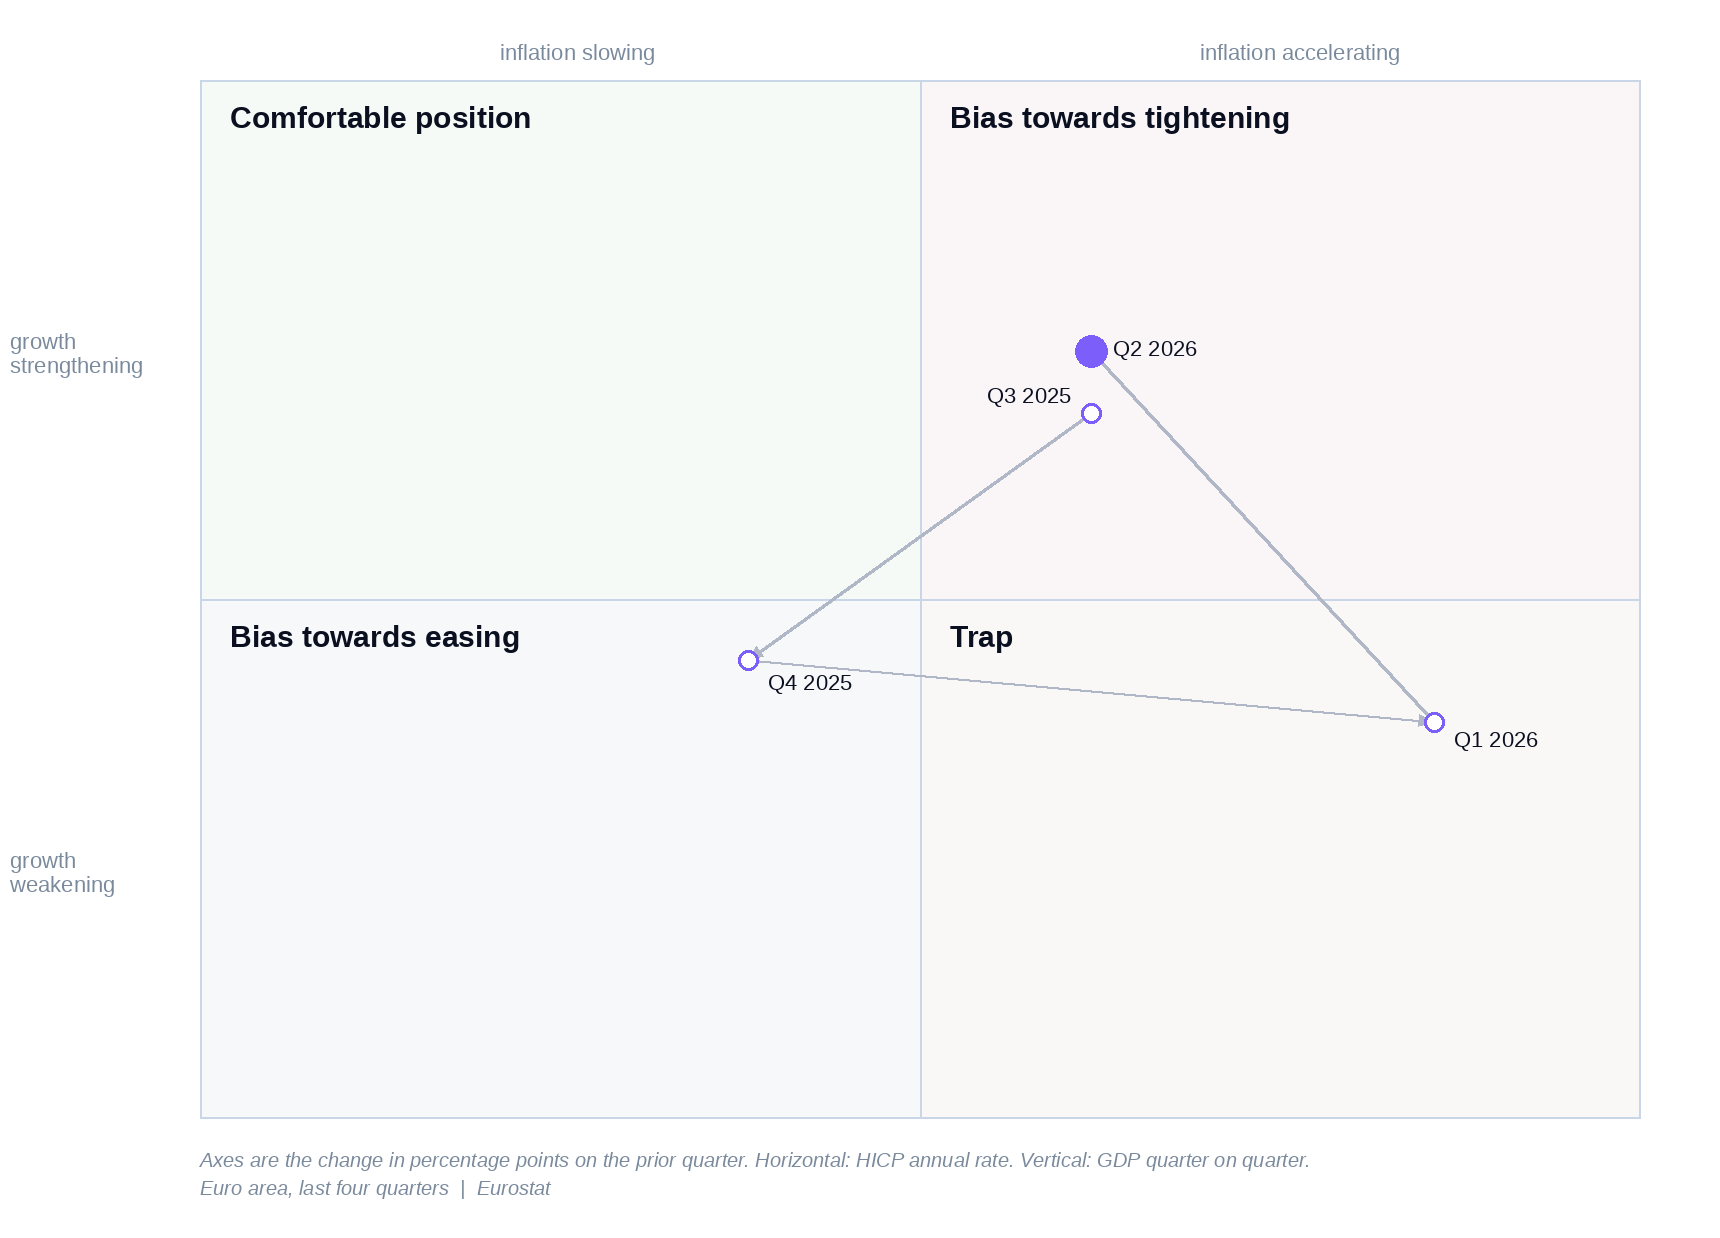
In the fourth quarter of 2025 the eurozone sat near the centre: neither growth nor inflation was moving. In the first quarter of 2026 the economy entered the trap quadrant: growth weakened to 0.0% while inflation turned up as the Iran conflict hit energy prices. The trap is the most awkward position, because every central bank decision carries a cost: raising rates hits already weak growth, cutting them feeds inflation.
In the second quarter the economy left the trap upward and to the right, into the quadrant that leans toward tightening: growth strengthened while inflation, on a quarterly average, still sat higher than the previous quarter.
But a quarterly average hides what happens inside the period. Inflation peaked at 3.2% in May and has been falling since. By July it is 2.9%. If that direction holds, the next reading shifts the point to the left, into the comfortable quadrant: growth with decelerating inflation.
That is where the ECB sits now. It raised once in June, after 14 months without a change, and has held at 2.25% since. Three things explain why it is in no hurry: core inflation is 2.5%, close to target; consumer demand is not feeding price pressure; and the energy shock that lifted headline inflation is external and is not treated with interest rate policy.
Liquidity conditions confirm that policy is working without further intervention. Corporate lending is growing 4.1% year on year, the fastest since mid 2023. Household lending is accelerating more slowly, to 3.0%. The M3 money supply is growing 3.3%. The yield on the ten year German Bund rose from 2.74% in February to 3.07% in July, with a dip to 2.96% in June during the pause in the Middle East. The market is tightening the long end of the curve by itself. Even so, credit is flowing: companies and households are borrowing more, not less, which means the higher yield is not choking the economy.
For an ordinary person this means the following. Loan rates will probably stay stable at least through the end of the year. Prices in the shop are no longer rising faster than they were a month ago. But they are not falling either, and wages are not catching up. The recovery is real, but it shows up in the data rather than in the wallet.
X. Risks in both directions
Upside. If the pause in the Middle East holds and energy prices keep falling, margins in services keep improving and consumer inflation moves closer to the ECB’s target. Real incomes turn positive, consumption picks up and retail sales stop falling. In that scenario the acceleration phase deepens and consolidates. ZEW is already pricing it: expectations for the eurozone have jumped from minus 20.4 in April to plus 23.4 in July.
Downside. A fresh escalation of the conflict is the shortest and fastest route down. The March shock showed how quickly the picture can turn: two months were enough to flip the composite PMI from 50.7 to 48.5. The second risk is structural: if the loss of competitiveness in machinery and chemicals is not temporary, the trade balance keeps deteriorating regardless of energy prices. The third is the consumer: if real incomes stay negative, households keep trimming consumption, and retail sales keep falling every month.
XI. What to watch
Core HICP inflation for July, final reading, around 19 August. If it holds at 2.5% or falls, the door stays open for the ECB to keep holding. If it jumps above 2.7%, the ECB gains an argument for another increase.
PPI for July, around 2 September. A continued decline from the May peak of 5.9% confirms that price pressure along the chain is easing. A move the other way refutes it.
Composite PMI for August, flash reading, around 22 August. If it holds above 50, the acceleration is confirmed. If it drops below 50, the July reading may have been a one off effect of the ceasefire.
Retail sales for July, 4 September. A sixth consecutive month of slowing would confirm that the consumer is not taking part in the recovery.
Negotiated wages for Q2 2026, from the ECB, expected in September. If they exceed core inflation, real incomes turn positive and the case for consumer weakness collapses. If not, it stands.
The threshold for a change of phase: two consecutive months of the composite PMI below 50 return the eurozone to stagnation.
XII. Closing
The eurozone has left stagnation behind. It did so on the back of factories building stock against a war, while services contracted and the external balance turned negative, which is a strange way to grow and not a durable one. July suggests the composition is now improving, with services back in expansion and both sides of the economy growing at once. What we do not yet know is whether the consumer will follow, or keep standing aside.
Sources
Eurostat dissemination API: GDP (namq_10_gdp), HICP (prc_hicp_minr), PPI (sts_inppd_m), industrial production (sts_inpr_m), retail sales (sts_trtu_m), construction (sts_copr_m), unemployment (une_rt_m), employment (namq_10_a10_e), economic sentiment indicator (teibs010), sectoral confidence (teibs020), trade balance (ei_etea_m). Geography: EA21.
ECB Data Portal: M3 money supply (BSI), loans to households and non financial corporations (BSI), negotiated wages (INW), long term government bond yields (IRS).
DG ECFIN Business and Consumer Surveys: consumer, industrial, services, retail and construction confidence, disseminated through Eurostat.
FRED, Federal Reserve Bank of St. Louis: ECB deposit facility rate (ECBDFR), ECB main refinancing rate (ECBMRRFR), EUR/USD (DEXUSEU).
S&P Global PMI: eurozone composite, services and manufacturing PMI press releases, January to July 2026, all final readings.
ZEW Leibniz Centre for European Economic Research: monthly indicator of economic sentiment press releases, January to July 2026.
Trade balance breakdown by product category for May, from Trading Economics.