

The frame
This is our August review of the US economy. All the main data for the month have now been released, and the last one included is the trade balance published on October 6. The annual update of the national accounts on September 30 rewrote part of the history. Every comparison here therefore uses the current versions of the series, not the numbers printed in our July issue.
Where the economy stands
The phase remains Acceleration. The car from our July issue is still picking up speed, but no longer in the same way. What is changing is what drives it.
The engine has moved from production to the consumer. Real consumer spending rose 0.6% in the month, retail sales 1.1%, and business activity in services reached 61.7 on the ISM survey. Industrial production, however, stalled at 0.0%, and manufacturing output shrank 0.3% after seven consecutive monthly gains.
The brake is in incomes. Real disposable income, meaning income after taxes and inflation, did not change, while the saving rate fell from 4.6% to 4.1%. Americans are increasing their spending faster than their incomes are growing and covering the difference out of savings. Hiring remains narrow, and housing is squeezed by mortgage rates around 6.67%.
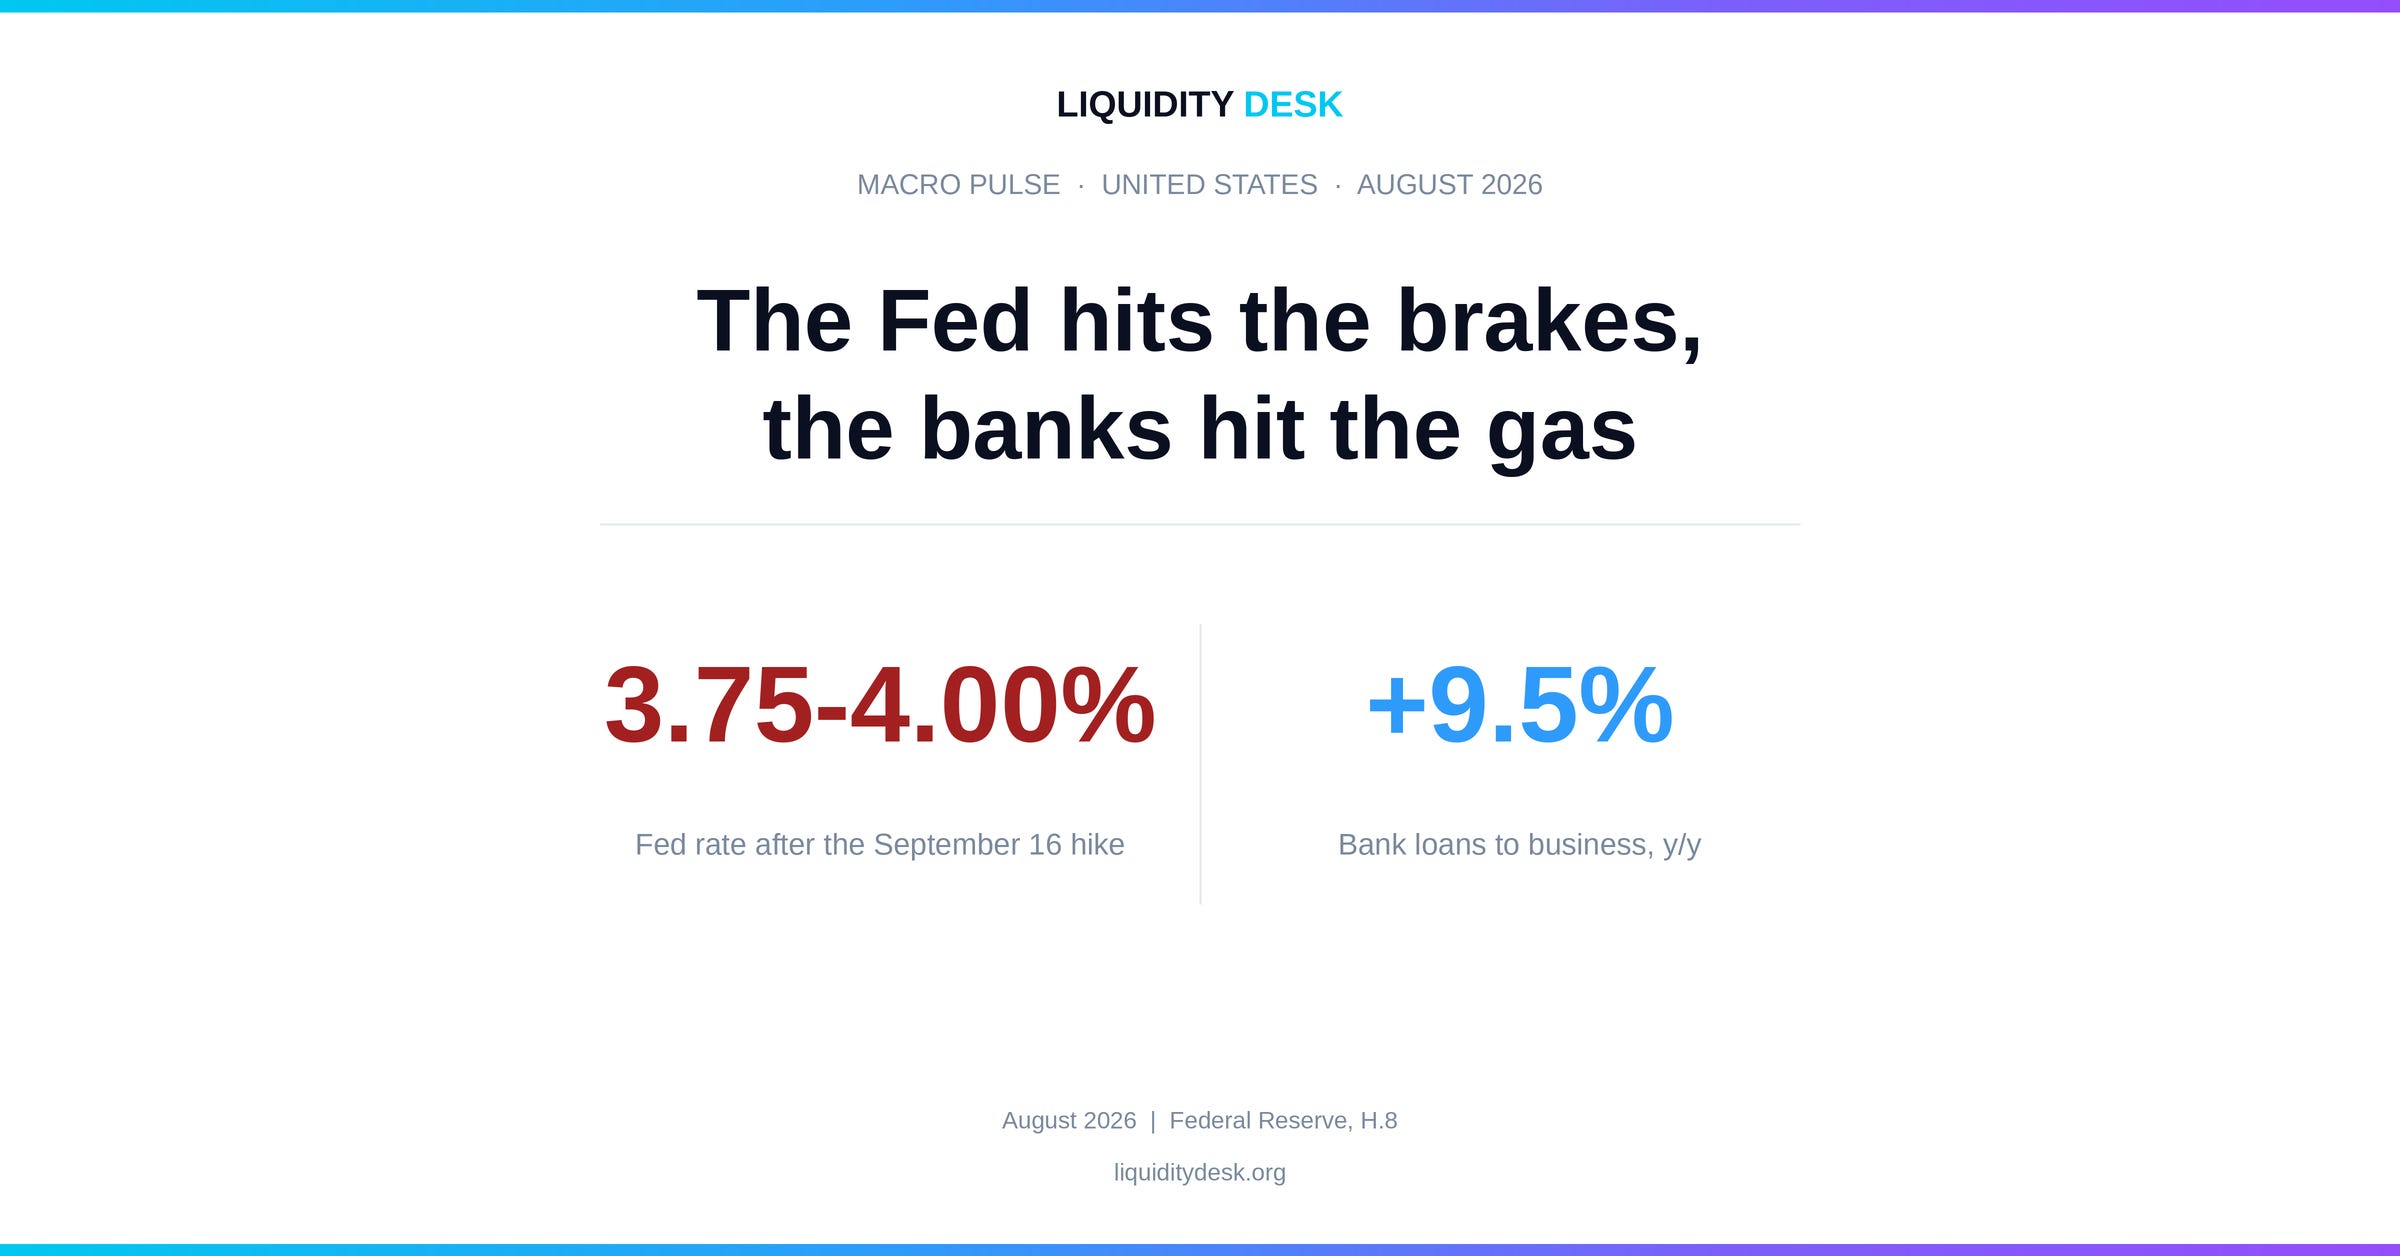
Prices leave the Federal Reserve no room. Headline inflation is 3.4%, core PCE 3.0%, and producer prices accelerated to 5.4%. On September 16 the Fed raised its rate to 3.75-4.00%, unanimously.
Here is the paradox of the month. The Fed is pressing the brake, but the banks are hitting the gas. Bank loans to businesses grew by $46.7 billion in August alone. The bias toward tightening will stay until that gap closes.
Core indicators
The trajectory
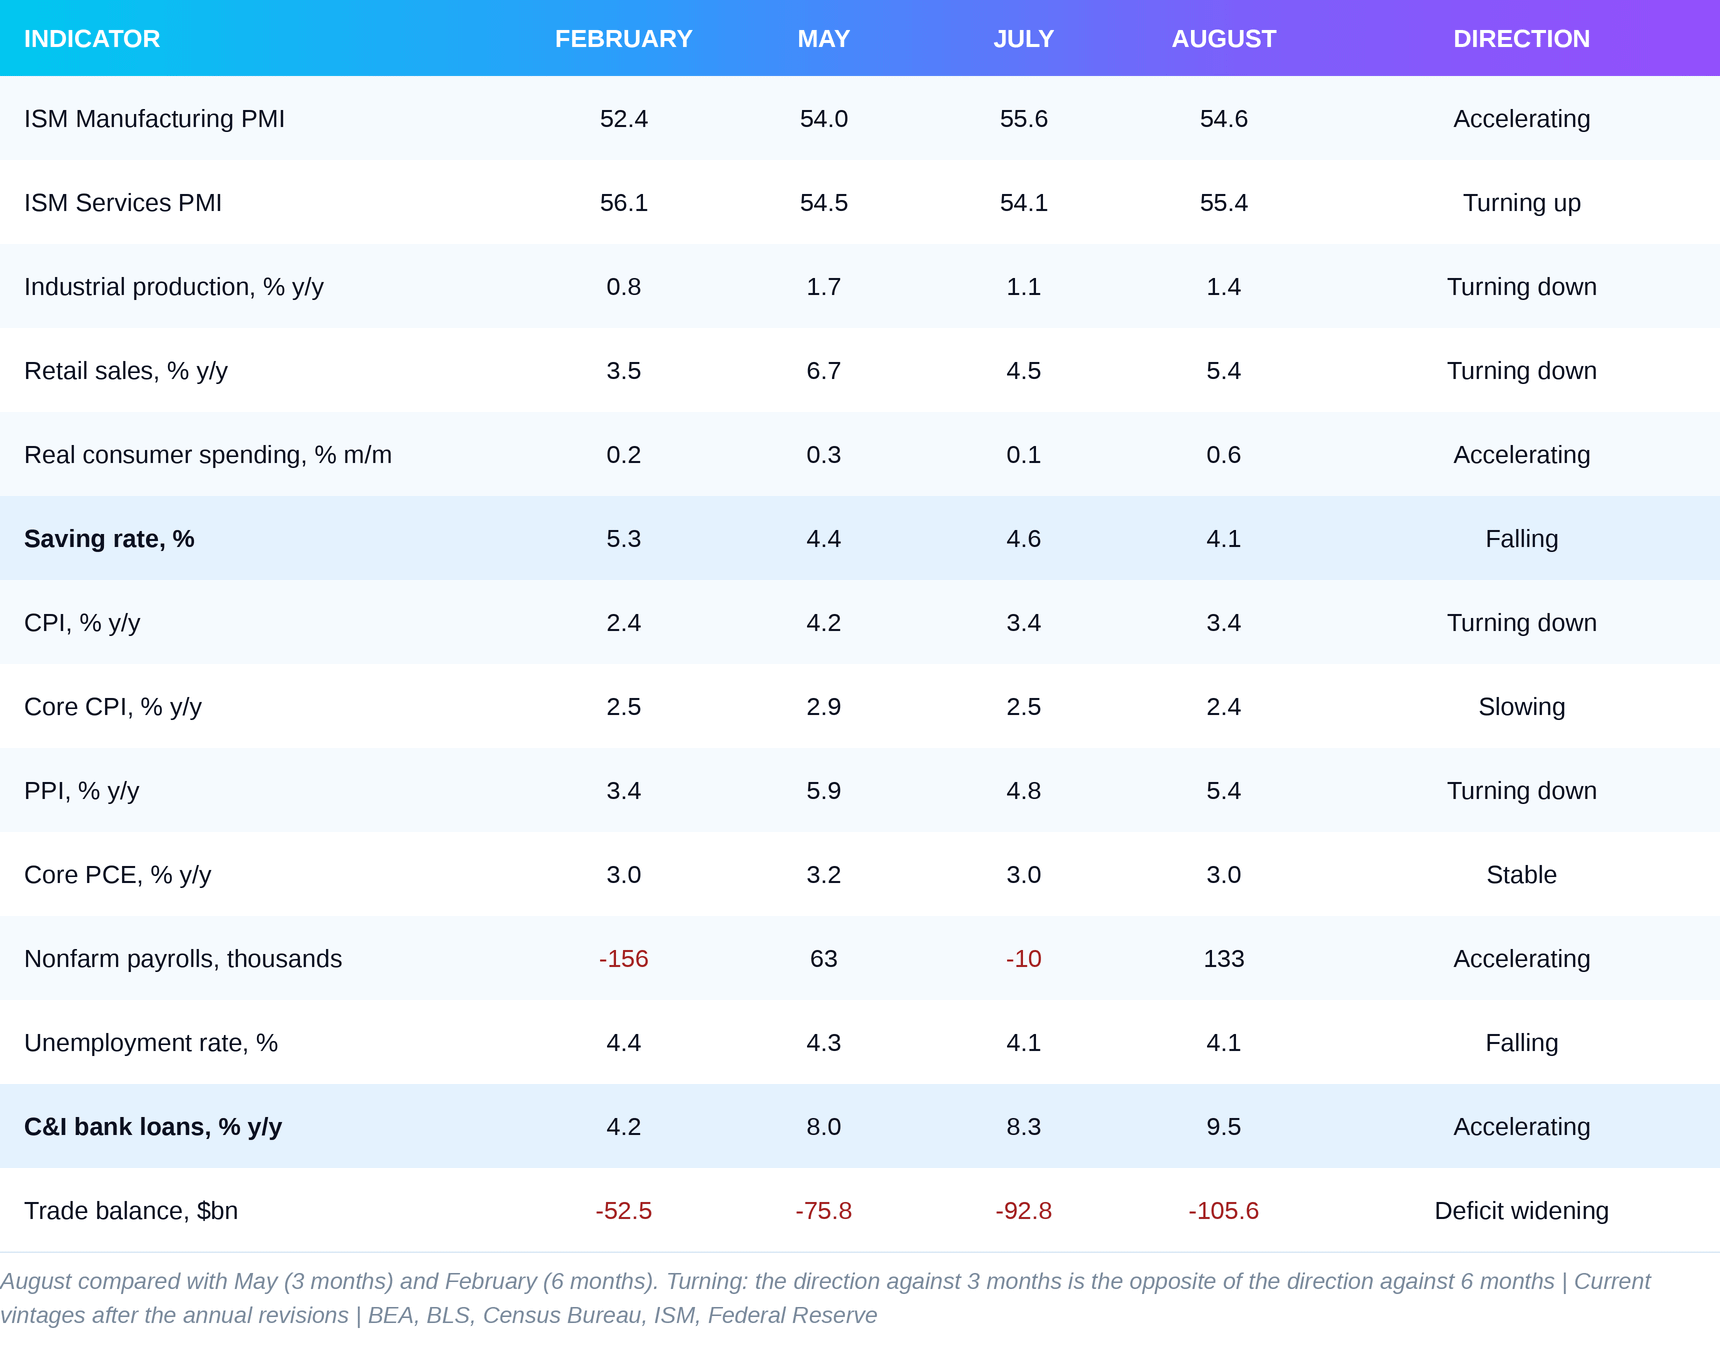
Three indicators carry the story of the month.
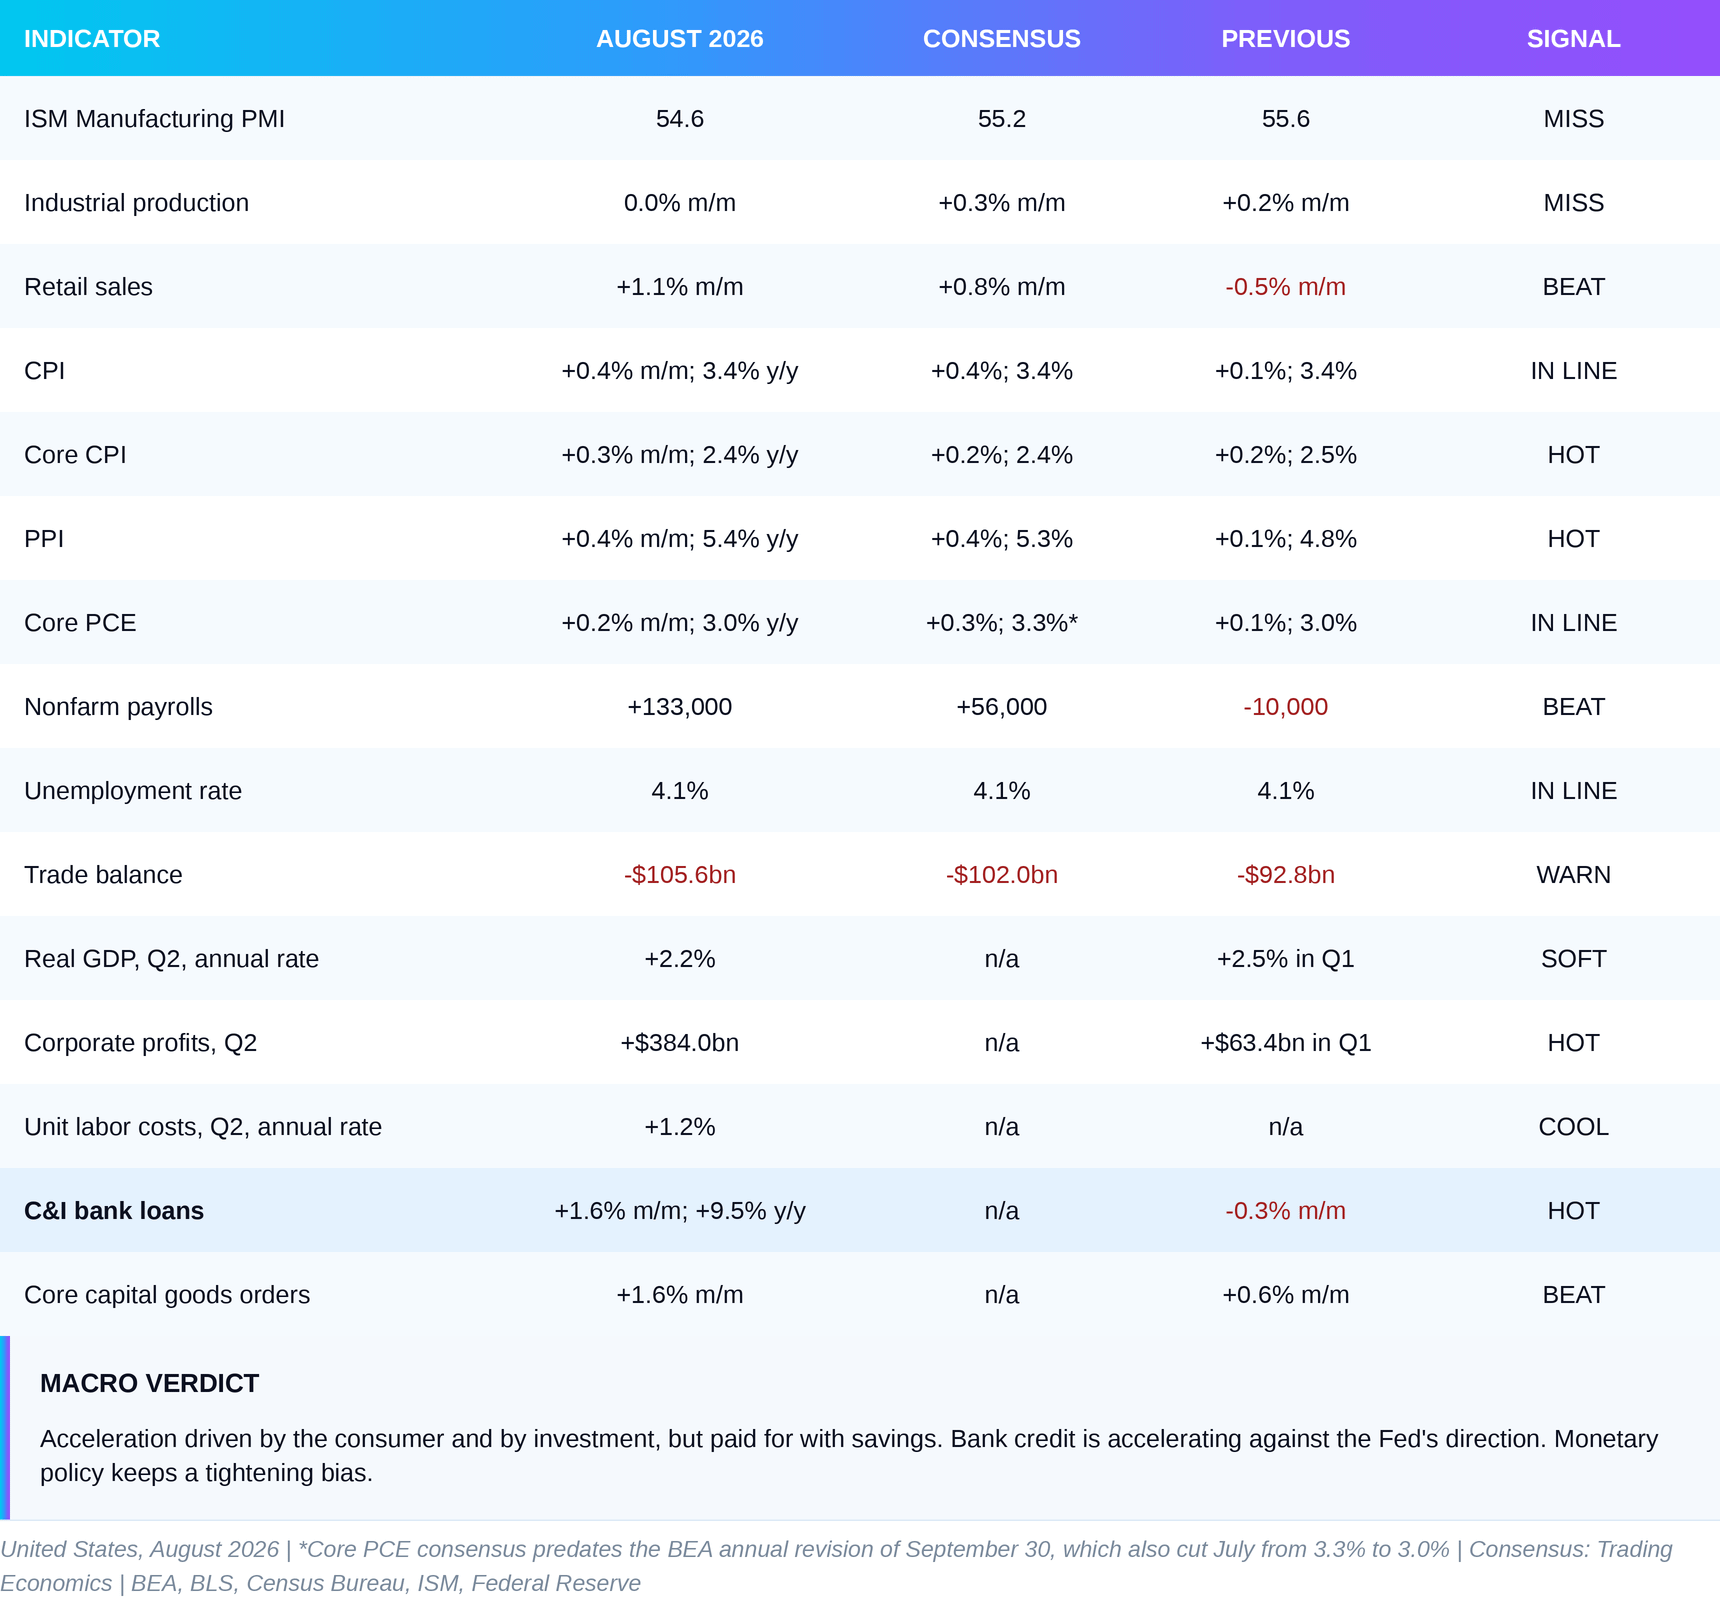
The first is the saving rate. It is at its lowest level of the year, down from 5.6% in January to 4.1% in August. This is the line that explains the acceleration in spending. Real household spending is 2.6% above a year ago. Real disposable income is only 1.3% higher. The gap between those two numbers is covered by savings.
The second is credit to business. The annual growth rate of commercial and industrial loans accelerated from 4.2% in February to 9.5% in August, the fastest of the year. This is the indicator that runs against the Fed. More on it below, in the detail being underestimated.
The third is producer prices. They are slower than at the May peak but accelerating again against July, and they remain 2.0 points above consumer prices. The trajectory rule classifies this as a turn down. The direction is not reassuring, though, because the July relief did not last even a month.
The turns in retail sales and industrial production have the same shape. Against February they are stronger, against May weaker. That is not a decline. It is an economy that accelerated sharply in the spring and is now driving at a steady, if lower, speed.
Payrolls show the biggest move on paper, from a loss of 10,000 to a gain of 133,000. Here the mechanical rule misleads, because February was an abnormally weak month. The average gain for June to August is 51,000 a month, and for the past 12 months 45,000. More on this in the brake.
The engine
The engine in August has two parts. The bigger one is the consumer. The more durable one is investment.
Consumer spending is about two thirds of the US economy, so every move in it matters. In August real household spending rose 0.6%, the strongest month of the year. Nominal spending increased 0.9%. The gain was broad: both goods and services contributed. Retail sales rose 1.1% against an expected 0.8%, and business activity in services on the ISM survey jumped from 59.1 to 61.7, with new orders at 60.9.
How big is the engine really? In terms of pace, smaller than it looks. July was weak, with real spending up only 0.1%. The average for the two months is about 0.3% a month, slightly above the 0.24% average for the first half of the year. August is mainly catching up, not a new gear. But it also means something else. The consumer has not given up, despite mortgage rates around 6.7%, gasoline up 3.9% in a month, and rising interest rates.
Is it sustainable? This is the weak point, so it is covered under the brake. In short: spending is growing 2.6% a year with income growing 1.3%. That can continue only as long as there is something to draw on.
The second part is investment, and it is more durable. Orders for core capital goods, meaning machinery and equipment excluding defense and aircraft, rose 1.6% to $87.6 billion. They are 14.1% above last August. Imports of capital goods increased by $6.2 billion, of which $2.4 billion were semiconductors. Output of business equipment is 7.1% above a year ago, although it fell 0.5% in the month.
That equipment also leaves a trace in trade. The trade deficit widened from $92.8 billion to $105.6 billion, more than the expected $102 billion. Imports rose 4.3% and exports 1.4%. Part of the difference is equipment for the investment cycle. Another part is raw materials, including $3.3 billion of oil and $3.1 billion of nonmonetary gold. Gold passes through trade without being consumption or investment in the usual sense, and the statistics adjust for it when calculating GDP. The deficit is once again the invoice for investment, but this time it also contains gold. These nominal flows do not directly give the contribution of trade to growth in the third quarter.
The BEA annual update strengthened this part of the story. Real final sales to private domestic purchasers, which combine consumer spending and private investment, grew at a 4.6% annualized rate in the second quarter. Before the revision the figure was 4.2%. Headline GDP is 2.2%. The private machine is running more than twice as fast as the headline number.
Corporate profits supply the fuel. Profits from current production rose by $384 billion at an annual rate in the second quarter, to $4.71 trillion. Companies with cash flows like these can invest even at higher interest rates. And they are not alone: the banks are lending them more.
What would stop the engine? For the consumer, the answer is exhausted savings or a weaker labor market. For investment, the answer is a repricing. Fed Governor Michael Barr put it this way on September 29: if investors do not see the expected returns from building AI infrastructure, the readjustment of investment will hit growth both directly and through wealth. So far the orders say the opposite.
The brake
The brake has three parts: income, labor and housing. The first matters most, because it decides how long the engine can keep running.
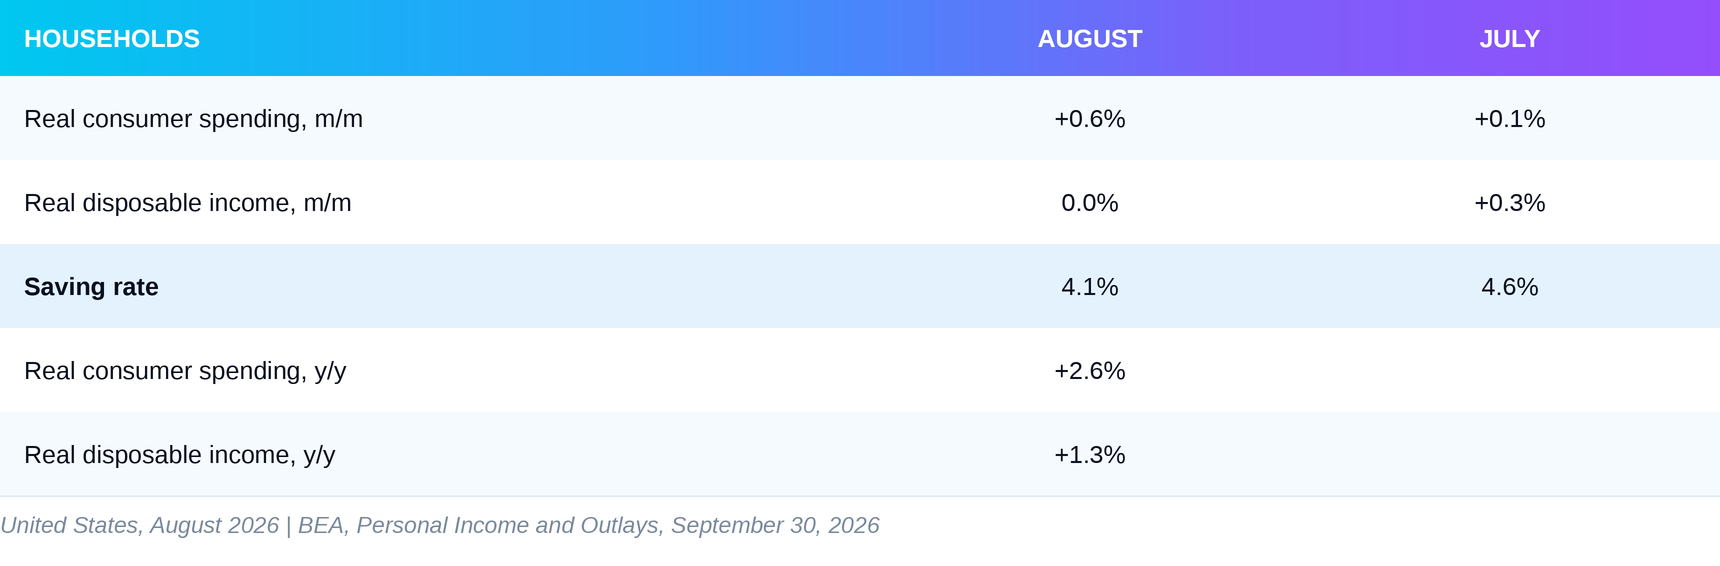
Nominal personal income rose 0.2% and disposable income 0.3%. Prices ate the entire gain. Households covered the difference by setting aside less. This is growth borrowed from the months ahead. Not through new credit, but through savings that would otherwise have been kept for later.
Is this brake structural or cyclical? It is cyclical. The saving rate cannot fall forever. At 4.1% it is 1.5 points below January. When it stops falling, spending will have to grow at the pace of income. That is roughly half the current pace.
There is also a distribution that the aggregates hide. In the minutes of its September meeting, the Fed notes that rising stock prices support spending mainly among higher-income households. Lower- and middle-income households feel energy prices more, and energy is up 16.3% over the year. The average blends the two groups.
The second element is labor. August payrolls were revised from 162,000 to 133,000. That is still above the expected 56,000. The average for June to August, however, is 51,000 a month, and for the past 12 months 45,000. The composition remains narrow. Restaurants and local government education together added 83,000, or 62.5% of the monthly gain. The information sector lost 18,000 jobs, and professional and business services 5,000.
There is good news too. Labor force participation rose from 61.4% to 61.6%, and the labor force grew by 683,000 people. Unemployment remained at 4.1%. That weakens our July concern that unemployment was falling only because people were leaving the labor market.
The August JOLTS data, the official survey of job openings and labor turnover, add weight. Job openings fell from 7.34 million to 7.08 million. They are now almost exactly equal to the number of unemployed, 7.03 million. One open job for every person looking for work. The market is no longer overheated, but it is not yet weak. The hiring rate is 3.3%, the quits rate 1.9%, and the layoffs rate 1.0%. This is a market with low hiring and low firing. People are not losing their jobs, but they also find it hard to get a new one.
Is this part structural? Partly. Average hourly earnings growing 3.1% a year with inflation at 3.4% show that labor is not a source of inflation. The Fed minutes describe unusually low labor market churn and strong demand for AI-related specialists. That gap between the workers in demand and everyone else is more structural than cyclical.
The third element is housing. Housing starts fell 2.6% and permits 2.1%. New home sales rose 6.4%, but the uncertainty around that estimate is plus or minus 19.5 points, so there is no turn to speak of. The average 30-year mortgage rate was 6.67% in August. Private residential construction spending rose 1.1%, but the statistical uncertainty is large here as well. The new homes for sale would now run out in 8.5 months at the current sales pace, compared with 9.0 months in July. The market is not collapsing. It is standing still and waiting for cheaper money.
This brake is cyclical and sensitive to interest rates. It is also where the Fed’s tightening shows most clearly. After the end of the month it tightened further: on October 1 the mortgage rate was already 7.28%.
Prices
Prices in August say three different things depending on where you look.
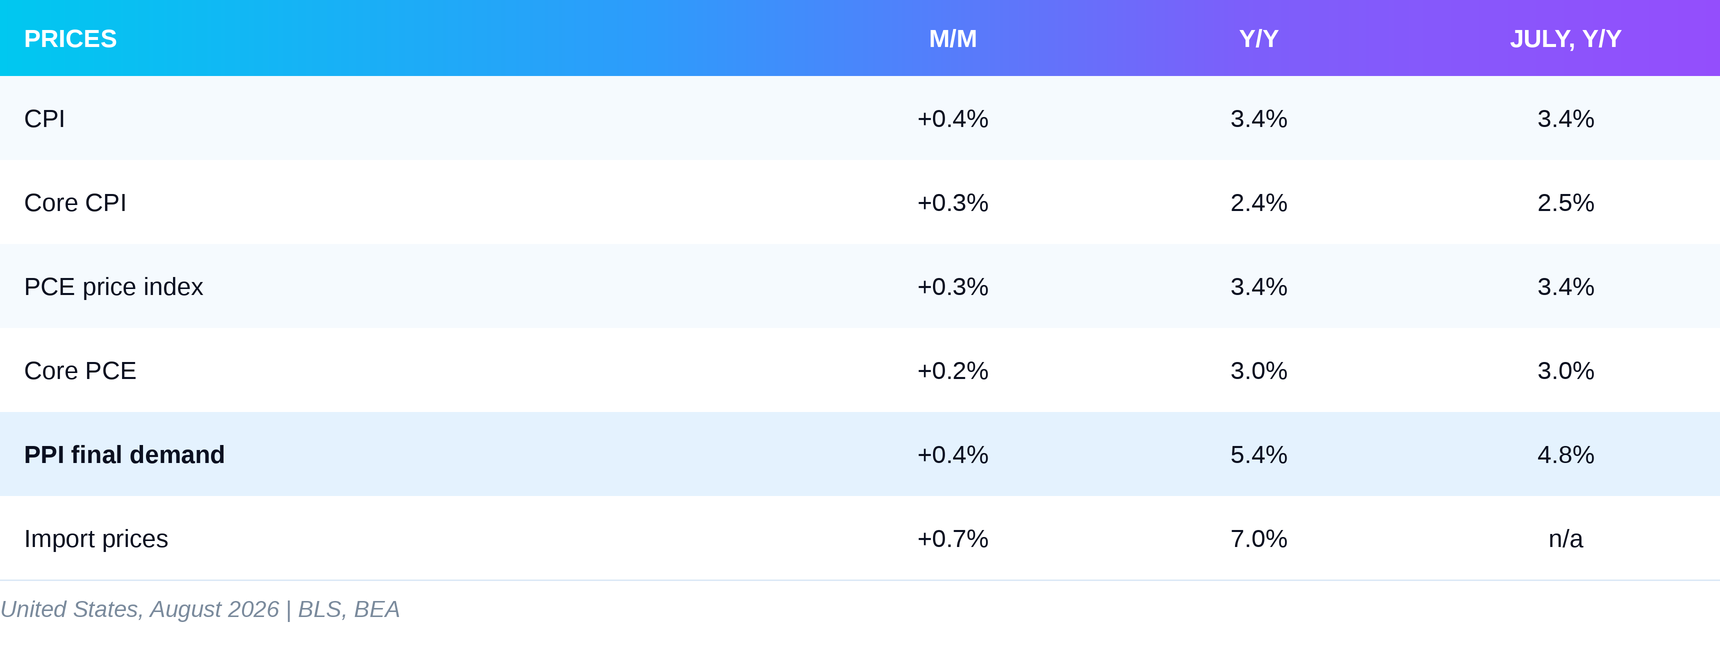
Headline inflation is standing still. CPI is 3.4% for a second month, but the monthly increase of 0.4% is the largest in three months. Gasoline rose 3.9% in the month, and energy overall is 16.3% above a year ago. Without energy and food the picture is calmer: core CPI slowed to 2.4%.
The Fed’s preferred measure looks better than in July, but because of a revision, not because of August. The BEA annual update changed how some services are measured, among them software and portfolio management fees. July core PCE was cut from 3.3% to 3.0%. August is also 3.0%. Before the revision, Fed staff estimated that the new methodology alone takes about 0.2 points off the August core rate. Most of the improvement is in the ruler we measure with, not in inflation itself.
The three-month pace looks even better. Core PCE for June to August, annualized, is about 2.0%. Fed officials themselves warn in the minutes, however, that this measure usually understates inflation in the second half of the year.
The third thing is further up the chain. Producer prices accelerated from 4.8% to 5.4%. Final demand goods rose 1.1% in the month, energy goods 4.2%. The price indexes in the ISM surveys are 71.1 in manufacturing and 72.6 in services. A reading above 50 means more companies are paying higher prices than lower ones. Above 70 it is close to unanimous. Import prices, which do not include tariffs, are 7.0% higher than a year ago, and 5.5% higher excluding fuel.
The gap between producer and consumer prices is 2.0 points. It does not translate mechanically into future inflation, because the two indexes have different baskets. But it shows pressure that someone will absorb. Either companies through their margins, or customers through prices. The Fed minutes give a hint: some participants note that companies are passing costs on to consumers more successfully than before.
That is why the Fed has little freedom. Core PCE stands at 3%, headline inflation is above 3%, and pressure is coming from upstream.
The detail being underestimated
The Fed is tightening. The banks are loosening. Both are happening at the same time, and they are rarely put side by side.
IMAGE: us_august_2026_money_credit.png
Commercial and industrial loans, meaning bank loans to businesses, grew by $46.7 billion in August alone. Their annual growth rate accelerated to 9.5%, the fastest of the year. Over the same four weeks, bank reserves at the Fed fell by $59.6 billion. Money at the base of the system is shrinking, while banks are piling credit on top.
This continues the theme of our last two Global Liquidity Snapshot issues. In September we called bank credit the detour by which liquidity reaches the economy while central banks shrink their balance sheets. At the time the July monthly series showed corporate lending weakening. The benchmarking of bank statistics to bank regulatory reports on October 2 rewrote that story. The August data show that the detour is not only open, it is widening. The October issue already sees the first sign of a slowdown. In the four weeks to September 23, total bank loans and leases grew by $51.1 billion, against $108.4 billion in the previous four weeks.
Why is this happening? The minutes of the September meeting answer the question themselves. Several participants consider the current rate “not restrictive or only mildly restrictive”. Many participants describe financial conditions as supportive of growth. Several point out that credit is widely available and that banks have eased their standards. Our own calculation shows why. In August the upper bound of the policy rate minus core PCE gives a real rate of about 0.75 points. The middle of the range gives about 0.6. That is the price of money after inflation. It is lower than the headline rate suggests.
Credit also arrives by other routes. Large technology companies are financing the construction of AI data centers with bonds. According to the ECB, their capital spending through 2028 exceeds $1 trillion, about 3% of US GDP, and can no longer be covered by their own cash flows. They are issuing in euros as well. The Fed minutes note that this supply of debt competes with Treasuries and pushes long-term yields up. The Bank of Japan describes in a separate analysis the rapid expansion of private credit in the United States.
The Fed is holding the brake pedal. The banks, the bond market and private credit are holding the gas pedal. Tightening works where credit passes through the interest rate: mortgages and small business. Where companies have profits, a credit rating and access to markets, it is barely felt.
One qualification against our own reading. In July business loans fell by $9.4 billion. The average for July and August is about $19 billion a month, below the pace of the first half. The annual acceleration is real, but the monthly impulse is no stronger than in the spring. The signal is in the direction, not in a single month.
What it means
The August data confirm that growth is not weakening and inflation is not slowing. Our latest quarterly map put the United States in a regime of strengthening growth and accelerating inflation. Nothing in August moves the economy out of it.
The Fed’s answer came on September 16: a 25 basis point increase to 3.75-4.00%, by a vote of 12 to none. In July the three dissenters wanted exactly this. This time the whole committee joined them. According to the minutes, most participants expect one more increase before the end of the year. The direction is clear: tightening. The only question is how much.
Why is the Fed tightening when core PCE is 3.0% and not 3.3%? Because it is looking forward, not back. The minutes list energy, AI-related demand, and the danger that after more than five years of inflation above 2%, expectations could come unanchored. The increase is insurance. The Fed is not reacting to the latest number. It is reacting to the fact that credit and spending are not slowing.
For liquidity conditions the conclusion is twofold. Short-term rates and yields are rising: 10-year Treasuries averaged 4.68% in August and passed 5.3% in early October. Part of the rise is the term premium, the extra yield investors demand for holding long bonds, and it is linked to the hyperscaler debt described above. Market liquidity, however, remains ample. The high-yield bond spread, the premium risky companies pay over the government, averaged 2.70 points. That is low. Behind that average, though, there is a split. The gap between the weakest risky companies (CCC) and the sounder ones (BB) passed 10 points on October 1, according to our October issue. Rates are high, but most companies are still finding financing. For the weakest it is already very expensive: CCC-rated bonds were paying about 17% a year as of October 1. For companies with profits, this is an environment in which they can invest.
The Fed’s own balance sheet is barely moving. Between July 29 and August 26 it shrank by $7.3 billion. According to the minutes, the New York Fed has also stopped the purchases of short-term bills it used to keep reserves ample, because it sees no need for them. The reverse repo facility, the buffer that absorbed swings for years, is practically empty. That means every further refill of the Treasury’s account at the Fed comes directly out of bank reserves. For now, tightening comes from the price of money, not its quantity.
Ordinary people feel the other side. The mortgage rate has passed 7%. Gasoline is more expensive. Wages are growing 3.1%, slower than prices.
What the data already confirm: consumer spending and investment are holding up growth, prices further up the chain are accelerating, and bank credit is growing against the Fed. What remains an assumption: that savings will last until incomes catch up, and that tightening will reach credit before it reaches housing and hiring.
What we said last time
In July we said the economy was in Acceleration, with an investment and manufacturing engine and a transmission delivering power unevenly. The phase has held. The threshold we set for changing it, manufacturing new orders below 50 and a three-month average payroll gain near zero, was not reached. We said the Fed would hold rates with a readiness to raise them. It raised them on September 16. We said the July drop in retail sales might be calendar noise. The August gain of 1.1% confirmed that.
The case against our reading
The strongest number against Acceleration is industrial production. Zero for the month, a decline in manufacturing, and new orders down three points. Add the 29,000 new jobs in September and unemployment rising to 4.2%, and a different story emerges. The peak pace is behind us. The economy is entering Growth with slowing momentum, and August’s spending is a one-off catch-up after a weak July.
The second line of attack is against the brake. We read the fall in the saving rate as borrowing from the future. Another mechanism explains the same data. Barr describes it in his September 29 speech: when households expect higher future incomes and their wealth is rising, they quite rationally save less. Stocks have risen strongly this year. If that is the cause, low savings are not exhaustion but a new normal, and spending could hold up longer than we argue.
What would have to happen for us to be wrong about the phase? The first estimate of third-quarter GDP on October 29 would need to show private domestic demand below 3%, and real spending in September would need to fall. What would have to happen for us to be wrong about the brake? The saving rate would need to hold around 4% for several months without spending slowing.
Risks in both directions
The upside risk is that the investment cycle keeps surprising. The Fed minutes note that the scale and pace of AI infrastructure construction keep exceeding expectations. Orders for capital goods, 14% above last year, say the same. If the new equipment starts to raise productivity, growth can continue without the same inflation cost. Productivity is already growing 2.2% a year.
A second upside risk would be energy, but for now it is unlikely. As long as the conflict around Hormuz is active, a lasting drop in fuel prices is not realistic. If a lasting peace does come, headline inflation will fall quickly, real income will recover, and households will be able to spend without drawing on their reserve.
The downside risk is twofold. The first is savings running out at the same time as hiring weakens. The 29,000 jobs in September are the first signal in that direction. If incomes do not catch up, spending will have to slow abruptly. The second is that the Fed keeps tightening until it reaches business credit. Tightening hits first where credit is most sensitive to interest rates: housing and small business. They are already weak.
The most unpleasant scenario is a repricing of AI expectations just as savings are exhausted. Then both engines stop at the same time, while inflation from energy and imports stays and does not allow quick relief.
What to watch
On October 14, September CPI will show whether core stays around 0.3% a month and how much of the September rise in fuel prices reaches consumer prices. Another number like that would reinforce expectations of a hike in October. On October 15, retail sales will test whether the August gain is a lasting level or a catch-up. A drop below zero would confirm our reading of spending on borrowed savings. The same day, producer prices will show whether the gap with consumer prices is widening beyond 2 points.
On October 27, new home sales will show how the market is coping with mortgage rates above 7%. On October 27 and 28, the Fed decides whether to raise rates again. On October 29 come the first estimate of third-quarter GDP and September PCE. A saving rate below 4% would mean the reserve is still being drained.
The threshold for changing the phase is manufacturing new orders on the ISM survey below 50 together with a three-month average payroll gain near zero. Both together would move our assessment from Acceleration to Growth with slowing momentum. The average for July to September is 51,000.
Closing
The US economy keeps accelerating, but the fuel for that acceleration increasingly comes from household savings and bank credit rather than from incomes. The Fed is pressing the brake. The banks are still hitting the gas, while the market is already choosing whom it finances.
We do not know how long the reserve will last. Nor do we know which will prove stronger: the Fed’s brake or the banks’ gas.
Sources
BEA, GDP third estimate, corporate profits and annual update, Q2 2026
BEA and Census Bureau, U.S. International Trade in Goods and Services, August 2026
BLS, Employment Situation, September 2026, with August revision
Census Bureau, Manufacturers’ Shipments, Inventories and Orders, August 2026
Federal Reserve, Industrial Production and Capacity Utilization, G.17, September 18, 2026
Federal Reserve, H.8 Assets and Liabilities of Commercial Banks, October 2, 2026
Federal Reserve, H.6 Money Stock Measures, September 22, 2026
Federal Reserve, July 2026 Senior Loan Officer Opinion Survey
Federal Reserve, Governor Barr, Economic Conditions and Monetary Policy, September 29, 2026
Bank of Japan, The Expansion and Diversification of Private Credit Funds, September 25, 2026
Not financial advice.