

The frame
This is our July review of the US economy, now that all the main data for the month have been released. The final July piece was the trade balance on September 3. The September 4 employment report serves as a directional check. This is not an economy coming to a stop. It has a powerful investment engine, but its transmission is delivering power unevenly to households, labor and housing.
Where the economy stands
The phase in July remains Acceleration, but the acceleration is becoming narrower and more uneven. The US economy resembles a car with a strong engine and a transmission that engages intermittently. Businesses continue to order, produce and invest. Households are spending more cautiously, housing is feeling the weight of high interest rates, and stronger demand only began to translate into more jobs in August.
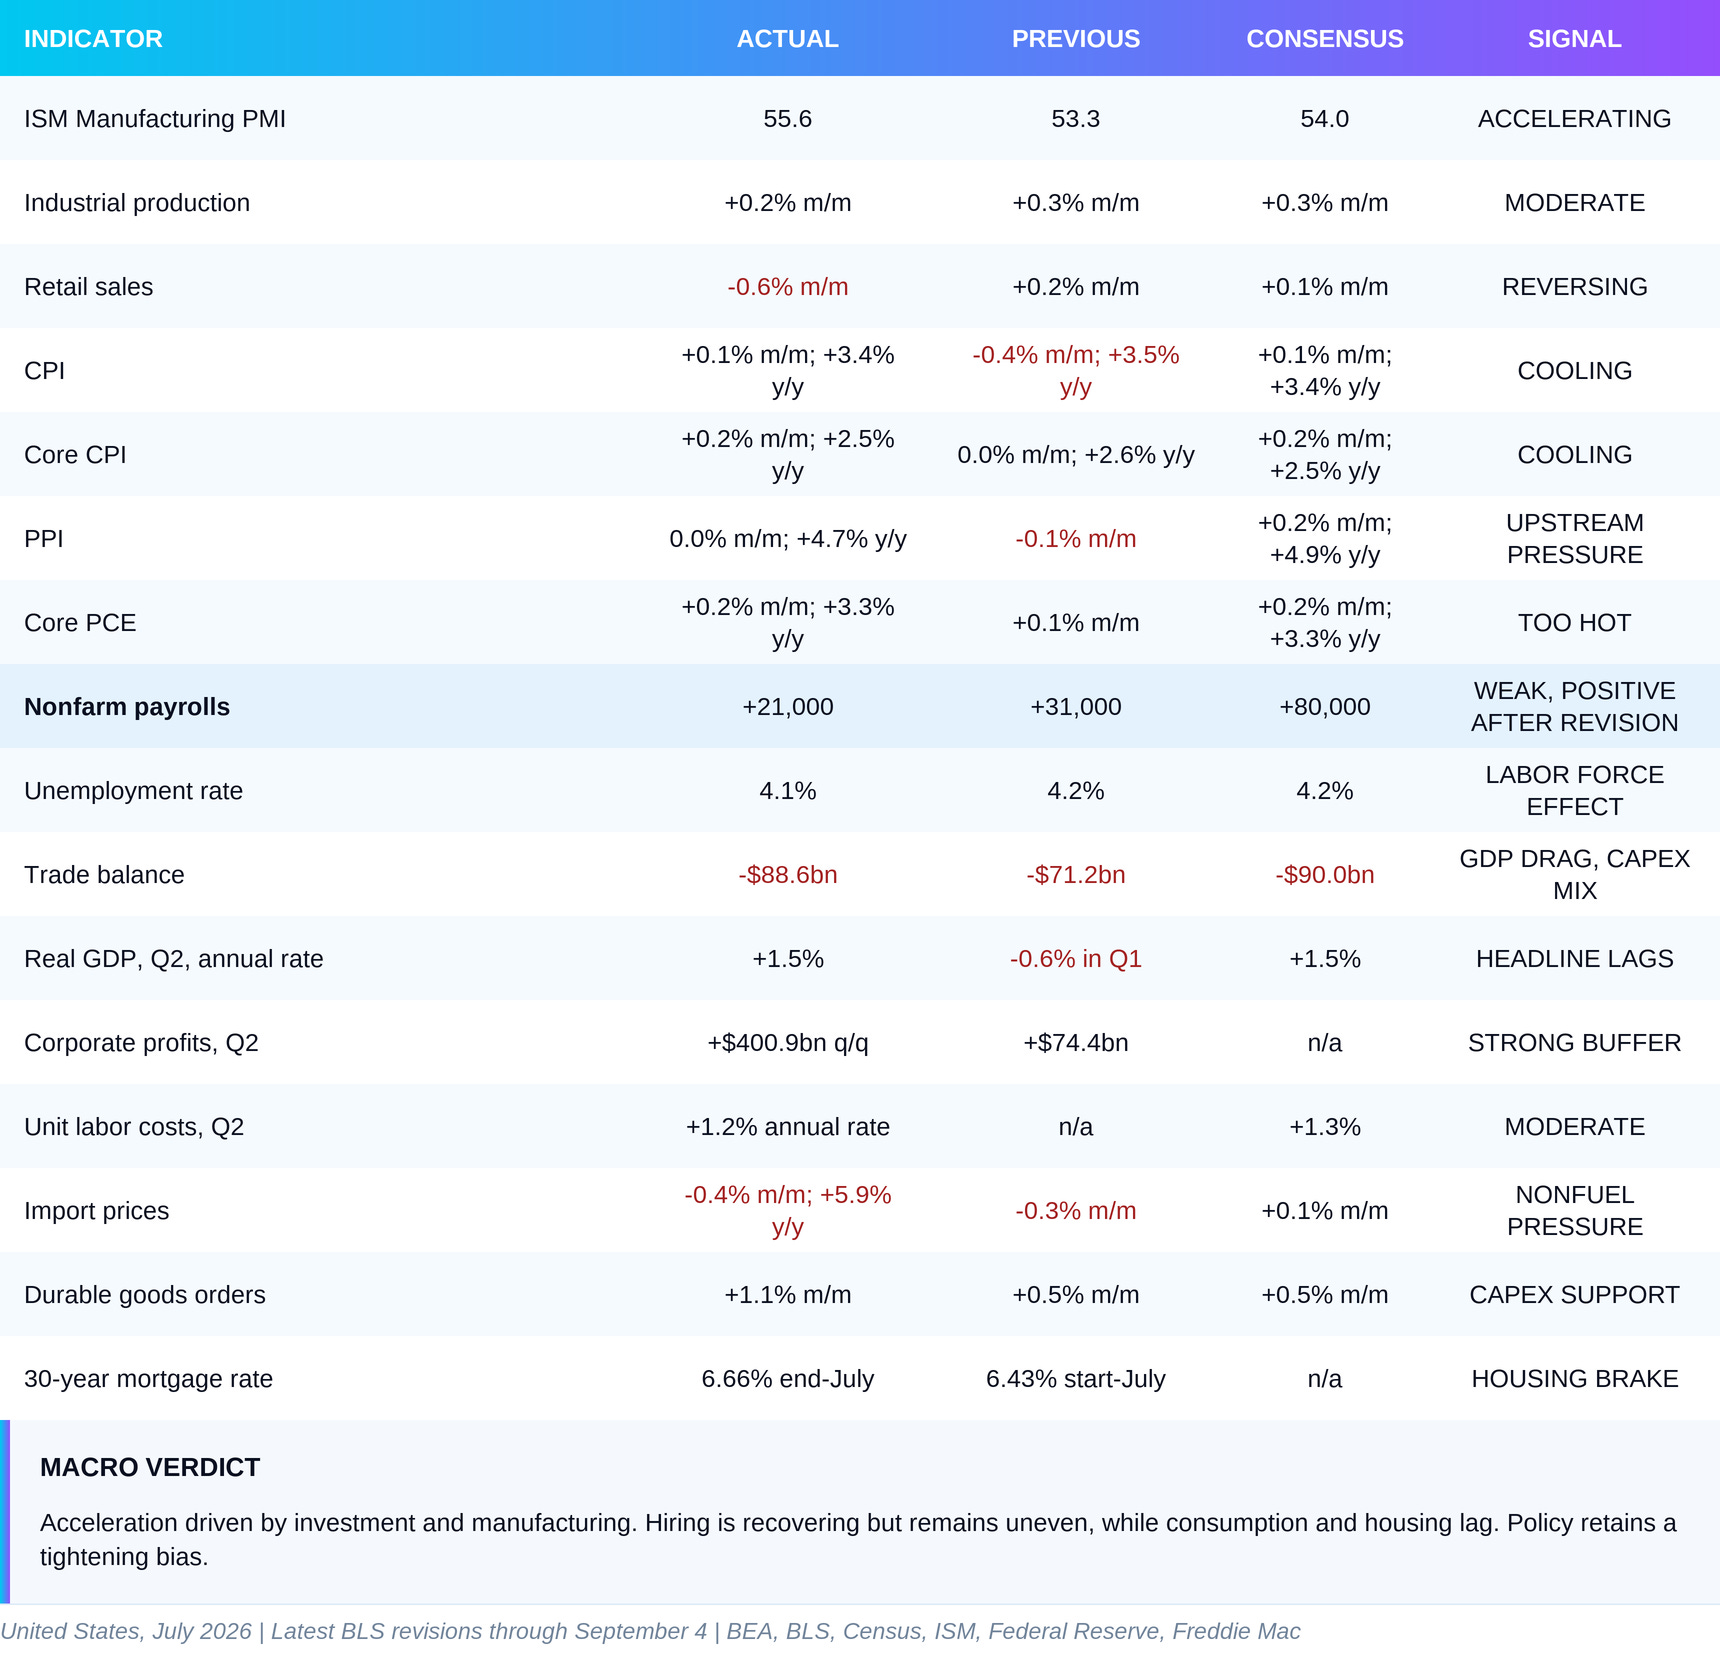
The engine is visible in surveys and in hard orders. The ISM Manufacturing PMI rose to 55.6, industrial production increased 0.2%, and factory orders grew 0.9%. The second estimate of GDP strengthened the thesis from our previous Macro Pulse. Real final sales to private domestic purchasers, the cleanest measure of consumption and private fixed investment, were revised up to a 4.2% annualized rate in the second quarter.
The brake is broad enough to stop us from calling this an unqualified boom. Real consumption was virtually unchanged in July. Retail sales fell 0.6%, housing starts dropped 12.4%, and new home sales fell 10.5%. July payrolls are now estimated to have risen by 21,000 rather than fallen by 23,000. August’s gain of 162,000 weakens the darkest interpretation, but hiring was concentrated in a few sectors. This is uneven hiring, not a broad new employment wave.
Inflation leaves little room for help from the Federal Reserve. CPI is cooling, but the PCE price index is running at 3.7%, core PCE at 3.3%, and producer prices are 4.7% above a year ago. The central case is a hold with readiness to raise rates if price pressure does not ease. A rate cut would conflict with the combined signal from growth and inflation.
Core indicators
The trajectory
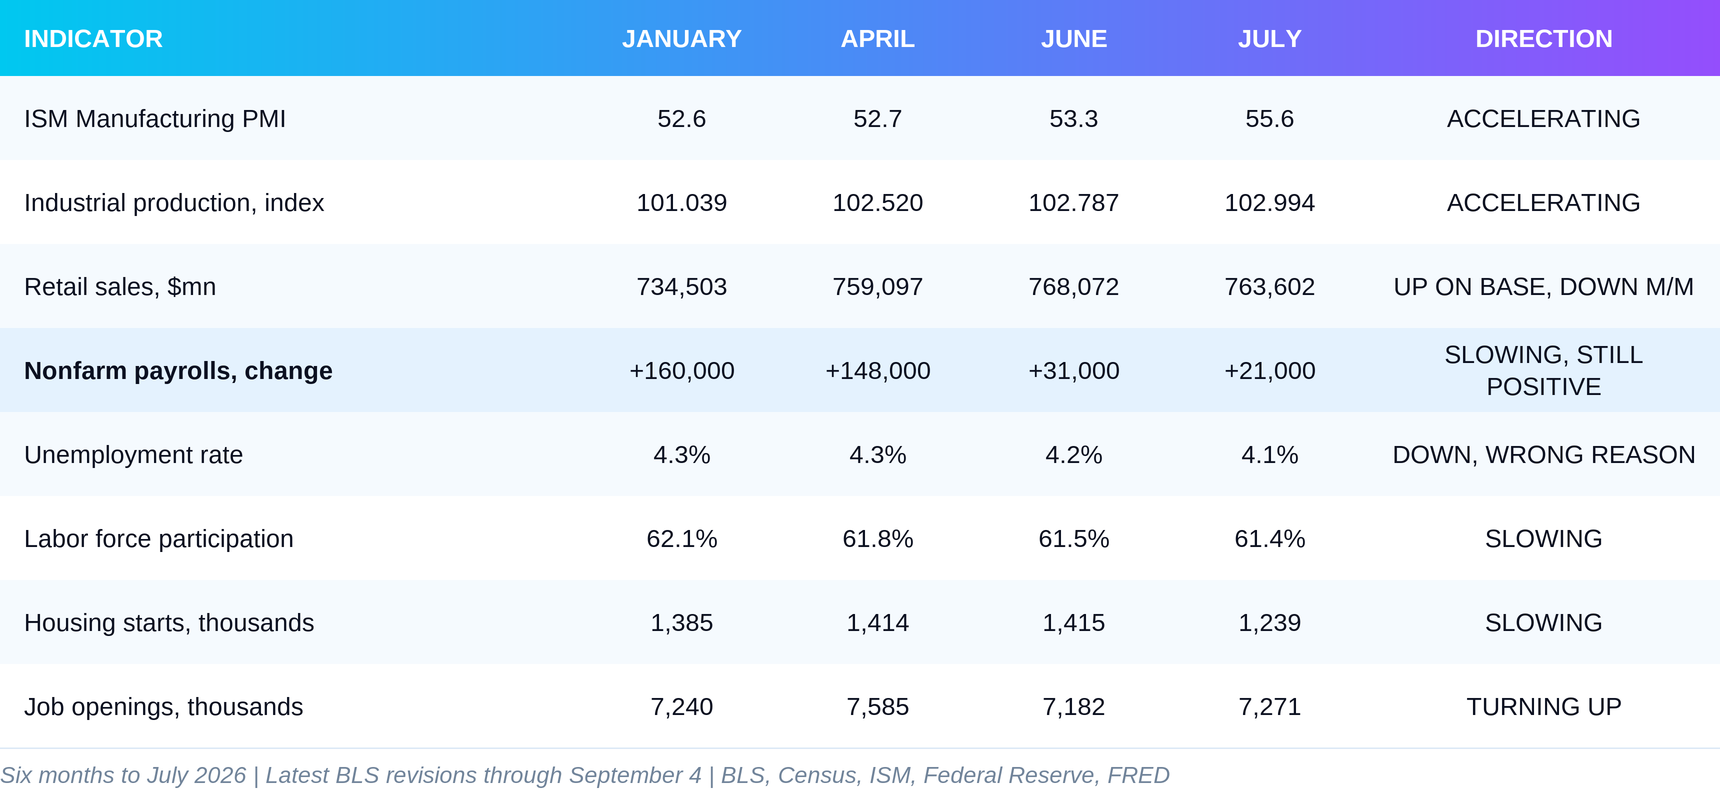
Three rows carry most of the story. The first is the ISM Manufacturing PMI. Its rise from 52.6 in January to 55.6 in July is too large to dismiss as monthly noise. New orders stand at 56.7 and production at 58.5. A reading above 50 means that more companies report improvement than deterioration. The improvement is now broad.
The second is employment. Monthly payroll growth slowed from 160,000 in January to 31,000 in June and 21,000 in July. The latest revisions change an important detail. July’s initially reported loss of 23,000 is now a small gain, while June was raised by 11,000. August added 162,000 jobs. That rejects the idea that the economy has already entered sustained employment contraction, but it does not erase the weak average gain of 31,000 a month over the past year.
The third is labor force participation. It fell from 62.1% in January to 61.4% in July. That is why lower unemployment cannot be read on its own. The labor force contracted by 264,000 in July, the number of employed people in the household survey declined by 87,000, and the number of unemployed fell by 178,000. Unemployment went down because both the numerator and the denominator became smaller.
Retail sales show why a mechanical classification is not enough. The July level remains above January and April, so the strict table rule still points upward. Compared with June, however, sales fell 0.6%. The longer trend remains positive. The short-term impulse is negative. That is exactly what a slipping transmission looks like.
The August data confirm the split without changing the July classification. Manufacturing ISM eased to 54.6 but remained in expansion. Services accelerated to 55.4 and new orders reached 60.9. Employment components in the surveys stayed below 50, but official payroll employment rose by 162,000. Demand is holding and hiring is recovering, although it is not yet broad.
The engine
The investment and manufacturing cycles are the engine of the US economy. This is not only a change in managers’ sentiment. Factory orders rose 0.9% in July, durable goods orders increased 1.1%, and orders excluding transportation gained 0.4%. Industrial production added 0.2%. Business equipment output rose 0.8%, while consumer goods output fell 0.4%.
That difference matters. Factories are not accelerating because Americans are buying more everyday goods. They are accelerating because businesses continue to build capacity. Equipment, software and other intellectual property were among the main sources of strength in the second quarter. July offers no evidence that this cycle has ended. Orders and imports instead show that equipment continues to enter the country.
The cleanest confirmation comes from the GDP revision. Headline growth remains at a 1.5% annualized rate in the second quarter. Beneath it, real final sales to private domestic purchasers were revised to 4.2% from the initial 3.9%. This measure combines consumption and private fixed investment while excluding government spending, inventories and foreign trade. It shows how quickly the private domestic machine is moving. The difference from 1.7% in the first quarter is too large to dismiss as rounding.
Corporate profits add fuel. They increased by $400.9 billion in Q2 after a $74.4 billion increase in Q1. Higher profits do not guarantee more investment, but they give companies internal resources to fund it. That matters when interest rates are high. A business with strong cash flow depends less on new credit and can continue a project that a weaker competitor might postpone.
Productivity is also moving in the right direction. It increased at a 1.4% annualized rate in Q2 and by 2.2% from a year earlier. Unit labor costs rose at only a 1.2% annualized rate during the quarter, according to the final estimate, revised from 1.3%. Companies are producing more per hour without labor costs moving out of control. Part of the gap between strong activity and weak hiring probably comes from here. Businesses are getting more from their existing staff and new equipment.
How durable is the engine? The evidence says it is more than a one-off jump, but it provides no guarantee. ISM has been rising since the start of the year, orders are growing, capital goods imports continue, and private domestic demand has been revised higher. These are four different windows onto the same process.
The weakness is concentration. If investment depends too heavily on data centers, computers and related equipment, a downturn in one major theme could slow the whole machine quickly. Cost is the second risk. Imported capital goods are becoming more expensive, producer prices remain high, and interest rates are not falling. The engine is running, but its fuel is becoming more expensive.
The brake
The brake has three parts. Consumption is losing monthly momentum, the labor market is creating jobs slowly and unevenly, and housing remains constrained by credit. None of these proves a recession on its own. Together, they explain why July’s acceleration does not feel evenly distributed.
Nominal consumer spending rose 0.2% in July, but after accounting for prices the real change was effectively zero. Spending on services increased by $86.2 billion, while spending on goods fell by $49.9 billion. This is an economy where more expensive and less avoidable services keep adding to the bill while goods purchases are postponed.
Retail sales confirm the pause. They declined 0.6% during the month, although they remained 5.0% above July 2025. Christopher Waller offers an important alternative interpretation. Some of the weakness may be calendar-related because promotional purchases were pulled forward into June. That is possible. It may explain part of the monthly decline, but it does not change the fact that total real consumption did not grow in July.
There is a buffer. Real disposable income rose 0.4%, while the saving rate increased from 2.6% to 3.0%. Households are not necessarily being forced to cut spending. They may have started rebuilding an unusually thin stock of savings. If so, the weakness is a cyclical pause. If incomes slow alongside employment, the pause will deepen.
The labor market remains a brake, but not in the way the first July estimate suggested. July payrolls were revised from a loss of 23,000 to a gain of 21,000, while June was revised from 20,000 to 31,000. August then added another 162,000 jobs. Unemployment held at 4.1%, participation rose to 61.6%, and employment in the household survey increased by 569,000. That is a genuine improvement from July’s picture.
The improvement is not broad enough to remove the brake. Food services and drinking places added 59,000 jobs, while local government education added 42,000. Together they accounted for 101,000, or about 62%, of the entire August gain. Manufacturing added 16,000, but health care grew more slowly than usual and information lost 23,000. Average payroll growth over the past 12 months was only 31,000 a month.
July’s JOLTS data also remain soft. Job openings recovered slightly to 7.271 million, but hires fell to 5.1 million and the hiring rate to 3.2%. Voluntary quits totaled 3.056 million. Workers do not see enough better opportunities to change jobs, and many companies still do not see enough reason to expand their teams.
This remains a low-hire, low-fire regime, not a mass-layoff regime. Layoffs and discharges totaled 1.666 million, less than in June. The classic recession mechanism, in which job losses reduce incomes, spending and then more jobs, is not yet present. The danger is different. If weak hiring persists for long enough, it will gradually reduce household income and confidence even without a wave of layoffs.
Housing shows the effect of interest rates most directly. Housing starts fell 12.4% to an annualized 1.239 million. Single-family starts declined 9.9% to 808,000. New home sales dropped 10.5% to 607,000, while supply reached 9.6 months of sales. The average 30-year mortgage rate rose from 6.43% at the start of July to 6.66% at the end.
The housing brake is mainly cyclical and rate-sensitive. Building permits increased 5.0%, including a 2.5% gain for single-family homes. That is an early sign that builders still see demand at the right price and financing terms. It does not cancel the drop in starts, but it shows what could release the brake. Lower mortgage rates or slower home-price growth could bring buyers back relatively quickly. For now, the Federal Reserve cannot easily deliver the first.
Prices
July inflation tells two stories. Consumer prices offer grounds for moderate optimism. Headline CPI rose 0.1% during the month and slowed to 3.4% year over year from 3.5%. Core CPI, which excludes food and energy, increased 0.2% and slowed to 2.5% from 2.6%. Shelter contributed about two-thirds of the monthly increase, while energy prices fell 1.5%.
The Federal Reserve’s preferred measure is less comfortable. The PCE price index is 3.7% above a year ago, while core PCE is at 3.3%. Both indexes rose 0.2% during the month. The difference from CPI comes from the weights and methods used by the two indexes. PCE matters more for policy. It remains clearly above the 2% target.
Producer prices are more troubling. The PPI for final demand was unchanged in July but stood 4.7% above a year earlier. The broader core measure, which excludes food, energy and trade services, rose 0.4% during the month and also 4.7% over the year. Goods prices declined 0.7%, but services increased 0.2% and construction prices jumped 2.2%.
The gap between producer and consumer prices has two possible outcomes. If companies pass higher costs on to customers, CPI and PCE will face renewed pressure in the coming months. If they cannot, margins will narrow. Strong corporate profit growth shows that the sector has a buffer for now. That buffer is not unlimited.
Import prices complete the picture. The headline index fell 0.4% because fuel prices dropped 7.2%. Excluding fuel, prices increased 0.4% during the month and 4.5% over the year. Imports from China became 0.8% more expensive in July, the largest monthly increase since July 2008, and 2.7% more expensive over the year. Capital goods prices rose 0.9%, including computers, peripherals and semiconductors.
Although conditions around the Strait of Hormuz remain fluid, they have not yet materially changed the price of gasoline at the pump, which held near $4.21 per gallon at the end of August.
The August ISM data warn that the pressure has not ended. The manufacturing price index remains at 71.1. In services, it rose to 72.6, the highest level since August 2022. This is a directional check, not part of the July table. The direction is unfavorable. Headline inflation may cool because of energy while price pressure in services and imported equipment remains strong.
The detail being underestimated
The July trade deficit looks like unambiguously bad news. It widened by $17.4 billion to $88.6 billion, or 24.4% in one month. Exports fell 2.1%, imports rose 2.8%, and the real goods deficit increased by 12.7%. Unless other parts of the economy offset that gap, foreign trade will subtract from third-quarter growth.
The composition changes the meaning. Capital goods imports increased by $14.4 billion. Computers added $6.9 billion, computer accessories $6.6 billion, and semiconductors $1.2 billion. Almost the entire import surge came from equipment that companies use for production, data processing and capacity expansion.
The deficit is the invoice for the investment boom. The national accounts record imports with a negative sign because the equipment was not produced in the United States. The company buying it records an investment. The same action can weigh on headline GDP through trade while increasing future production capacity.
This explains part of the difference between weak headline GDP growth of 1.5% and much stronger private domestic demand of 4.2%. We should not take the next step automatically. Computer imports prove that money was spent, not that the investment will succeed. Equipment may remain underused, projects may prove unprofitable, and the expected productivity gains may arrive late. We know only one thing for now. The investment cycle continues, and it is large enough to be visible at customs.
What it means
The latest quarterly map placed the United States in a regime of strengthening growth and accelerating inflation. July’s data do not reverse that signal, but they show that growth is becoming more uneven while price pressure remains too strong for a rate cut.
On July 29, the Federal Reserve kept its target range at 3.50% to 3.75%. The decision passed by nine votes to three. Beth Hammack, Neel Kashkari and Lorie Logan preferred a 25-basis-point increase. That is an important change in the balance of risks. The debate is no longer only about how long rates should stay unchanged. Part of the committee thinks the current level is not cooling the economy enough.
August speeches presented three versions of the same concern. Hammack thinks it is time to begin a hiking cycle. Kevin Warsh points to strong capital expenditure, corporate profits and broadly distributed inflation. Lisa Cook recognizes housing weakness and low hiring but sees the risk to prices as larger.
Christopher Waller presents the strongest case for waiting. Slow employment growth, in his view, must be compared with slow labor force growth. When few new workers are entering the economy, it does not need a huge number of new jobs to keep unemployment stable. He also points to the slower short-term pace of core PCE. August’s payroll gain and recovery in participation weaken the case for a cut without forcing an increase on their own. This is an argument for waiting for the next inflation report.
The implication for liquidity conditions is simpler. When growth and inflation accelerate at the same time, the central bank has no reason to add liquidity through lower interest rates. If markets expect rapid easing, July’s data argue against that expectation. Keeping short-term rates high continues to make financing expensive, hold mortgages above 6.5%, and reward companies that can invest from their own cash flow.
This creates an uneven economy. Large and profitable companies can buy equipment and raise productivity. Smaller firms that depend on credit feel the cost of money more acutely. Owners of financial assets see support from profits. A homebuyer sees a monthly payment that remains high. A worker sees fewer openings and less reason to quit. The same regime produces growth in the aggregate figures and a sense of stagnation in daily life.
The data confirm that investment and manufacturing are sustaining the pace, while housing lags and labor is beginning to catch up unevenly. The August report weakens the case for a rate cut because it removes the immediate fear of employment contraction. The assumption is that new capital will raise productivity enough to justify the expense and broaden hiring. That part has not yet been won. The car is accelerating. The transmission is engaging again, but it is not yet delivering power evenly.
Risks in both directions
The positive risk is that the investment cycle broadens. If equipment orders turn into more production, higher productivity and gradually stronger incomes, the current acceleration could continue with a smaller inflation cost. Building permits already offer a weak early sign that housing may find a floor. Lower energy prices would also free income for other purchases.
There is also a chance that the trade deficit will prove less negative than it looks. Some imported equipment may enter service quickly. If it raises domestic production, today’s imports will support tomorrow’s exports or replace future imports. That is a possibility, not a forecast.
The negative risk starts with the breadth of hiring. If August’s gain proves temporary and payroll growth returns close to zero, income and consumption could weaken together. The second risk is that price pressure forces the Federal Reserve to raise rates just as housing and most of the labor market are still cooling.
The most uncomfortable scenario is that the engine loses strength before the transmission recovers. If new orders fall, investment projects are postponed, and households continue to save more, the phase could shift quickly to Growth with slowing momentum. If PPI and PCE remain high at the same time, the central bank will not be able to help easily.
What to watch
On September 11, the August CPI report will show whether headline inflation continues to cool and whether core remains below 3%. Retail sales on September 16 will test whether July’s decline was calendar noise or the start of weaker consumption. Industrial production on September 17 will show whether the August retreat in manufacturing ISM is already visible in actual output.
JOLTS on September 29 should show whether the hiring rate remains near 3.2%. On September 30, BEA will publish the third GDP estimate and its annual update. A revision in private domestic demand below 3.0% would weaken the investment thesis. The August core PCE report on the same day will test whether inflation remains above 3%.
The threshold for changing the phase is clear. Manufacturing new orders below 50, combined with a return of three-month average payroll growth toward zero, would change the assessment from Acceleration to Growth with slowing momentum.
Closing
The US economy enters the third quarter with a stronger investment and manufacturing engine than headline GDP suggests. August payrolls show that part of this strength is beginning to reach labor, but hiring remains concentrated while consumption and housing are weak. That keeps the phase in Acceleration but makes it vulnerable.
The next question is not whether companies are still investing. The data already say they are. The question is whether new capacity will create income and jobs before high prices force the Federal Reserve to press the brake again.