

The frame
This is the monthly Macro Pulse for Japan for August 2026. All the main August releases are now out, the last being the final wage data on 23 October. For the first time in a Japan issue we also compare the main figures with market expectations, to show what surprised and in which direction. Data released after August, including the national CPI for September and the flash PMI for October, serve as a check on the direction rather than as August observations.
Where the economy stands
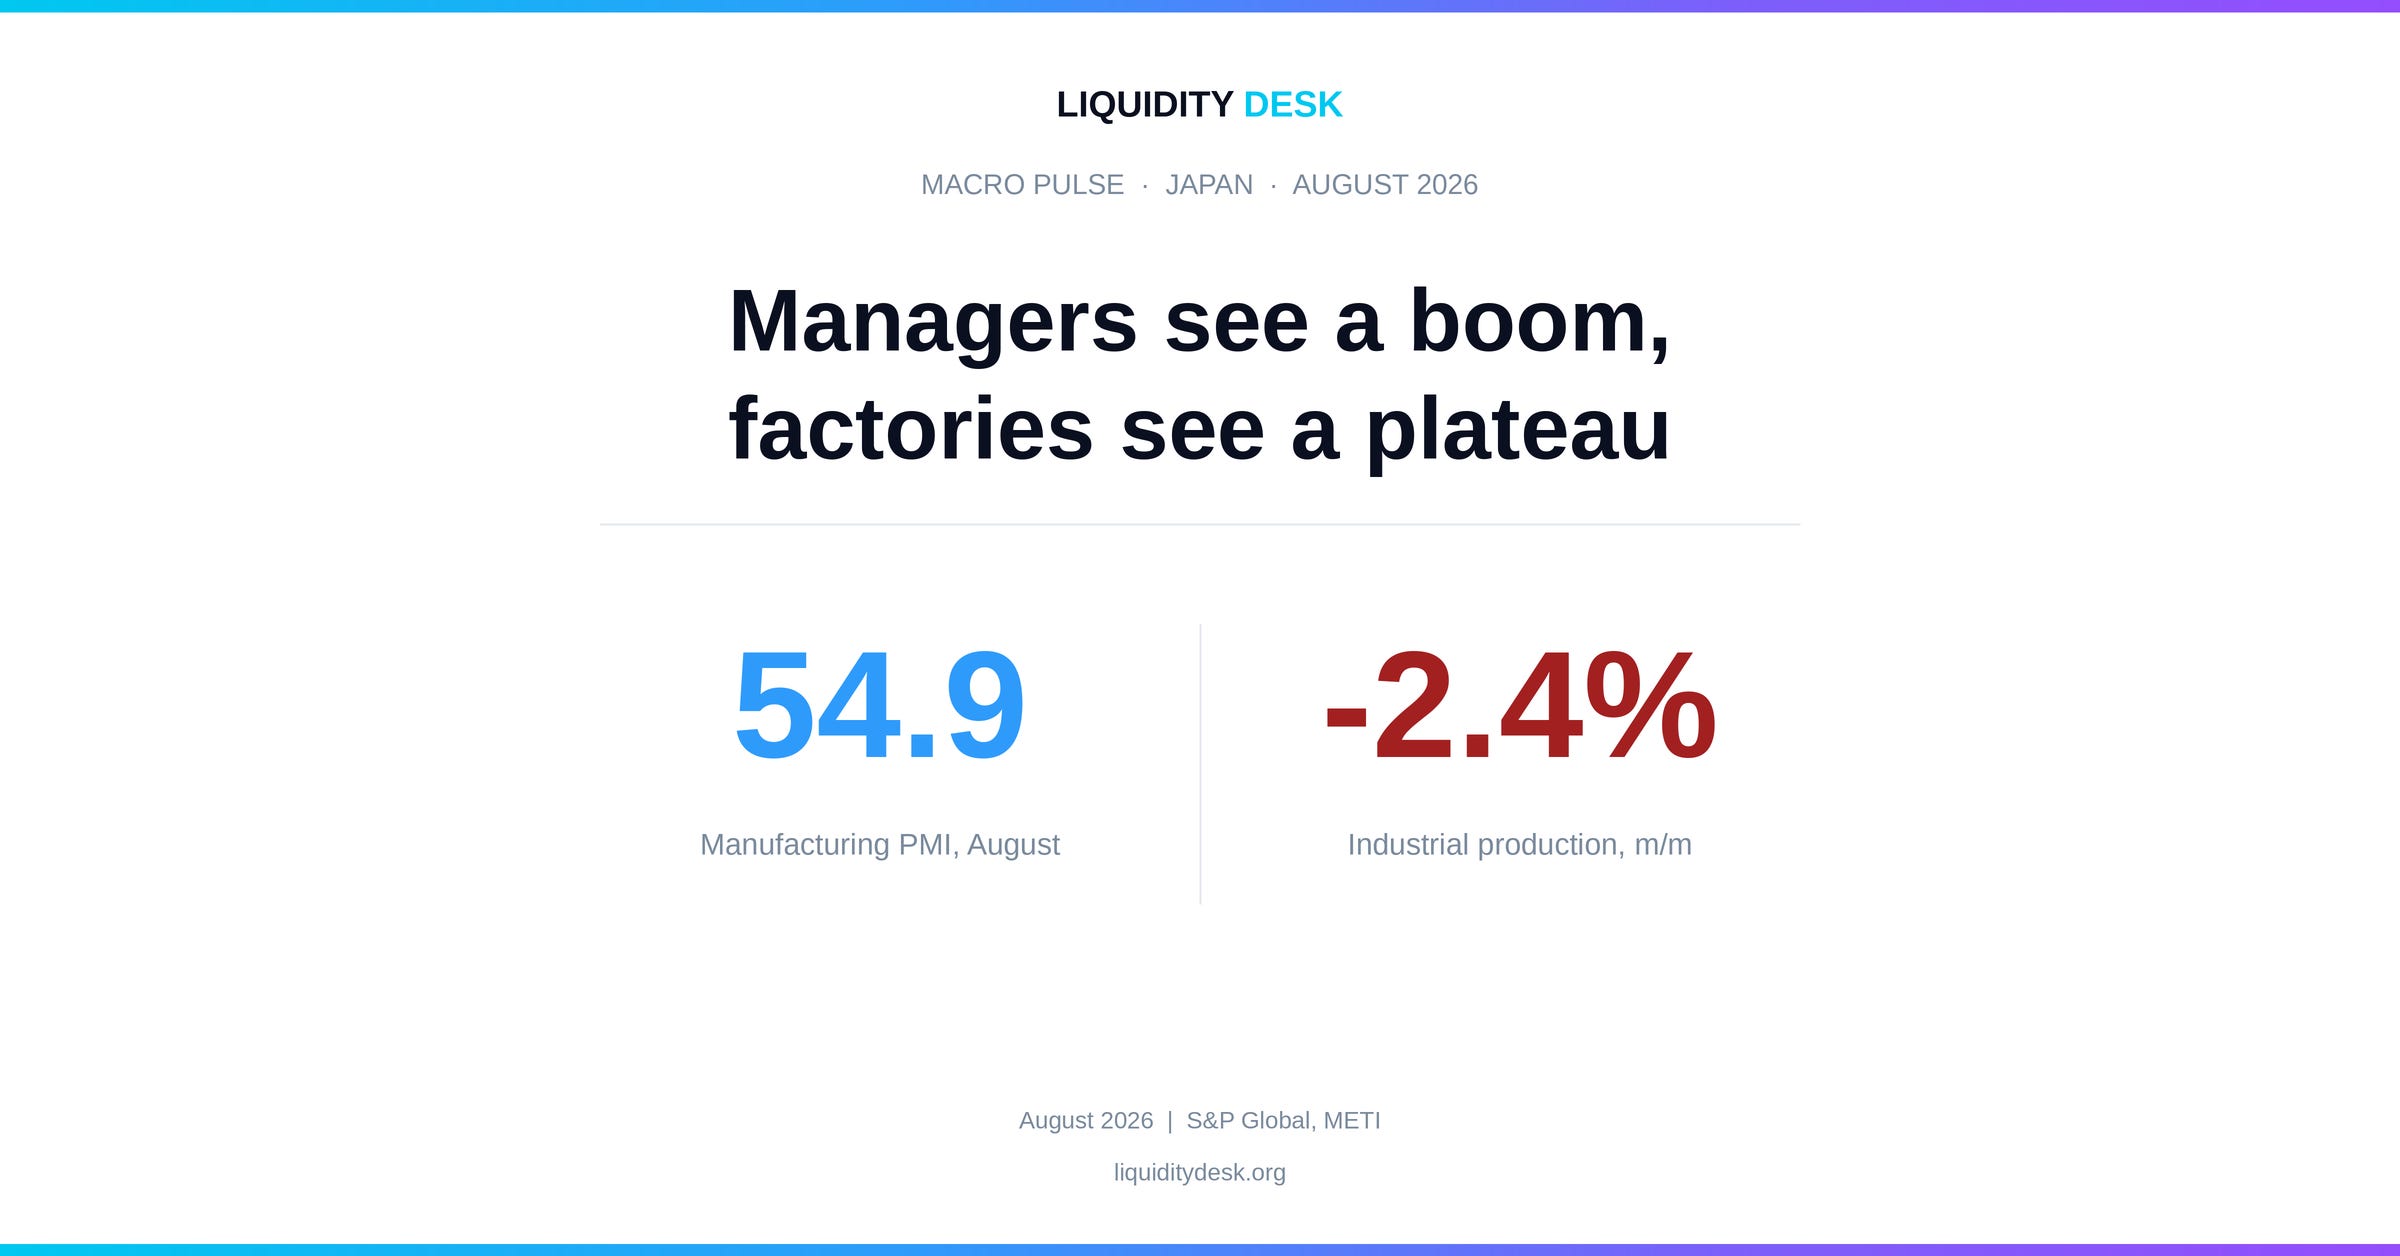
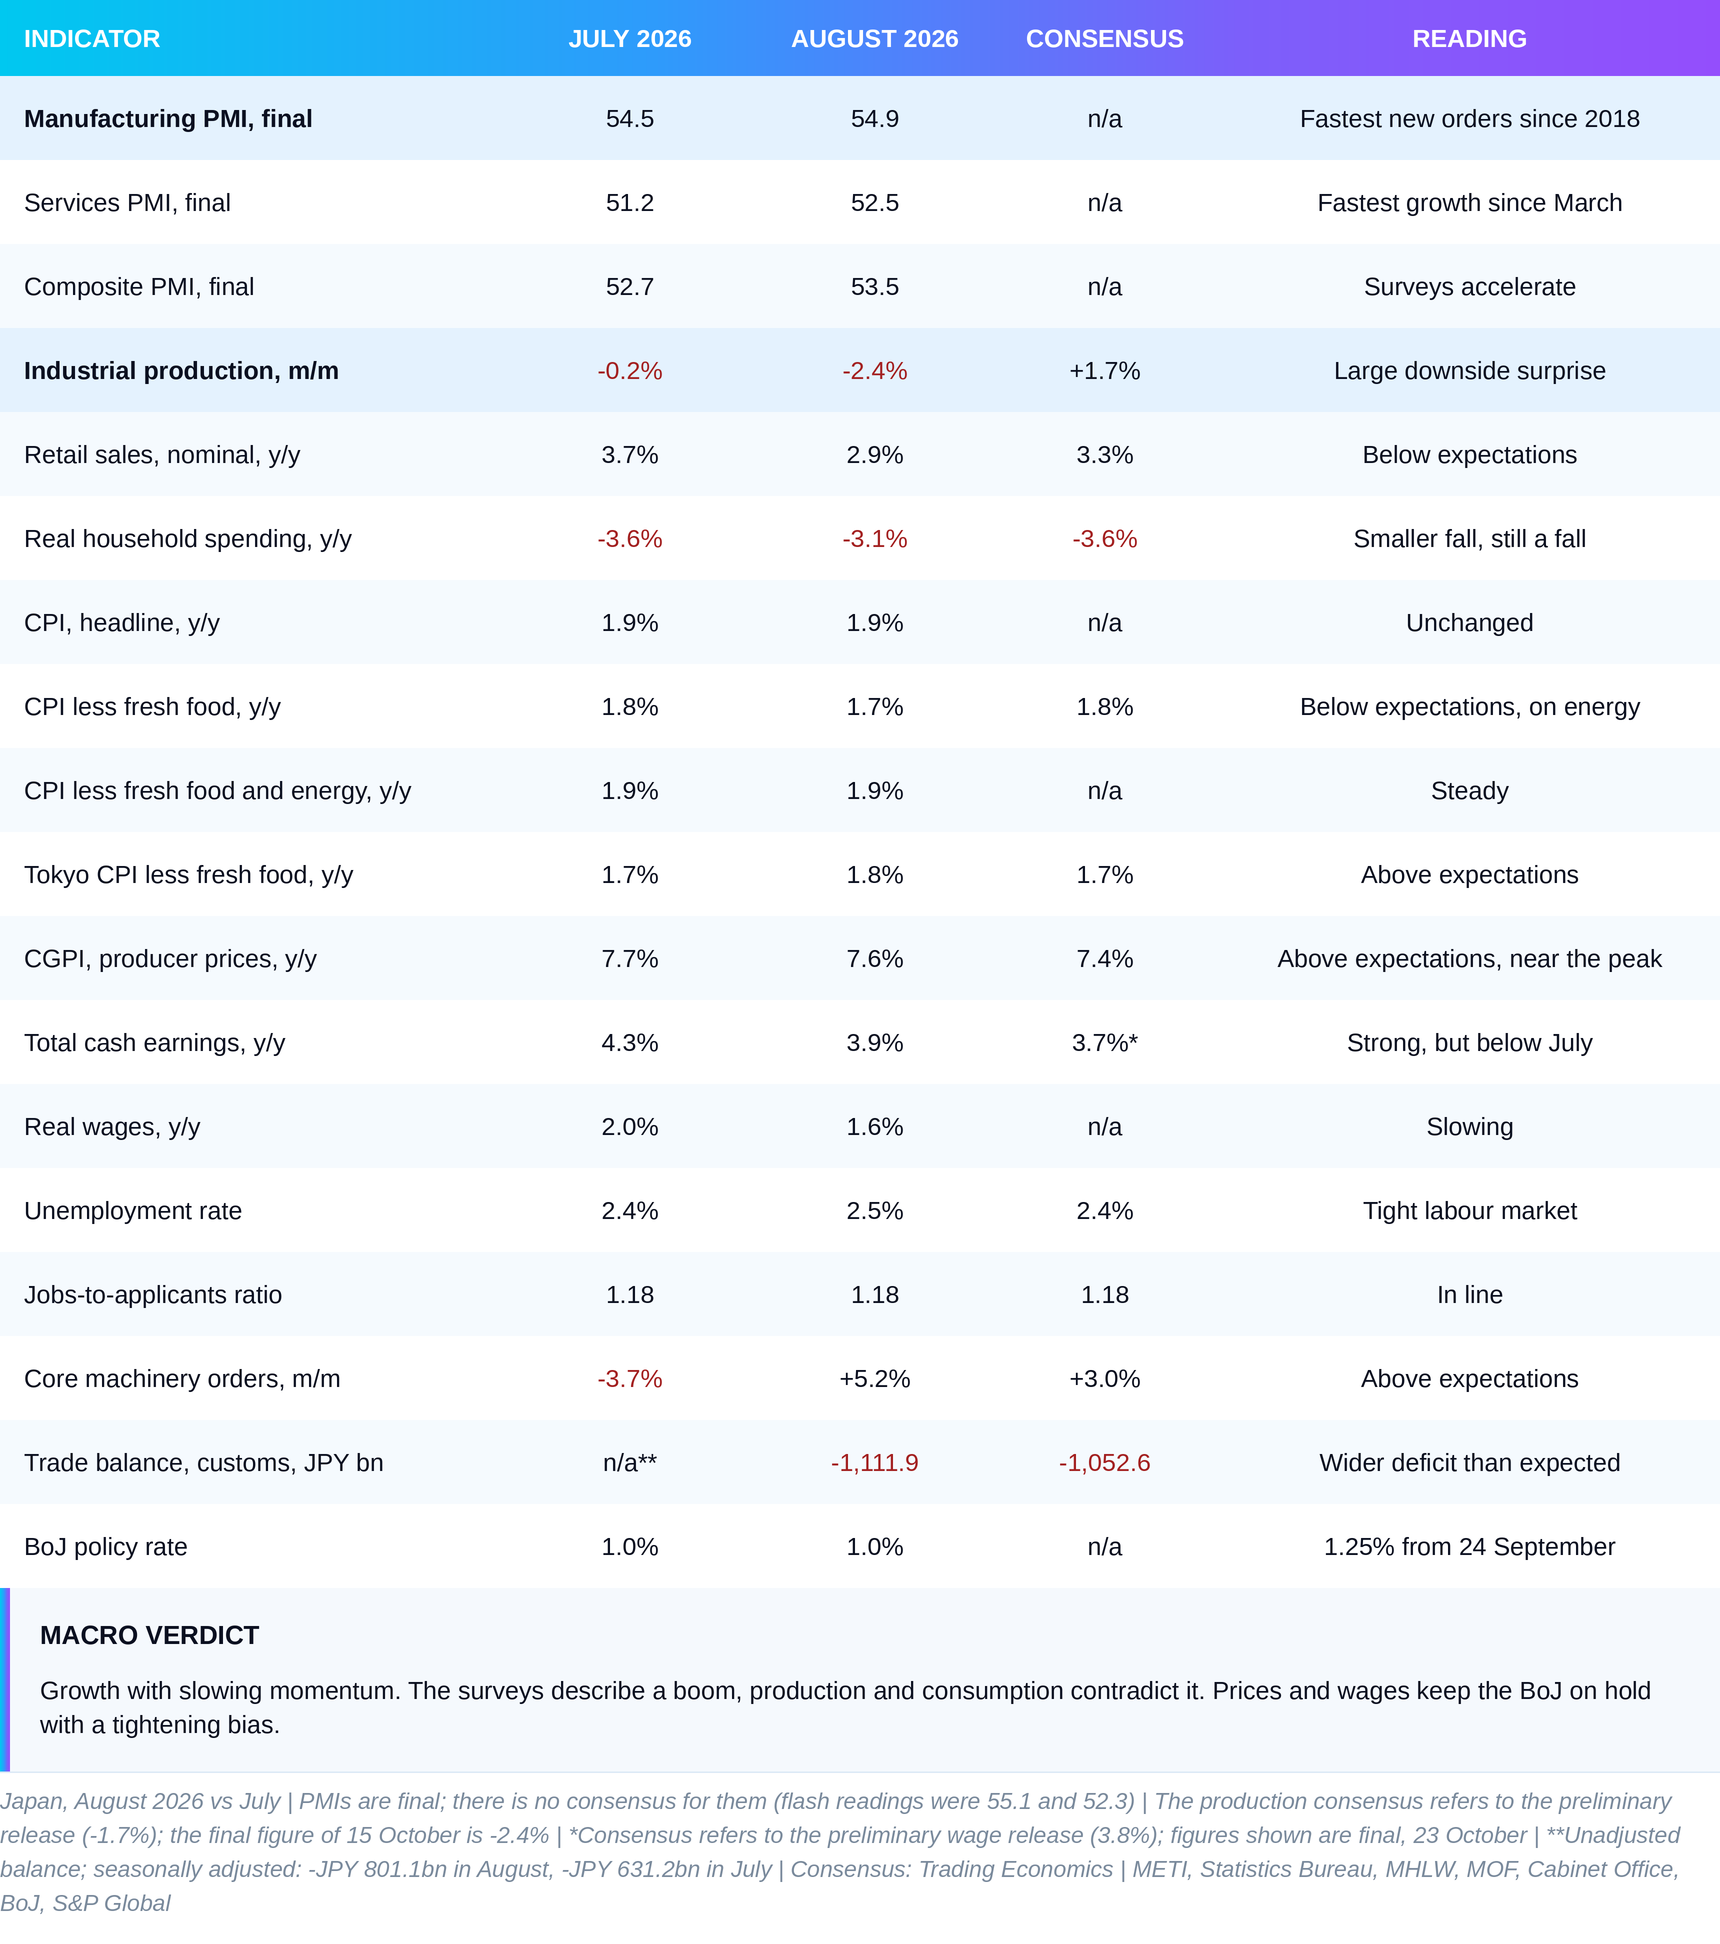
The phase in August remains growth with slowing momentum. Surveys of managers describe the strongest manufacturing upswing since 2014, while the measured data show a plateau. The composite PMI, the combined survey of managers in manufacturing and services in which a reading above 50 signals improvement, rose to 53.5, and new orders at factories grew at the fastest pace since January 2018. In the same month industrial production fell 2.4%, against a market expectation of a 1.7% rise. That is the biggest surprise of the month. In the other direction, prices further up the supply chain and wages came in above forecasts.
The engine is still global demand for chips and equipment for artificial intelligence. Machinery orders are up 18.6% from a year earlier and companies are raising their investment plans, but exports are growing more and more in value and less and less in volume. The brake comes from households. Their real spending is 3.1% below last year, and the broader consumption index compiled by the Bank of Japan (BoJ) fell on the month. Prices send the BoJ the opposite signal. Without the government’s energy measures, headline inflation would be around 2.5%, and wages are growing by close to 4%. Our reading is therefore on hold with a tightening bias. Weak production argues for a pause at the meeting on 29 and 30 October, while prices and wages argue for one more hike before the end of the year.
Core indicators
The trajectory
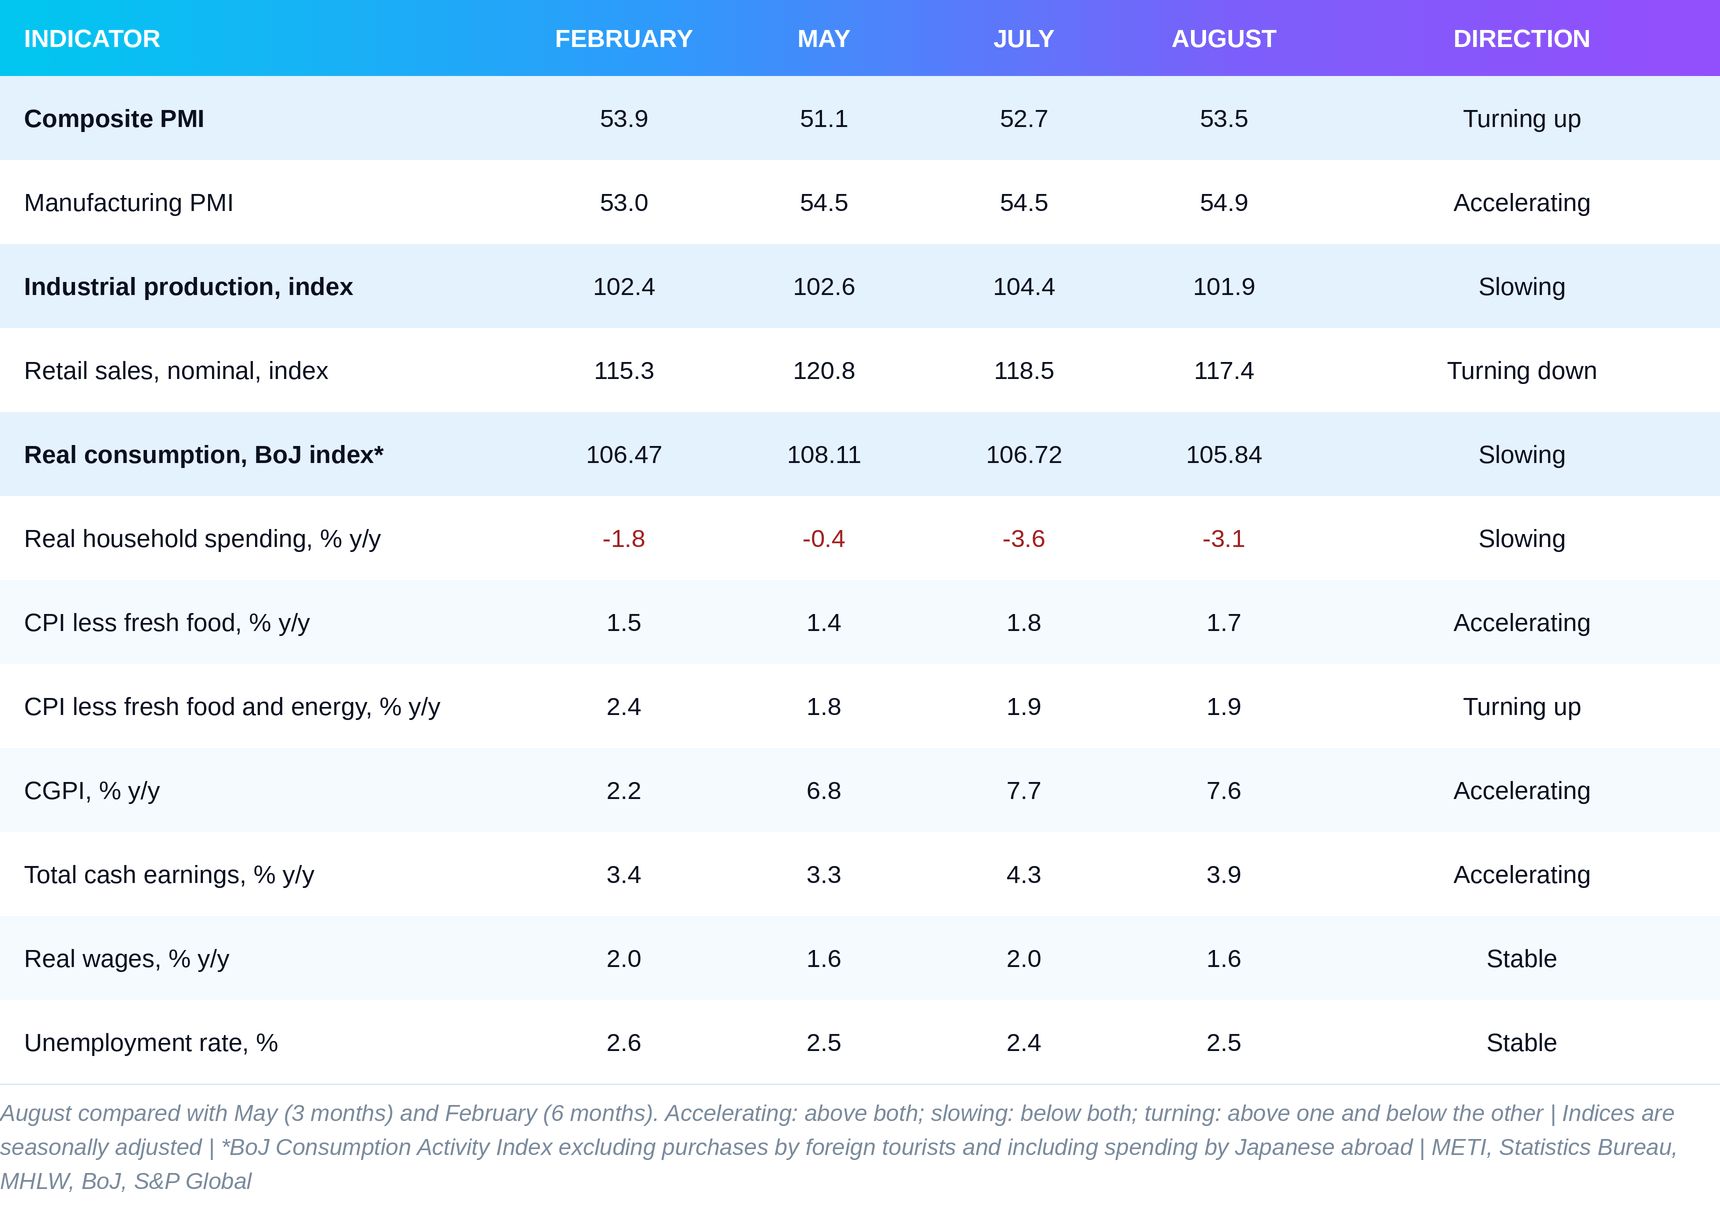
One month cannot decide the phase, so the six-month window compares August with February and May and shows whether it is a continuation or a turn. The most important thing in it is a contradiction. The composite PMI is turning up: it is higher than in May, though still below February. The manufacturing PMI is above both. Industrial production, the measured volume, is below both. The survey and measured output diverge in exactly the month when the survey is at its most optimistic, which is why we devote the section on the underestimated detail to this gap.
Consumption comes next. The BoJ’s consumption index fell 0.8% on the month and sits below its level in both February and May. Its average for July and August is 1.0% below the second-quarter average. That is not the whole third quarter, but it is two thirds of it. The household spending survey points the same way, with a real fall of 3.1% from a year earlier, and nominal retail sales are turning down after their May peak. So the two indicators that are turning move in opposite directions: the survey of the whole private sector is turning up, while sales in shops are turning down. If we had to pick the more reliable turn, we would pick the measured one, because sales are yen actually recorded, while the survey is an opinion about direction. Both, however, are a single month, so in the section on what to watch we set concrete September thresholds that will settle the question.
On wages we need to correct our July issue. We wrote that total cash earnings, meaning wages together with overtime and bonuses, grew 4.7% in July and real wages 2.4%. The final data show 4.3% and 2.0%. For August the final figures are 3.9% and 1.6%, 0.1 point above the preliminary ones. Under our direction rule, nominal earnings are still accelerating against February and May, while real wages are at their May level and below February. Base pay for full-time employees is rising 4.0%. The income base remains solid, but it is not broadening, and inflation is eating a growing share of it. Prices themselves, however, are accelerating more quietly than it seems. Core CPI, the overall index excluding fresh food, is above both comparison points, by 0.2 and 0.3 points. That is a small move, and the government’s energy measures are holding it down. The measure excluding fresh food and energy, known as core-core, stayed at 1.9% for a second month.
The engine: chips grow, the rest of industry lags
Japan’s engine in August has the same name as in July: demand linked to artificial intelligence. What has changed is how much of it reaches volume. Exports rose 19.3% from a year earlier in yen, but according to the Ministry of Finance the volume of goods exported rose only 2.4%, after 5.2% in July. Export prices in yen are 16.5% above last year, so about 85% of export growth is price, not quantity. That is the effect of the weak yen: every good sold in dollars brings in more yen without the factory shipping more containers. September continued in the same vein, with exports up 16.7% in yen and 1.9% in volume. The BoJ’s measure of real exports, however, is 1.0% above the second quarter, so net exports may give a small lift to third-quarter GDP.
At the core of the engine, volume is still moving. Exports of chipmaking equipment rose 40.1% in value and 43.1% in quantity, so quantity is growing even faster than value. Exports of semiconductors and electronic components are 52.3% above last year in value. In industrial production, however, only two industries grew. The first is production machinery, the machines other factories use to make things, chipmaking machines among them: up 5.9% on the month and 24.7% on the year. The second is transport equipment excluding cars, up 2.5%. Everything else fell, led by cars, down 6.8% on the month. The engine is therefore smaller than it sounds. Chips and the equipment to make them are a narrow segment of industry, and industry is a smaller part of Japan’s economy than consumption. The segment can grow 40% and still fail to lift total output when cars and general machinery are falling. That is exactly what happened in August.
Orders confirm that the core is alive. Core machinery orders rose 5.2% on the month, against 3.0% expected by the market, and are 18.6% above August 2025. The answer to the question we left open in July is also positive. In the September Tankan, the BoJ’s quarterly survey of companies, investment plans for fixed assets in the fiscal year that began in April point to growth of 7.6%. Companies did not cut them. They raised them by 0.8% from the June survey. These are intentions, not money spent, and the check will come with business investment in the first GDP estimate on 16 November. There is, however, a new warning. In the September survey the manufacturing PMI slipped to 54.1, its lowest in six months. Some firms explain slower orders by customers running down inventories after earlier overstocking. That admission matters, because if part of the summer upswing in the surveys was stockbuilding, it borrowed from the months ahead rather than adding new growth.
What could stop the engine? First, a reversal in global investment demand for AI infrastructure. Japanese equipment suppliers sit at the start of the chain and are the first to feel any delayed project. Second, a stronger yen. If the exchange rate snaps back, the price part of export growth will shrink and the modest 2.4% volume growth will come to the fore. Third, energy. The surveys keep naming supply disruptions around the Strait of Hormuz as a reason for high costs.
The brake: households are not coming back
The brake is where it was: in household spending. Real spending by households of two or more people is 3.1% below last year. That is less bad than the 3.6% fall the market expected, but the decline has exceeded 3% for a third month in a row, after 3.3% in June and 3.6% in July, whereas in April and May it was below 1%. The monthly improvement is only 0.1%, against 0.5% expected. The broader measure matters more. The BoJ’s consumption index gathers data on sales, services and spending from many sources, which brings it closer to consumption in GDP than the household survey. Excluding purchases by foreign tourists, it fell 0.8% in August, and its average for July and August is 1.0% below the second quarter. Unless September brings a strong rebound, consumption will subtract from third-quarter growth. Sentiment is improving, but slowly. The Cabinet Office consumer confidence index stands at 35.5, against 34.9 in July and far below February’s 39.7. The Economy Watchers survey of people in direct contact with customers remains below 50, meaning more of them see deterioration than improvement.
Here we need to correct our own explanation from July. We wrote then that strong wages and weak spending describe different people: those in work and pensioners. That remains a plausible hypothesis, but it is not proven. The wage survey covers employees at firms with five or more staff, while the spending survey covers households of two or more people. The two have different coverage, and without a breakdown of spending by age and household type we cannot say how much of the gap comes from ageing. The simpler explanation is also closer to the data: real wages are growing 1.6%, and that is not enough to offset the loss from dearer food and energy since the start of the war in the Middle East.
The labour market shows where caution sits. Unemployment rose from 2.4% to 2.5%, above the 2.4% expected, and the ratio of job openings to applicants held at 1.18. In services, hiring is the slowest in a year according to the firms themselves in the PMI survey, and some are not replacing staff who leave. Factories are hiring at the fastest pace since 2018, while the services that live on household spending are saving on people.
Is the brake cyclical or structural? Mostly cyclical. Energy, the weak yen and dearer food can recede. The government’s electricity and gas measures are already reducing bills, and the yen was stronger in September than in July. If real wages stay positive, households have room to catch up. Beneath the cyclical layer, however, lies a structural base: an ageing population and a large share of households on fixed incomes. It makes Japanese consumption slow to respond to good news, but on its own it does not explain the decline of the past two months.
Prices: the measures hide the pressure
On the surface, consumer prices are pausing. Headline CPI held at 1.9%. Japan’s standard core CPI, excluding fresh food, eased from 1.8% to 1.7%, below the 1.8% expected, and the measure excluding fresh food and energy stayed at 1.9%. Beneath the surface the picture is different. Energy swung from a 0.6% rise in July to a 0.7% fall in August. The Statistics Bureau of Japan attributes the turn to the start of the government’s programme to ease electricity and gas bills, and it estimates the combined effect of the measures: they cut the annual rate of the headline index by 0.62 point. The largest part, 0.38 point, comes from the removal of the temporary surcharge on petrol tax, and electricity contributes another 0.17. Without the measures, headline inflation in August would have been around 2.5%, not 1.9%. This matters because the measures are temporary and the BoJ looks through them.
Goods prices rose 2.6% and services 1.2%. Services are the part that depends most on wages, and pressure there is still moderate. Surveys of firms, however, say this is changing. Service companies are raising their selling prices at the second-fastest pace in the history of the PMI survey, and for the private sector as a whole selling-price inflation is the fastest since the combined series began almost twenty years ago. Households expect the same. In the BoJ survey conducted in August and early September, 88.6% expect prices to keep rising, although the share expecting a “significant” rise fell from 40.5% to 34.5%.
Further up the chain, pressure remains strong. The CGPI, the BoJ’s index of prices at which firms sell goods to one another, rose 7.6% from a year earlier, above the 7.4% expected. On the month the index fell 0.3%, mainly because of cheaper electricity, gas and petroleum products. Import prices in yen are 25.1% above last year, and in September the CGPI slowed to 6.8%. The gap between the CGPI and core CPI is 5.9 points. It does not measure corporate margins and does not forecast future CPI, because the two indices cover different things with different weights. It shows only that costs along the chain are rising much faster than prices in the shops. Whether firms will pass them on to customers is what the surveys tell us, and they say they will.
The national CPI for September, published on 23 October, shows that the acceleration is not just an effect of administrative charges in Tokyo. Core CPI accelerated from 1.7% to 2.1%, as the market expected, and core-core from 1.9% to 2.4%. The energy measures now cut the headline rate by 0.82 point, so without them it would be around 2.9%. Energy plays almost no part in the acceleration. The lead comes from accommodation and other leisure services, water, processed food and household durables. Water charges are again administrative, but the rest are not. This is September and does not change the phase for August, but it strengthens the tightening bias.
The underestimated detail: managers versus factories
The PMI does not measure how much is produced. It asks several hundred managers whether their output is higher, lower or the same as in the previous month, and a reading above 50 means more of them answer “higher”. That makes the index fast and broad, but it does not measure quantity. Physical volume is measured by the industrial production index of METI, Japan’s Ministry of Economy, Trade and Industry. The manufacturing PMI also has a technical quirk. Longer supplier delivery times push it up, because the survey reads them as a sign of strain. Deliveries around the Strait of Hormuz were slow over the summer, but S&P Global reports that delays eased slightly over the past two months, so the August rise in the index came from orders, not from late lorries.
In August the two measures say opposite things. S&P Global reports the fastest growth in new orders since January 2018 and the strongest quarterly production trend since early 2014. METI reports a 2.4% monthly fall in output, with factory shipments down 2.9%. Average output in July and August is practically equal to the second-quarter average. The gap is not only between the PMI and production. Firms in METI’s own survey expected 6.4% growth in August. METI, which corrects for the systematic optimism of company plans, expected 3.1%, and the market 1.7%. The result was -2.4%. Everyone who asks firms saw growth, and measured output fell.
Why is this underestimated? Because the PMI makes the headlines. It comes out first, has a long history and sounds decisive. And the September survey already offers one explanation: customers who had been stockpiling are starting to run inventories down. If that is right, part of the summer optimism was orders for someone else’s warehouse. The flash PMI for October, published on 23 October, adds a warning. The manufacturing index fell from 54.1 to 53.3, below the 54.5 expected, and its output component grew at the slowest pace since March. Two components, however, are holding the index up for technical reasons: delivery times are lengthening markedly, and firms are building stocks of inputs at the fastest pace in almost four years. Both lift the manufacturing PMI without meaning more demand.
The strongest counter-argument is METI’s forecast. Firms expect growth of 3.2% in September and 3.1% in October, while METI’s adjusted estimate for September is a more modest 1.6%. A rough calculation shows how much rides on September. It assumes the whole index moves like the forecast, although the forecast covers only part of manufacturing. If September comes in at 1.6%, the third quarter will be practically level with the second. If it comes in at 3.2%, it will be about 0.6% above it, and production will catch up with the survey. The preliminary September data are due on 30 October, and the first GDP estimate for the third quarter on 16 November. That will show who was right.
What this means
The August data give the BoJ arguments in both directions. Growth is weaker than the surveys say: output is falling, consumption is shrinking and unemployment is rising. Prices are stronger than the headline index shows: without the temporary measures inflation is around 2.5%, core-core is 1.9%, and wages are growing by close to 4%. The last confirmed quarterly position, for the second quarter, was the most uncomfortable one: growth weakening while inflation pressure builds. August does not change that. What is confirmed is that the core of the engine, chips and the equipment to make them, is growing in volume too, that investment plans were raised, and that households are not spending more. What remains an assumption is whether the summer upswing in the surveys was real growth or stockbuilding, and the answer depends on September production.
Our reading is therefore on hold with a tightening bias. On 18 September the BoJ raised its rate from 1.0% to 1.25% by a vote of 7 to 2. The next meeting is on 29 and 30 October, with a new Outlook Report, the bank’s quarterly forecast report. On 15 October Policy Board member Koeda said underlying inflation is anchoring around 2% and that the bank should not be overly cautious about raising rates. That is the view of one member, not a decision, but it shows where part of the Board is looking. Weak August production is the best argument for a pause in October. If September refutes it, the argument falls away. The real interest rate, the policy rate minus inflation, remains negative: at 1.25% and core CPI of 1.7%, it is around -0.45 point. Monetary conditions still support the economy, as Koeda himself says.
What does this mean for liquidity? Beyond the policy rate, tightening is coming through two more channels. The first is the BoJ’s balance sheet. The monetary base, the money the BoJ creates directly, was 15.7% below last year in August and 15.2% below in September. In the “Outflow” issue of the Global Liquidity Snapshot we described the BoJ’s regime as tightening. Banks, however, are compensating: their lending is growing 5.3% from a year earlier. That is slightly below the 5.4% we cited in “Outflow”, because the August data were revised. The BoJ’s survey of bank loan officers, published on 22 October, shows the same from the banks’ side. Corporate demand for credit is back in positive territory, with an index of 3 against -1 three months earlier, and lending standards are barely changing. Banks are, however, widening the spreads on corporate loans, so credit remains available but is getting dearer. There are also two quieter signals. M1, cash and overnight deposits, was already 0.2% below last year in September. And from 27 November the BoJ will value the longest bonds it accepts as collateral one point lower, which makes liquidity against them slightly more expensive.
The second channel is the bond market. The two-year yield on Japanese government bonds (JGBs), which tracks expectations for the BoJ’s rate, was 1.74% at the end of August and 1.95% at the end of September, and on 22 October it was 1.91%. The ten-year yield was 3.06% at the end of September and 2.91% on 22 October. In the September Credit Pulse, the Japanese two-year yield crossed our warning threshold. The market already prices another hike, and since September some of that bet has been unwound.
The yen remains the main unknown. The average rate fell from 162.45 yen per dollar in July to 158.81 in August and 156.23 in September, and on 23 October it stood at 156.96. The Ministry of Finance reports intervention of 15.4 trillion yen between 30 July and 26 August, which we covered in the July issue. In the following reporting period, to 28 September, there was none. Around the intervention, the yen strengthened by close to 4 yen per dollar. The monthly report, however, does not say in which direction the trades went, so we do not know how much of the appreciation came from the intervention and how much from expectations for the BoJ’s rate. In October the rate has moved between 156 and 158 yen per dollar without a clear direction. The intervention coincided with a stronger yen, but whether it caused it will be shown by the quarterly report with the dates and direction of the trades, expected in early November.
For the ordinary person, the picture is familiar from July. Someone working at a large company is seeing the biggest pay rises in years, and jobs are easy to find. Electricity and petrol bills are temporarily cheaper thanks to the government, but food is not. Someone with a floating-rate mortgage is paying more since the September hike. According to the BoJ, rising wages are absorbing the higher payment for now, but more and more people are stretching mortgage terms beyond 35 years to keep the payment bearable.
Risks in both directions
The strongest argument against our phase is that we give too much weight to one bad month. The manufacturing PMI has signalled improvement for an eighth month in a row. Machinery orders are 18.6% above last year, investment plans were raised, and firms in METI’s survey expect growth of more than 3% in September and October. If that comes true, the third quarter will be stronger than the second, and the August fall in production will look like a pause rather than a plateau. The BoJ’s regional report of 8 October is also more optimistic than we are: all nine regions report a moderate recovery, two raised their assessment and none lowered it, and according to the bank’s branches consumption is holding up despite higher prices.
The downside risk has three sources. The first is inventories. If the destocking that firms describe in the September survey continues, orders will slow just when consumption cannot take up the slack. The second is households. Two more months of real declines in spending would turn consumption into a negative contribution to third-quarter GDP. The third is energy. Government measures hold down bills only temporarily, and if the Middle East pushes oil prices up again, the measures will cost more and purchasing power will fall again. The BoJ’s Financial System Report of 23 October adds a second channel to the AI risk. Japanese banks are lending more and more to foreign funds that finance AI data centres. The share of these loans is still small, but it is growing. If expectations for AI profits fall, the blow will come not only through equipment orders but also through the banks.
There is also an upside risk that is easy to miss. If the yen keeps strengthening, as it did in September, imports will become cheaper, real wages will grow faster and households will get relief without the BoJ doing anything. The cost is slower export growth in value. For the BoJ itself, the risk remains asymmetric. If it waits too long, inflation excluding energy could anchor above target, supported by wages. If it moves too early, just as households are cutting back, it could stall a recovery that has not yet begun.
What to watch
The national CPI for September has already shown core-core at 2.4%, and the final wage data confirmed real growth of 1.6%. On 30 October come preliminary production for September and Tokyo CPI for October. If September production is above 1.6%, METI’s adjusted estimate, output is starting to catch up with the survey. If it is below zero, the plateau becomes a decline. On 29 and 30 October the BoJ decides on rates and publishes its new Outlook Report. On 10 November household spending for September will show whether the decline is continuing.
The thresholds for a change of phase remain the same as in the July issue. Towards acceleration: a positive contribution to GDP from both private consumption and business investment in the third quarter, with the composite PMI above 52. The first GDP estimate is due on 16 November. Towards stagnation: the composite PMI below 50 for two consecutive months, together with a new fall in production. Here we correct one sentence from July. We wrote then that if real household spending stayed negative from a year earlier, the threshold for acceleration would not be met. That does not follow logically, because the household survey is not consumption in GDP, and an annual decline does not rule out quarterly growth. The test is GDP itself.
Closing
Japan’s surveys describe the strongest manufacturing upswing since 2014, METI’s measured output shows a plateau, and between them stand households spending less than last year. The engine is real but narrow, and a growing share of its power comes from price rather than volume. Without the temporary measures, prices are higher than they look, which is why the BoJ is on hold with a tightening bias. We do not yet know whether the summer optimism was growth or inventories. September production on 30 October will give the first answer.
Sources
S&P Global, Japan Services and Composite PMI, September 2026
METI, Commercial Dynamics (retail sales), August 2026, e-Stat
Cabinet Office, GDP for Q2 2026, second preliminary estimate
Statistics Bureau of Japan, national CPI for August 2026, summary of results, e-Stat
Statistics Bureau of Japan, Tokyo CPI for September 2026, preliminary, e-Stat
Statistics Bureau of Japan, Family Income and Expenditure Survey, August 2026
Statistics Bureau of Japan, Labour Force Survey, August 2026
Ministry of Finance, Trade Statistics, September 2026, preliminary
Ministry of Finance, Balance of Payments, August 2026, with export volume and prices
Ministry of Finance, Foreign Exchange Intervention Operations, 30 July - 26 August 2026
Ministry of Finance, Foreign Exchange Intervention Operations, 27 August - 28 September 2026
Bank of Japan, CGPI, September 2026, with revised August figures
Bank of Japan, Statement on Monetary Policy, 18 September 2026
Bank of Japan, speech by Policy Board member Koeda, 15 October 2026
Bank of Japan, Time-Series Data Search: monetary base, M2, lending, USD/JPY
Bank of Japan, Senior Loan Officer Opinion Survey, October 2026
Trading Economics, Japan economic calendar, market consensus
For information and analysis only. Not financial advice.