

July 2011
On 7 July 2011 the European Central Bank raised its main interest rate for the second time in three months, from 1.25% to 1.50%. The reason was oil. Brent averaged $117 a barrel, energy in consumer prices was up almost 12% on the year, and headline inflation in the euro area was 2.6%. Core inflation, meaning prices excluding energy and food, was only 1.2%.
In March, Italian 10-year bonds paid on average 1.66 percentage points more than German ones. That gap is called the spread, and the German bond, the Bund, serves as the yardstick because the market sees it as the safest in the euro area. By November the Italian spread had reached 5.19 points. On 12 November Silvio Berlusconi resigned. The new ECB president, Mario Draghi, cut rates at his very first meeting, and by December had taken them back to where they started.
Fifteen years later the ECB is again raising rates because of oil. In June and September 2026 the deposit rate went from 2.00% to 2.50%. This piece asks whether history is repeating itself, and how far the resemblance goes.
A key for a different lock
This year’s shock comes from supply. The Strait of Hormuz has been almost closed since the end of February. Brent as quoted in the news (the front-month futures contract) averaged $102 a barrel in September and reached $108.75 on 15 September. A physical cargo for immediate delivery cost far more: on EIA spot prices it reached $130.80 the same day, $22 higher. Paper oil and the real barrel parted ways, because the real barrel cannot get through the strait. According to Eurostat’s flash estimate, energy in consumer prices is up 18.8% on the year and headline inflation is 3.8%.
But rate hikes don’t open Hormuz. They work on demand: they make credit dearer, cool spending, and so slow the rise in the price of everything else. On the price of oil that cannot get through the strait, they do nothing. The ECB is trying to unlock a supply shock with a key made for demand. The key does not fit the lock. Turned hard enough, it can break the door at its weakest point.
The ECB itself admits that second-round effects are absent for now. Its statement of 10 September says that wages show no material response to the energy shock at this stage. The data agree. According to Eurostat, wages in the euro area grew 3.0% on the year in the second quarter of 2026, after 3.4% in the first and 4.1% a year earlier. Wage growth is slowing during the oil shock, not speeding up.
The Governing Council nevertheless voted unanimously to raise rates. Lagarde called the decision a “no-brainer”. Asked whether a 2.50% deposit rate was not already at the top of the neutral range (the level at which rates neither stimulate nor hold back the economy), she answered that the ECB does not attach great importance to the neutral rate in the current circumstances. That leaves the door open for the bank to move into territory where rates start holding the economy back, while the shock comes entirely from outside.
September in two phases
The hike of 10 September caused no panic. The month, however, ended in a way that looks more like 2011 than like any year since.
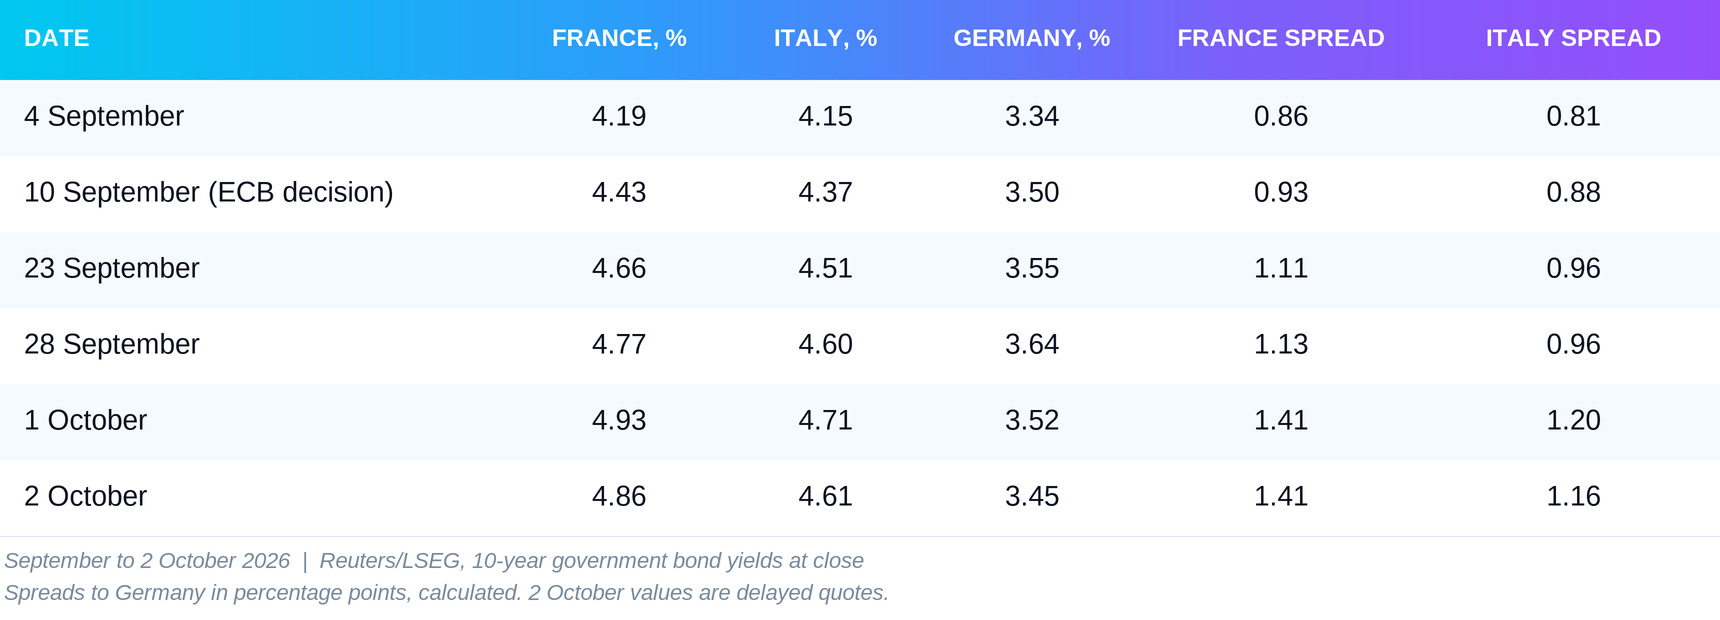
The first phase, from 4 to 28 September, was a general rise in yields. The German 10-year yield rose 0.31 points to 3.64%, and the French and Italian yields by about half a point each. In the two days around the ECB decision alone, 9 and 10 September, the Bund rose 0.14 points and France and Italy about 0.20 each. Spreads widened, but slowly. This was a rate shock for the whole market.
The second phase began on 29 September. The Bund yield turned down, while French and Italian yields kept rising. When a bond’s yield falls, its price rises: investors were buying German debt and selling French and Italian. Over three sessions the French spread jumped from 1.13 to 1.41 points and the Italian from 0.96 to 1.20. This is the signature of 2011: the Bund stops falling in price along with the rest and becomes a safe haven.
On the Bundesbank’s yield curve the Bund reached 3.69% on 28 September, the highest level since April 2011. The French 10-year constant-maturity yield (the Banque de France’s TEC10) reached 4.90% on 1 October. That is the highest since the series began in 2004, above the 4.86% peak of 3 July 2008. On that same day the ECB raised rates for the last time before the crisis.
Spain, so far, is standing aside. According to Banco de España data, the Spanish 10-year yield rose in September almost exactly as much as the German one, so its spread has not moved: against the Bundesbank curve it stayed between 0.35 and 0.47 points through the month. Neither the ECB decision nor the oil peak shifted it. There is no official data yet for 1 and 2 October.
2008 and 2011: the precedent
Twice in the history of the euro the ECB has raised rates against oil-driven inflation. Both times it reversed course within months.
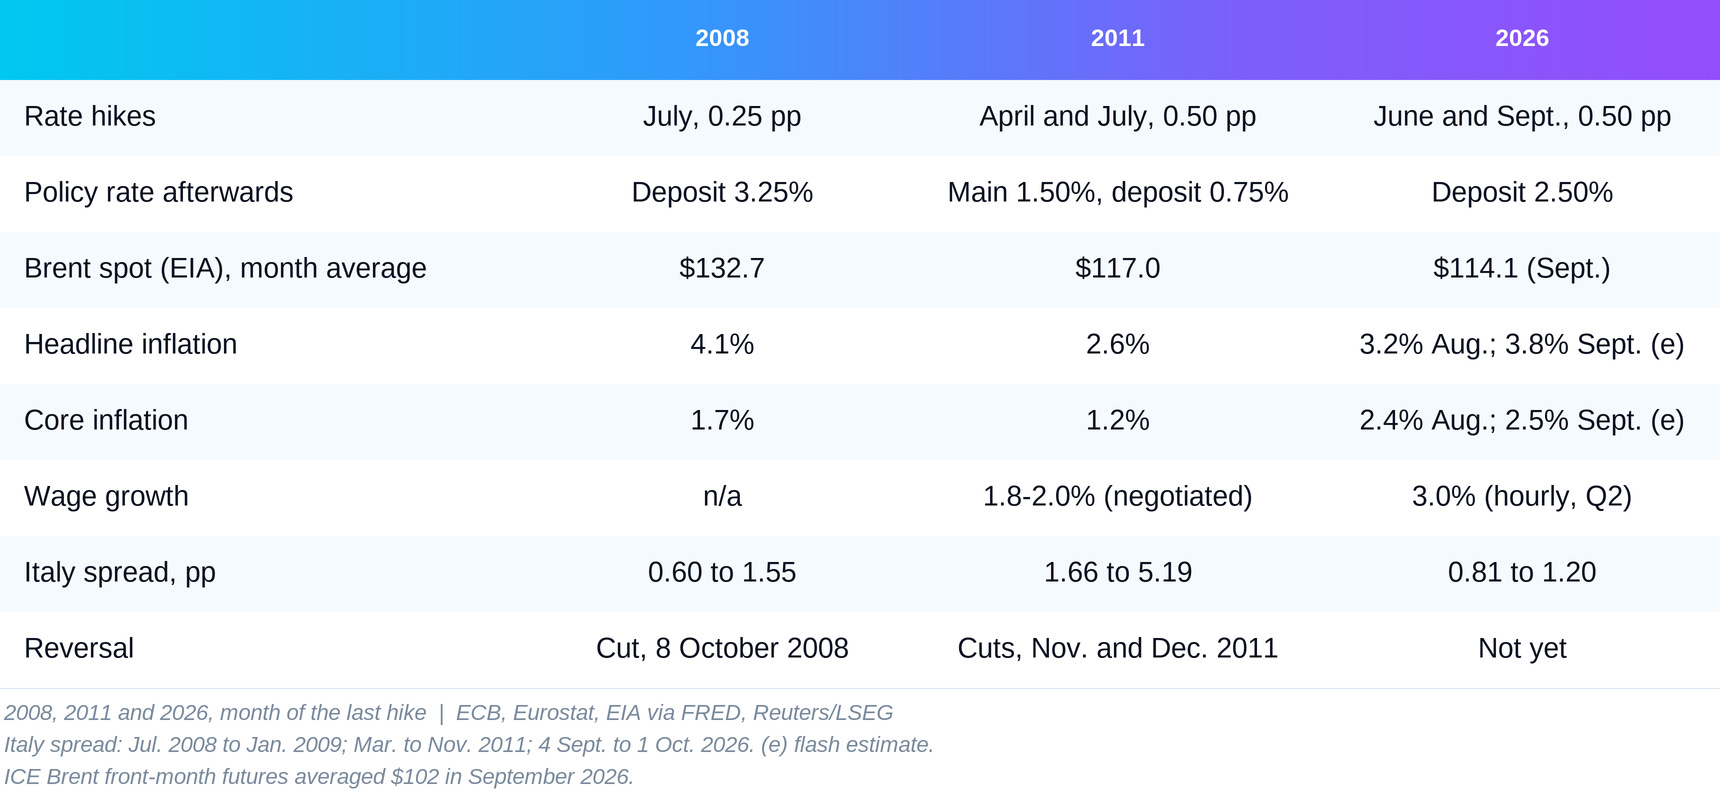
The resemblance to 2011 lies in the mechanism, not the scale. The Italian spread is now 1.20 points. In November 2011 it was above five. But in 2011 too, the widening did not begin with panic. In March, a month before the first hike, the spread was 1.66 points. In July, the month of the second, it averaged 2.72. The jump to 5.19 came over the following four months.
How a rate hike reaches the spread
ECB rates do not directly set the spread between France and Germany. There are three ways in which a hike still gets there.
The first is the interest bill. A heavily indebted state refinances part of its debt every year at the new, higher rates. If the average interest rate on the debt grows faster than the nominal growth of the economy, debt relative to GDP rises on its own, without any new deficit. The bigger the debt, the sooner a rise in rates turns into a budget problem. For Germany, with its low debt, that is a matter of years; for France and Italy it is a matter of the next budget. How exactly this arithmetic works is covered in an earlier piece in this series, The Price of Money and the Weight of Debt, using the United States as the example.
That piece also contains a detail that matters for today’s story. After the Second World War, France and Italy shrank their debt through what is known as financial repression: interest on government debt was held below inflation for years on end, and savers paid the bill. According to research by Reinhart and Sbrancia, as cited by the Federal Reserve Bank of Richmond, between 1945 and 1980 bondholders lost an average of 6.6% a year in real terms in France and 4.6% in Italy. In the euro area that exit is closed: neither Paris nor Rome has its own central bank to hold its interest rates down. That is why the bill shows up in the spread, and why TPI is the only thing that resembles the old exit.
The second is who is buying. Between 2015 and 2022 the largest buyer of European government debt was the Eurosystem itself. Today it is shrinking its portfolio (quantitative tightening). Its assets stand at €5.90 trillion, against a peak of €8.84 trillion in June 2022. The money banks hold in its deposit facility (a rough measure of excess liquidity) has fallen from €2.63 trillion a year ago to €1.96 trillion. New bonds have to find private buyers, and a private buyer demands a higher yield when risk is rising.
The third is the flight to safety. When investors get nervous, they sell the riskier government bonds and buy German ones. That is the second phase of September. In it, the ECB rate is not the trigger but the backdrop: it has made debt dearer for everyone, and then the market starts to distinguish who can afford it.
What weakens the thesis
The parallel with 2011 is strong, but it is not proof. Six things need to be said against it.
Core inflation was above target even before the shock. In 2011 it was 1.2-1.6%, meaning the ECB was raising rates while inflation, excluding oil, was below target. Today core inflation is 2.4-2.5%, and it was already 2.4% in February, before the war. The ECB’s projection has it at 2.6% in 2027. This is the bank’s strongest argument, and it has a logic to it: a second inflation shock within five years is more dangerous to the bank’s credibility than a single shock was in 2011. The hikes are insurance. The premium, however, is paid by the heavily indebted states.
The big widening came while oil was getting cheaper. Brent peaked on 15 September and by 29 September had fallen: the futures contract from $108.75 to $102.59, the physical cargo from $130.80 to $113.96. Spreads widened most after 22 September. If the chain were simply “oil, then the ECB, then spreads”, the move should have come earlier. The final push came from budgets: on 1 October France tabled its draft budget for 2027, and ANSA described the day as one of fear over public finances, “and not only Italy’s”.
Yields are rising around the world. Lagarde said so plainly on 10 September: this is not a euro-area problem alone. Part of the rise in European yields comes from the United States and Japan, and from the enormous financing needs tied to artificial intelligence. That part the ECB can neither cause nor stop.
The levels are far from 2011. A spread of 1.20 points for Italy and 1.41 for France is uncomfortable, but it is not a crisis. Italy today is around the levels it was at in early 2025.
Spain is not taking part. In 2011 Spain was at the centre of the crisis. Today its spread is not moving. That means the market is not punishing the periphery as a whole, but specific states with specific budget problems.
The safeguards are different. In 2011 the ECB had no instrument to intervene against an unwarranted widening of spreads. Today it does: the Transmission Protection Instrument (TPI), created in July 2022. The question is whether it can be used where it is needed. That is the next section.
France: the door that gives first
France pays more than Italy for 10-year debt. Its spread is 1.41 points. On Banque de France and Bundesbank data, which allow a comparison going back in time, it is the widest since May 2012. The state that until recently was seen as the second pillar of the euro is now priced above Italy.
The draft budget for 2027 was presented on 1 October. The spread widened by almost 0.15 points that day. France has been in the excessive deficit procedure since July 2024. The presidential election is in spring 2027. At the 10 September press conference a journalist asked Lagarde about a political proposal to freeze or cancel part of France’s debt. She replied that it would be a breach of the Treaty. On the widening of spreads itself, she said she would not comment.
This is where TPI comes in. Under the 2022 criteria, a state can receive support if it complies with the EU fiscal framework: it must not be in an excessive deficit procedure or, if it is, must not have been assessed as failing to act on the Council’s recommendations. France is in the procedure. So support depends on whether Brussels judges that it is following the recommendations. The instrument exists on paper. Its first real test may be France, and in the middle of a presidential campaign.
In one sense this is a harder situation than 2011. Back then the ECB had to invent an instrument. Now it has to decide whether to use it for the second-largest economy in the euro area, when its own rules give it grounds to say no.
What to watch
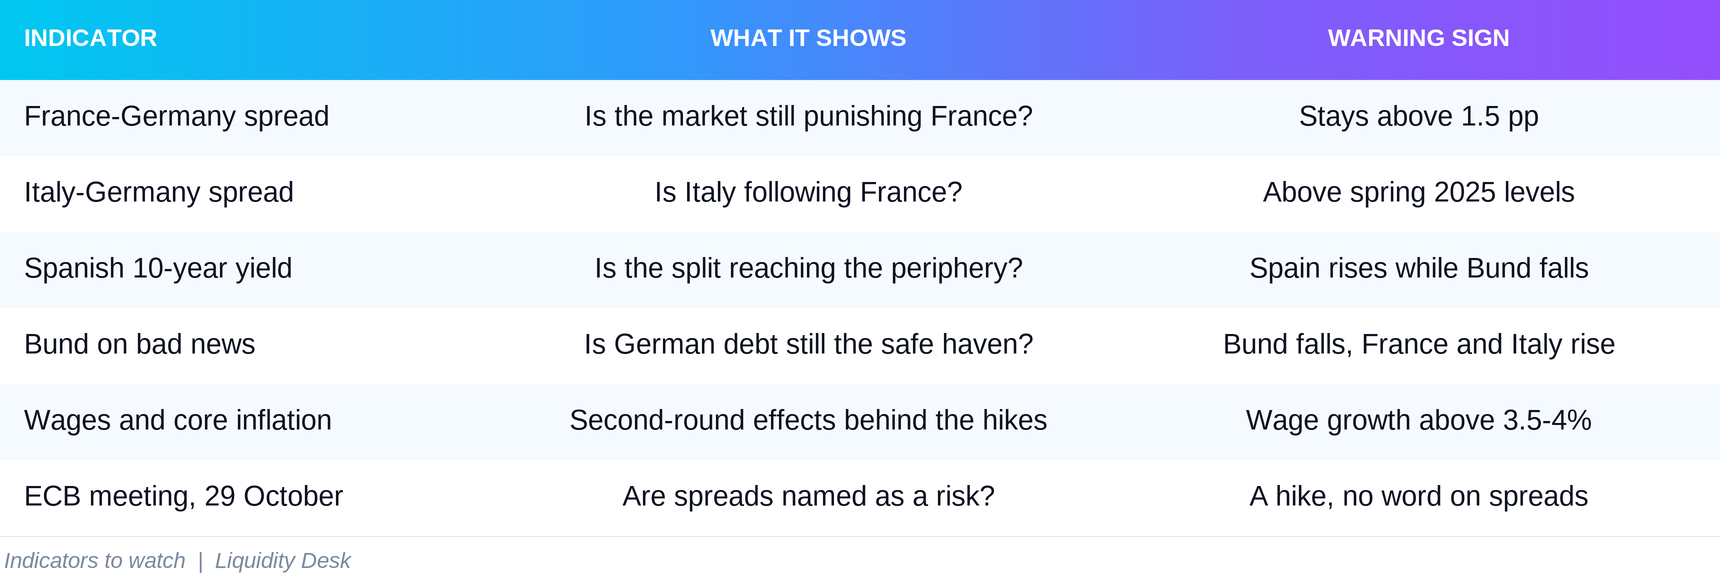
For now the market is discriminating. It is punishing France and Italy, not Spain, and not the whole periphery. This is 2011 in embryo, not in full swing. The decisive moment will be whether the ECB keeps raising rates while the Bund rallies as a safe haven. At that point the key is no longer cooling demand. It is breaking the door.
This is analysis, not a trade recommendation. If the thesis is right, though, the mistake will show first in expectations of further hikes: as in the autumn of 2011, they would have to be priced out.
Conclusion
In 2011 the ECB raised rates against oil it could not control, and between March and November the Italian spread tripled. In 2026 it is doing the same, with higher core inflation and more safeguards. Those differences are real, and they make today’s decision easier to defend than the one back then.
The mechanism, however, is the same. Rate hikes do not bring down the price of oil. They make debt dearer for everyone, and then the market chooses whom to punish. In the last days of September and the first days of October, it started choosing.
Rate hikes don’t open Hormuz. But they can open spreads.
Sources
ECB, key interest rates, deposit facility and main refinancing operations, daily series
FM.D.U2.EUR.4F.KR.DFR.LEVandFM.D.U2.EUR.4F.KR.MRR_FR.LEV: https://data.ecb.europa.eu/data/datasets/FMECB, euro area HICP (headline, excluding energy and food, energy), annual rate of change, to December 2025: https://data.ecb.europa.eu/data/datasets/ICP
Eurostat, HICP
prc_hicp_minr, EA21, to the September 2026 flash estimate (updated 2 October 2026): https://ec.europa.eu/eurostat/databrowser/view/prc_hicp_minr/default/tableEurostat, labour cost index
lc_lci_r2_q, wages and salaries, EA21 (updated 16 September 2026): https://ec.europa.eu/eurostat/databrowser/view/lc_lci_r2_q/default/tableECB, negotiated wage indicator
STS.Q.U2.N.INWR.000000.3.ANR: https://data.ecb.europa.eu/data/datasets/STSECB, monthly long-term interest rates by country
IRS.M.{cc}.L.L40.CI.0000.EUR.N.Z: https://data.ecb.europa.eu/data/datasets/IRSECB, Eurosystem weekly financial statement (total assets, deposit facility), ILM dataset: https://data.ecb.europa.eu/data/datasets/ILM
ECB, Monetary policy statement and press conference, 10 September 2026: https://www.ecb.europa.eu/press/press_conference/monetary-policy-statement/2026/html/ecb.is260910~6a45359cfc.en.html
ECB, Monetary policy statement and press conference, 11 June 2026: https://www.ecb.europa.eu/press/press_conference/monetary-policy-statement/2026/html/ecb.is260611~372040d313.en.html
ECB, “The Transmission Protection Instrument”, press release, 21 July 2022: https://www.ecb.europa.eu/press/pr/date/2022/html/ecb.pr220721~973e6e7273.en.html
EIA via FRED, Brent spot price, daily
DCOILBRENTEU: https://fred.stlouisfed.org/series/DCOILBRENTEUReuters/LSEG, ICE Brent Crude Energy Future, front month
LCOc1, one-year table viewed 3 October 2026: https://www.reuters.com/markets/quote/LCOc1/Reuters/LSEG, 10-year yields
FR10YT=RR,IT10YT=RR,DE10YT=RR, one-month tables viewed 3 October 2026: https://www.reuters.com/markets/quote/FR10YT=RR/Deutsche Bundesbank, yield on the federal securities curve, 10 years, daily
BBSIS/D.I.ZST.ZI.EUR.S1311.B.A604.R10XX.R.A.A._Z._Z.A: https://www.bundesbank.de/en/statistics/time-series-databasesBanque de France, Webstat, TEC10
FM.D.FR.EUR.FR2.BB.FRMOYTEC10.HSTAand monthly benchmark yields by country:
https://webstat.banque-france.fr/
Banco de España, table
ti_1_3, 10-year bonds on the secondary market, seriesD_G0B1F0ZP: https://www.bde.es/webbe/es/estadisticas/compartido/datos/csv/ti_1_3.csvANSA, daily reports on the BTP-Bund spread, 2 September to 2 October 2026, e.g. 1 October 2026: https://www.ansa.it/sito/notizie/economia/2026/10/01/lo-spread-btp-bund-conclude-la-giornata-in-aumento-a-1185-punti_d1f1e887-e2b4-4e76-8174-cf9c9824f29f.html
Ministère de l’Économie, press conference presenting the PLF and PLFSS 2027, 1 October 2026: https://presse.economie.gouv.fr/ip-conference-de-presse-presentation-du-plf-et-plfss-2027-jeudi-1er-octobre-2026/
Liquidity Desk, “The Price of Money and the Weight of Debt”, 30 June 2026: https://liquiditydesk.org/p/the-price-of-money-and-the-weight
Federal Reserve Bank of Richmond, “A Look Back at Financial Repression”, Econ Focus, 2021 (citing Reinhart and Sbrancia)
ECB, Meetings of the Governing Council (monetary policy meeting of 28-29 October 2026): https://www.ecb.europa.eu/press/calendars/mgcgc/html/index.en.html
Liquidity Desk | liquiditydesk.org