

June 16, 2026
Central Thesis
Last night Trump posted on Truth Social: "The deal with the Islamic Republic of Iran is now complete. Hormuz will open." Oil markets reacted instantly: WTI fell more than 5% in two days and now stands at $80.78 per barrel. The average price of regular gasoline at American pumps slipped to around $4.07 per gallon per AAA data from June 14, down from the $4.55 peak on May 21. The media is calling it the end of the shock.
Just look at Urea. The price of fertilizers has crashed 33.78% in a single month to $372.50 per ton. Not because Hormuz opened. But because American farmers stopped buying fertilizers three months ago when their margins collapsed. Fewer fertilizers means lower yields. Lower yields mean less grain. And that is precisely why CBOT Wheat stands at $584 after the diplomatic deal, not at $500.
Oil heard the deal. Grain is watching the harvest.
The American Energy Position: From Shock to Deal
From February 28, 2026, when the news of US-Israeli strikes on Iran broke, commodity markets operated in permanent crisis mode. The Strait of Hormuz was effectively closed from March 4. Three and a half months later came the reversal: on June 15, Trump announced the end of the war and the immediate lifting of the naval blockade.
The reaction was symmetrical to the shock. WTI fell from $107-108 at the start of May to $80.78 today. Brent is at $82.98. We are talking about a correction of around 25% in less than six weeks. The NYMEX HO futures contract, officially called NY Harbor Ultra-Low Sulfur Diesel (ULSD) and the pricing benchmark for diesel fuel in America, is at $3.25 per gallon, down nearly 21% in the last month alone. The RBOB Gasoline futures contract on NYMEX stands at $2.95, which is the wholesale price traded on the exchange. The actual price American drivers pay at the pump averages around $4.07 per gallon per AAA data from June 14, down from the $4.55 peak on May 21. The gap between the two figures covers federal and state fuel taxes, distribution costs, and retailer margin.
Markets are skeptical, however. Neither Washington nor Tehran has released the text of the memorandum. The signing ceremony is scheduled for Friday, June 19, in Switzerland. Shipping companies are waiting for independent confirmation before sending tankers through. Sea mines remain in the strait. Gulf producers who shut in output due to lack of storage need weeks to restart. Israel continues military operations in Lebanon independently of the US-Iran framework. It was precisely Lebanese escalation that caused the April ceasefire to collapse.
Physical oil does not flow simply because a document has been signed.
One number in the dashboard moves in the opposite direction: Henry Hub Natural Gas at $3.18 per MMBtu, up 5% for the month. The American domestic gas market is partially isolated from Hormuz, because natural gas cannot easily leave the country without liquefaction at LNG export terminals. But that isolation is shrinking: US LNG export terminals ran at full capacity throughout the crisis, delivering record volumes to Europe and Asia. The more LNG terminals that are built, the tighter the link between Henry Hub and global prices. For now, American households pay far less for heating than their European counterparts. But the structure is changing.
US Commodity Dashboard - June 2026
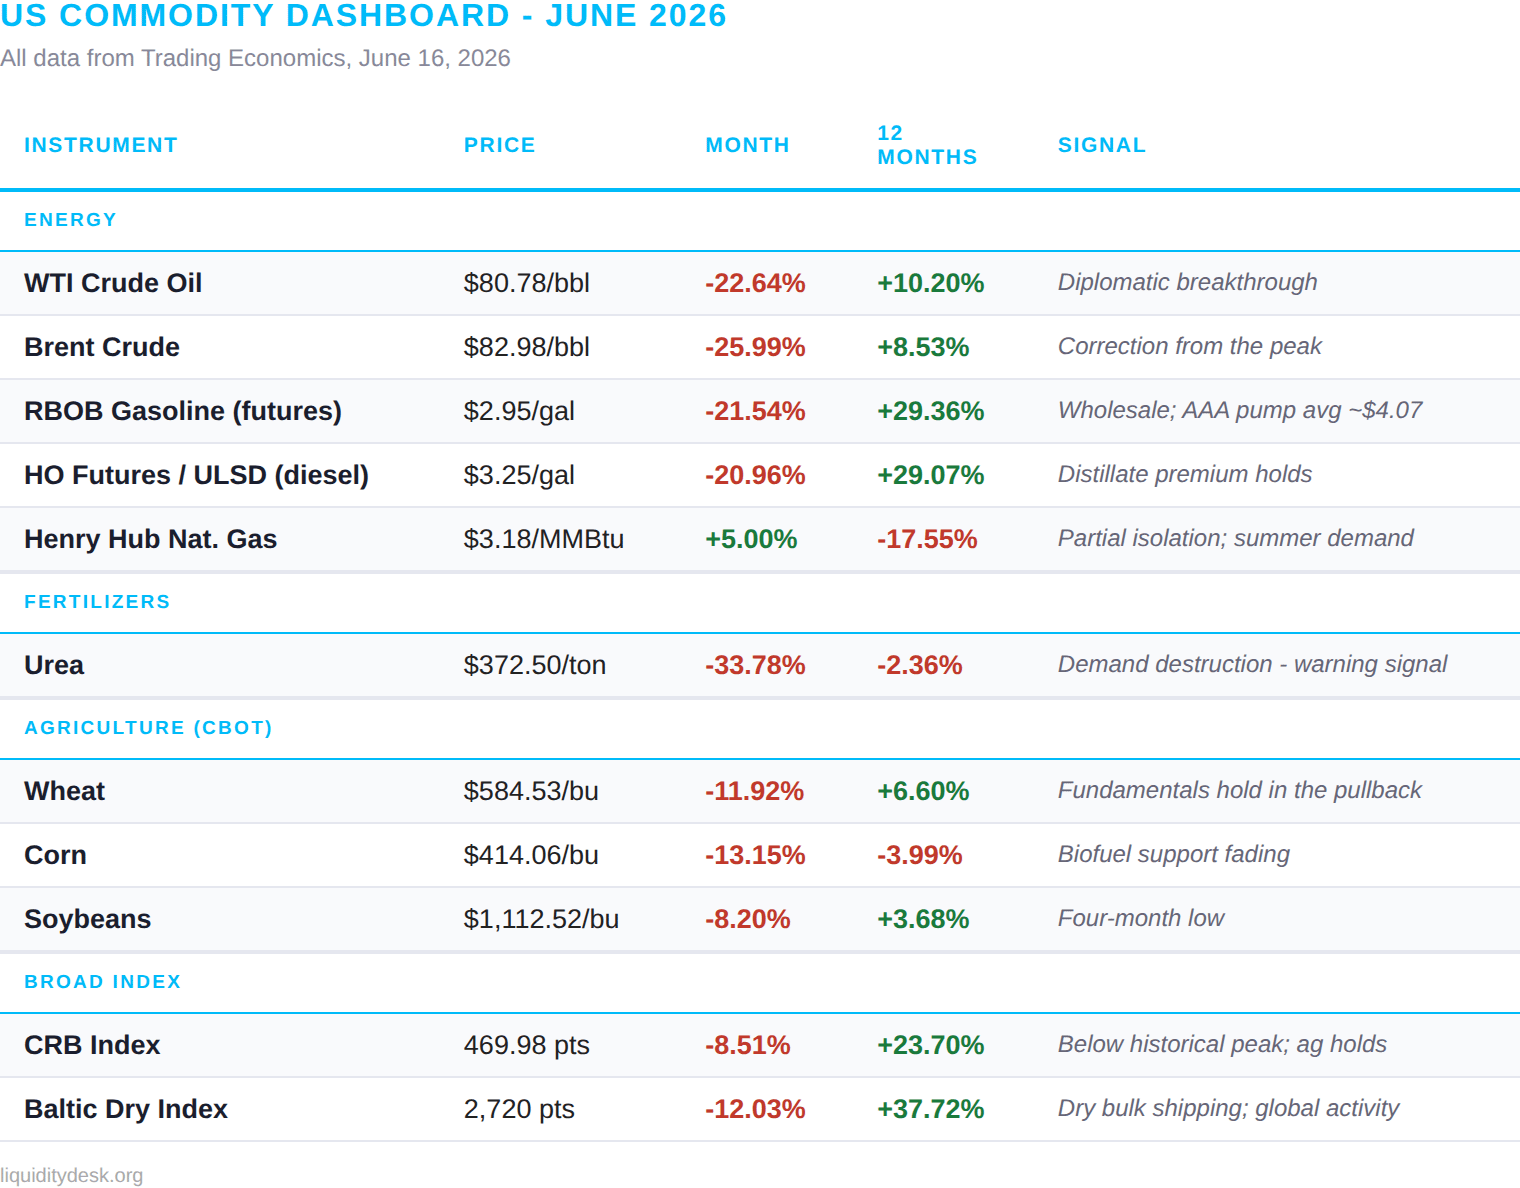
Three observations from the dashboard. First, the monthly columns are entirely red for energy. The correction is broad and fast. Second, the annual columns for energy are still green: oil is +10%, ULSD/diesel is +29%, gasoline is +29%. The fact that prices fell from May peaks does not mean the shock has disappeared for those who were paying bills in real time. Third, the CRB Index at 469.98 is weighted 41% agriculture and 39% energy, which is why a 22% oil correction translates into only an 8.5% decline in the full index. The agricultural component is holding.
The Transmission Chain: Three Months Later
Channel 1: WTI / Gasoline - The Political Ceiling Fell
The average price of regular gasoline at American pumps is around $4.07 per gallon per AAA data, down from $4.55 on May 21. Trump received the political relief he was looking for: the price is moving down. But the mechanism matters. Gasoline did not become cheaper because physical supply improved. It became cheaper because markets are pricing in the future opening of Hormuz. If the June 19 signing fails, or if Israel strikes Lebanon this week, WTI could be back above $95 within days. All market positions have already been reoriented toward the normalization scenario. Disappointment would be asymmetric and painful.
Channel 2: ULSD / Logistics - The Delayed Echo Still Echoes
The NYMEX HO futures contract, traded under the ticker HO and officially known as NY Harbor Ultra-Low Sulfur Diesel (ULSD), is the pricing benchmark for diesel fuel in America. At $3.25 per gallon it is down from the May peak around $4.30, but still 29% above year-ago levels. Approximately 70% of all goods in the United States are transported by truck. Every truck runs on diesel.
Track the lag. Diesel was expensive from March through the end of May. Transport contracts reflect fuel costs with a 6-to-10-week delay into the Consumer Price Index. The May CPI showed 4.2%, with energy accounting for more than 60% of the monthly increase. The June CPI, published in July, will be the first reading where the visible cheapening of oil starts to push back against embedded logistical inflation. The two forces will meet there.
The Baltic Dry Index at 2,720 points provides useful context. The BDI measures freight rates specifically for dry bulk cargo: grain, iron ore, coal. It does not include oil tankers, which have their own separate indices. The elevated BDI level, still +37.72% year-on-year, tells us that global demand for raw material shipping remains elevated even as the acute oil shock begins to ease.
Channel 3: Urea - The Critical Warning
Urea is a nitrogen fertilizer produced through a two-step industrial process. First, natural gas is converted into ammonia through the Haber-Bosch process, in which atmospheric nitrogen reacts with hydrogen under high temperature and pressure. The ammonia then reacts with carbon dioxide to produce urea in granular form for direct soil application. Because natural gas is the primary feedstock for ammonia production, any rise in gas prices raises fertilizer costs within weeks.
Urea at $372.50 per ton is the number that deserves attention. In the May analysis we set two key levels: $500 as a demand-stabilization floor and $480 as a warning. Reality exceeded both: Urea is down 33.78% in a single month and has fallen more than 50% from its March peak around $750.
The problem is not the price. The problem is the quantity that went into the ground. The farmer who stopped buying fertilizer in March and April cannot take it back. Nitrogen is embedded in yield. Less nitrogen means less protein in the grain, weaker stalks, lower bushels per acre. These consequences appear at harvest, not today. Read the Urea collapse not only as a signal that the shock has passed, but as a leading indicator for weaker harvests in late 2026 and early 2027, with a 3-to-6-month lag.
Channel 4: Biofuels - The Fading Support
In the May analysis we described how EPA mandates for bioethanol and biodiesel placed a floor under corn and soybeans when oil was expensive: at $102 WTI, grain-based biofuels were economically competitive and sustained energy-sector demand. At $80 WTI the picture changes. The price competitiveness of bioethanol narrows. The EPA mandates remain legally binding, preventing a full collapse of biofuel demand. But the incremental demand above the mandated minimum disappears. Corn at $414 and down 13.15% for the month partially reflects this reality.
Wheat Held. Here Is Why It Matters.
Compare the monthly corrections: WTI -22.64%, Gasoline -21.54%, ULSD/Diesel -20.96%. Wheat: -11.92%. Corn: -13.15%. Soybeans: -8.20%. Grain has corrected roughly half as much as oil. If wheat had followed oil proportionally, CBOT Wheat should be around $520. It is at $584. That difference of roughly 64 cents per bushel is the market saying there is something in grain that the oil deal cannot resolve.
That something is the harvest.
The USDA June report, published on June 12, 2026: winter wheat 2026-27 is projected at 1.03 billion bushels, down 27% from last year and the smallest crop since 1965. Hard Red Winter, the Great Plains variety and the backbone of American exports, is down 38% from last year's level. Only 25% of winter wheat is rated good-to-excellent, the weakest reading for this point of the year in recorded history.
The Hormuz deal can put fertilizer back in the stores. It cannot put rain back into Kansas.
Look at the wheat forward curve: July 2026 approximately $584, September 2026 approximately $598, December 2026 approximately $615, March 2027 approximately $629. The curve is in contango, each successive delivery more expensive than the last. The market is pricing more expensive grain in the future not because it expects a new geopolitical crisis, but because it sees the math: 1.03 billion bushels of supply against 960 million bushels of domestic food use alone. The margin is razor-thin.
The CRB Index in Historical Context: Correction or Reversal?
The CRB Index at 469.98 points, weighted 41% agriculture and 39% energy, is below the historical peak of 516.28 reached during the height of the Hormuz crisis, but still 23.70% above year-ago levels. The distinction between a correction within a cycle and a full cycle reversal is fundamental.
In a correction within the cycle, oil falls from $110 to $80 and stabilizes, grain holds on harvest fundamentals, inflation remains moderately elevated. In a full reversal, oil falls to $60-65, grain follows, CRB returns below 400, and inflation normalizes rapidly. The conditions for a full reversal are not in place: the Fed is not hiking aggressively, global demand has not collapsed, and Hormuz is not yet physically open.
The three historical precedents from the May analysis remain valid reference points. The 2008 crash from 470 to below 200 was triggered by a credit collapse, not a geopolitical resolution. The 2022 correction from 330 followed the most aggressive Fed rate hiking cycle since 1980. Today the Fed is holding at 3.50-3.75%. The structural conditions for a full cycle reversal are absent. Base case: CRB consolidates in the 450-480 range while physical Hormuz reopening progresses over July and August.
The Federal Reserve: A New Chair, The Same Dilemma
The FOMC meeting is today and tomorrow, June 16-17, 2026, and is the first chaired by new Federal Reserve Chair Kevin Warsh. Markets expect rates to be held at 3.50-3.75% with over 96% probability.
May CPI came in at 4.2% year-on-year, three times the Fed's 2% target. Energy accounts for a 23.5% year-on-year increase and for more than 60% of the monthly rise. But Core CPI, stripped of food and energy, was only +0.2% month-on-month, below forecast. Underlying inflation has not broken free. Only the energy shock is stretching it.
The May PPI data adds an important dimension. Producer prices rose 6.5% year-on-year in May, the fourth consecutive month of acceleration and the highest reading since November 2022, beating the consensus of 6.4%. PPI Ex Food, Energy and Trade jumped to +0.80% month-on-month, up sharply from +0.50% in April. PPI matters here not as a standalone headline but as a leading indicator: producer prices transmit into consumer prices with a 4-to-8-week lag. Even if oil normalizes after the Hormuz deal, the pipeline of embedded production costs from March through May is already in the system and will continue to feed into June and July CPI readings. If PPI remains at 6-7%, services and manufacturing inflation will persist regardless of what happens to oil.
Warsh inherits the classic supply shock trap. Raising rates to fight 4.2% inflation would hit an economy with rising unemployment at 4.3% and downward-revised GDP. Holding risks inflation expectations becoming unanchored if Hormuz escalates again. The oil deal from yesterday is the best news the Fed has received since the conflict began. If prices normalize, the June CPI published in July could come in below 3.5%, giving Warsh room to hold without political pressure. But only if the agreement holds.
What We Are Watching: July Signposts
Confirming Signals - Scenario A: Grain Decouples from Oil
CBOT Wheat above $600/bu after the June 19 signing: if wheat does not follow oil lower after the official ceremony, the harvest fundamental is the dominant force.
HO/ULSD futures above $3.00/gal: holding above this level confirms that distillate inflation is embedded in transport contracts and continues feeding Services CPI.
Urea stabilizing above $380/ton: any further decline pushes the fertilizer market into historically low territory and embeds a new yield threat into the 2027 crop.
USDA Acreage Report on June 30: a confirmed shift from corn to soybeans driven by lower fertilizer requirements would give corn additional fundamental support and apply further pressure to soybeans.
Warning Signals - Scenario B: Broad Commodity Correction
WTI below $70/bbl: a sharp move through this level would price in full Hormuz reopening, Gulf production restart, and global recessionary slowdown simultaneously. Grain would follow.
Urea below $330/ton: historically extreme territory associated with severe contraction in fertilizer application and planting area reductions for the following season.
Lebanon-Israel escalation after June 19: if Iran suspends Hormuz access in response to a new Israeli operation, markets will react more sharply than in any previous session because all positions are now oriented toward normalization.
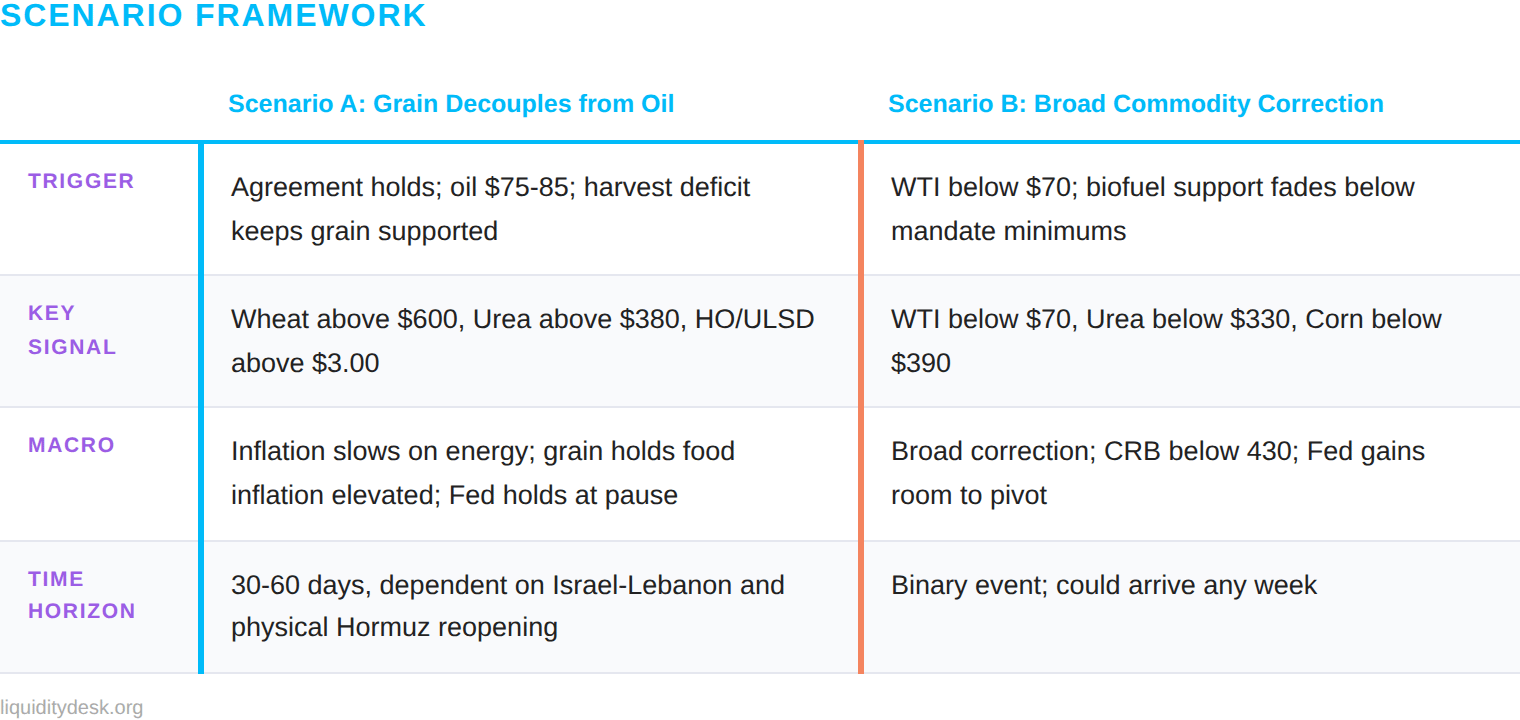
The base case remains Scenario A. The diplomatic deal is real, but implementation is slow and uncertain. Grain has its own argument, independent of Hormuz: 27% less wheat than last year, a 38% collapse in Hard Red Winter, Urea down more than 50% from its peak with embedded yield consequences. These numbers are not cancelled by a Truth Social post.
Oil heard the deal. Wheat is watching Kansas.
Next Issue - July Monthly Commodity Snapshot
The July edition will assess whether the physical opening of Hormuz is confirmed or another disappointment. Key questions: Was the June 19 signing confirmed? Is oil actually flowing from the Persian Gulf in meaningful volumes? Does the June CPI, published in July, show the beginning of energy disinflation? And perhaps most importantly: after the Hard Red Winter wheat harvest, do actual yields confirm the worst USDA forecast since 1965?
This publication is for informational and educational purposes only. Nothing herein constitutes investment advice or a solicitation to buy or sell any financial instrument. Past performance is not indicative of future results. Always conduct your own research before making any investment decision.