

Central banks are withdrawing base liquidity, but bank credit is still carrying the move. China shows where the connection breaks.
Introduction
August ended with the Nasdaq 100 up 4.18%, the Shanghai Composite up 4.02%, KOSPI up 3.40% and the Nikkei 225 up 3.03%. The S&P 500 added 2.62%. On the surface, the month looked like a straightforward expansion in risk appetite.
But the Russell 2000 gained only 0.86%, while the Hang Seng lost 1.23%. Large technology companies and parts of Asia led. Smaller US companies and Hong Kong lagged. The move was higher, but it was not broad.
Liquidity has not travelled only along the main road for a long time.
Net Fed Liquidity fell by $46.6 billion. The Eurosystem continued to run down its portfolios. Japan’s monetary base contracted by 15.7% over the year. The People’s Bank of China withdrew a net CNY 408.6 billion through its listed instruments in August.
Markets kept moving because the long-established detour through bank credit still works. US banks increased loans and leases by $108.4 billion between 29 July and 26 August. Corporate and household credit in the euro area is also growing. Japanese bank lending is up 5.4% over the year despite the contraction in the monetary base.
The question this month is how long the banking channel can offset the contraction at central banks. And what happens when a central bank balance sheet grows but credit does not follow. China already provides the answer.
Central Banks
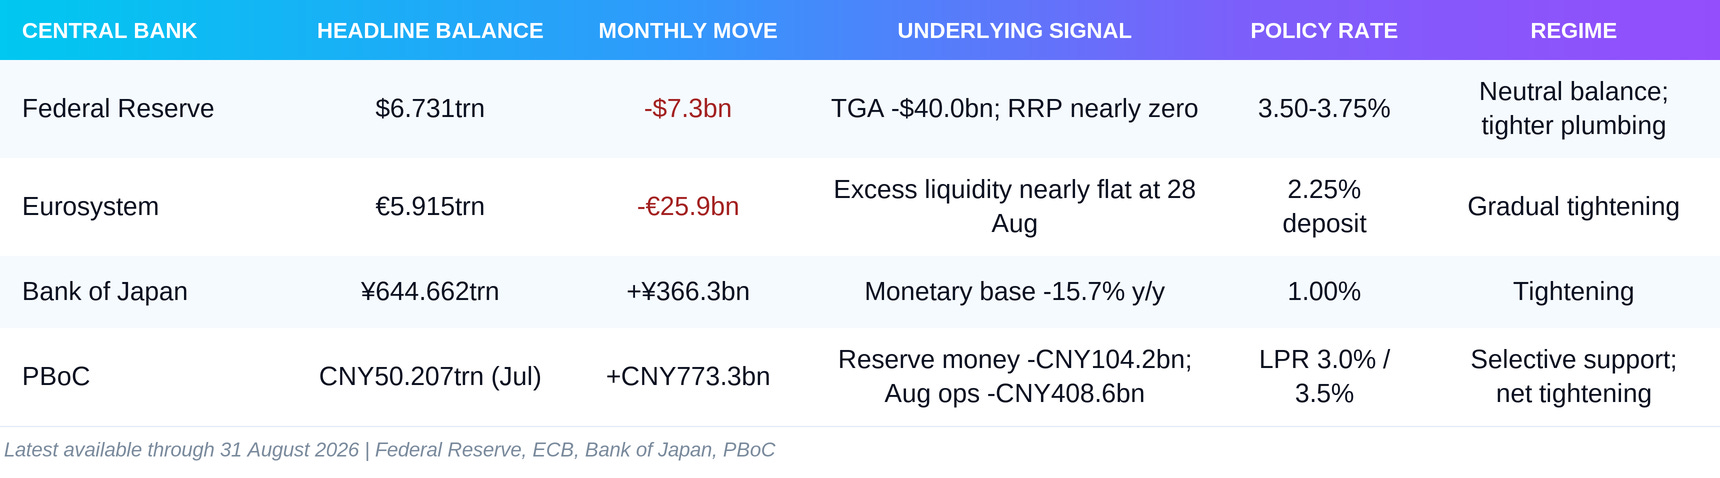
The headline balance sheets are misleading this month. The Fed and the Eurosystem look almost stationary. The balance sheets of Japan and China are growing. Underneath them, though, reserves, the monetary base and operating flows point to less base liquidity, not more.
Federal Reserve
The Fed balance sheet stands at $6.731 trillion as of 27 August, against $6.738 trillion on 30 July. The decline is only $7.3 billion. With quantitative tightening over, this is not a renewed run-off programme. The balance sheet is effectively neutral.
The Treasury account is moving in the opposite direction. Its weekly average rises from $910.8 billion to $950.7 billion. Only $456 million remains in overnight reverse repo. Almost the entire monthly decline in net liquidity therefore comes from the Treasury rebuilding its cash position, not from the Fed balance sheet.
The target range remains 3.50 to 3.75% after the 29 July decision. The vote was 9 to 3, with all three dissenters preferring a 25 basis point increase.
Regime: neutral balance sheet, tightening plumbing. The Fed is not actively running down assets, but the Treasury is withdrawing more liquidity than the balance sheet returns.
European Central Bank
The Eurosystem balance sheet falls from €5.941 trillion to €5.915 trillion between 31 July and 28 August. Of the total €25.9 billion decline, €24.7 billion comes from securities held for monetary policy purposes. Lending operations fall by a further €3.8 billion.
There is no large accounting revaluation to explain the move this time. Revaluation accounts remain at €1.208 trillion and the value of gold changes by only €18 million.
Excess liquidity does not confirm sharp tightening, however. It stands at €2.149 trillion on 28 August, almost unchanged from 31 July. The reading for 31 August is €2.142 trillion, a monthly decline of €6.1 billion. The choice of end date matters more than the move itself.
The deposit facility rate remains 2.25%, the main refinancing rate 2.40% and the marginal lending rate 2.65%. APP and PEPP portfolios continue to decline as principal payments are no longer reinvested.
Regime: gradual tightening. The portfolios are running off, but available excess liquidity is still almost stationary.
Bank of Japan
The Bank of Japan balance sheet grows by ¥366.3 billion in August to ¥644.662 trillion. That looks like easing until the layers beneath the headline total are examined.
Banks’ current account deposits at the central bank fall by ¥13.690 trillion. The average monetary base declines from ¥554.926 trillion to ¥543.007 trillion, while its annual contraction deepens from 13.8% to 15.7%. The increase in assets is not reaching the system’s core reserve layer.
The policy rate remains at 1.0% after an 8 to 1 vote. The regime is therefore defined by quantities, not by the unchanged rate.
Regime: tightening. The balance sheet is larger, but the monetary base and bank deposits at the central bank are smaller.
People’s Bank of China
The latest published PBoC balance sheet is for July. Assets rise by CNY 773.3 billion to CNY 50.207 trillion. The main reason is a CNY 620.4 billion increase in claims on deposit-taking institutions.
The headline balance sheet misleads here too. Reserve money falls by CNY 104.2 billion, while deposits of financial institutions within reserve money decline by CNY 219.7 billion. Government deposits rise by CNY 735.6 billion. More central bank assets do not automatically mean more usable bank reserves.
August operations complete the picture. The medium-term lending facility and reverse repo at other maturities provide a net CNY 100 billion. Government bond purchases add CNY 50 billion and treasury cash management adds another CNY 70 billion. Against that stand a CNY 641.5 billion withdrawal through overnight and seven-day reverse repo, CNY 100 billion through the medium-term lending facility and CNY 52.1 billion through pledged supplementary lending. The sum of all listed instruments is a net withdrawal of CNY 408.6 billion.
The one-year loan prime rate remains at 3.0% and the five-year rate at 3.5%.
Regime: selective support, but net tightening across the listed operations. The PBoC is extending the maturity of some liquidity without increasing the total monthly flow.
Central Bank Synthesis
Money and Credit Transmission
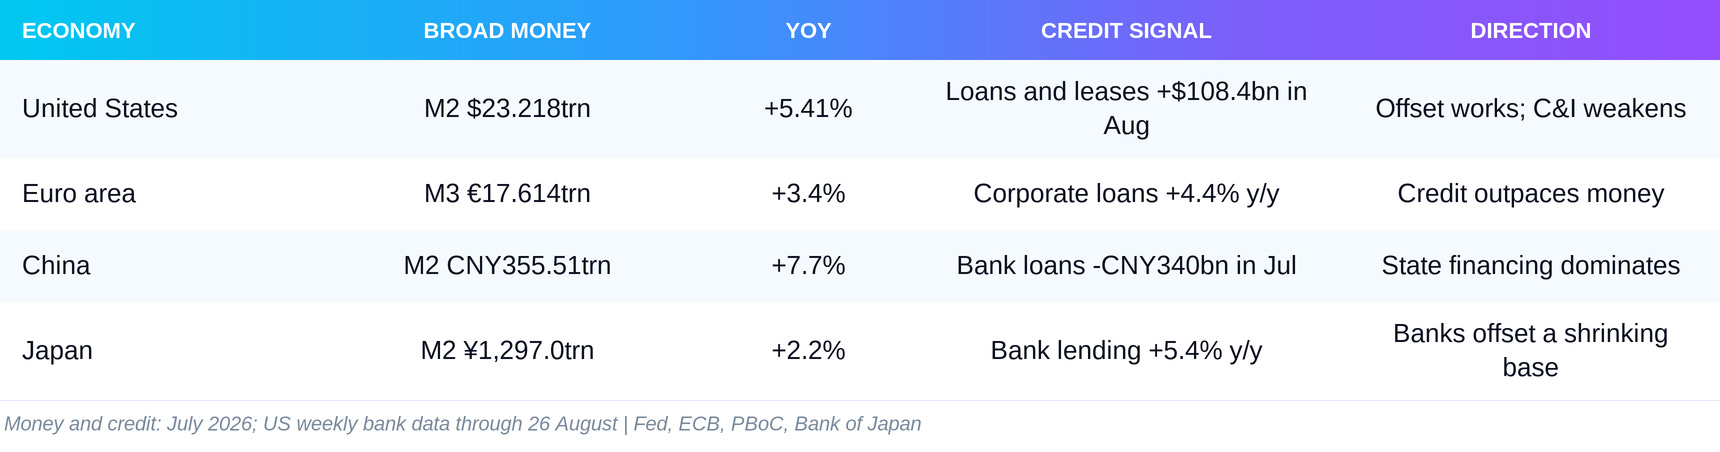
The main route from central banks is narrowing. The banking channel still works in three of the four systems. The contrast is clearest between the United States and China.
United States
US M2 reaches $23.218 trillion in July, after a monthly increase of $102.8 billion. That is a rise of 0.44% for the month and 5.41% over the year.
Commercial and industrial loans give a weaker signal. They fall by 0.20% in July to $2.899 trillion after four consecutive months of slowing growth. The monthly rate declines from 1.36% in March to 1.28% in April, 1.01% in May, 0.58% in June and -0.20% in July.
The weekly picture for August is stronger. Between 29 July and 26 August, bank loans and leases rise by $108.4 billion, while deposits increase by $191.2 billion. Total bank credit grows by $62.1 billion because banks simultaneously reduce their securities holdings by $46.3 billion.
The banking offset has not disappeared. Its composition has changed. Credit to businesses weakens in the monthly series, but total loans accelerate in August, funded by stronger deposits and a smaller securities portfolio.
Euro Area
M3 is effectively stationary. The nominal stock falls by €1.0 billion in July to €17.614 trillion, while the adjusted monthly rate is positive by 0.005%. The annual rate still accelerates to 3.4%.
Credit is growing faster than the money supply. Loans to non-financial corporations add €25.5 billion in July to reach €5.456 trillion and accelerate to 4.4% over the year. Household loans increase by €18.4 billion to €6.990 trillion and grow by 3.1% over the year.
Companies continue to raise money through bonds as well. Net issuance is positive by €5.9 billion in July, though below the €11.0 billion recorded in June. This does not prove that bank credit is replacing bonds. It shows that both channels remain open.
The ECB bank lending survey supplies the constraint. A net 7% of banks tightened standards for companies, while net demand for loans increased by 3%. Credit is expanding, but the entrance to it is becoming slightly narrower.
China
China is where the detour breaks down. M2 falls by CNY 1.20 trillion in July to CNY 355.51 trillion, while its annual rate slows from 8.0% to 7.7%.
Total social financing, the broadest measure of credit reaching the economy, adds approximately CNY 1.41 trillion. Government bonds account for CNY 1.32 trillion of that amount. Without this component, the remaining net flow is only around CNY 90 billion.
Renminbi bank loans fall by CNY 340 billion during the month. Household loans decline by CNY 460.3 billion. Annual growth in outstanding bank loans slows from 5.2% to 5.1%.
The state can still create financing. The private credit impulse is not following. This is the difference between money recorded inside the system and money that starts a new cycle of spending and investment.
Japan
Japan’s M2 rises from ¥1,296.1 trillion to ¥1,297.0 trillion in July, while M3 increases from ¥1,639.8 trillion to ¥1,641.2 trillion. Based on the seasonally adjusted levels, simple monthly growth is about 0.16% for M2 and 0.04% for M3. The annual rates are 2.2% and 1.4%.
Loans by major, regional and shinkin banks reach ¥679.2 trillion, up 5.4% over the year. The rate slows from 5.7% in June but remains strong compared with broad money.
This is the cleanest example of the offset. The monetary base contracts by 15.7% over the year while bank lending grows by 5.4%. The central bank is narrowing the main road. Banks are still carrying traffic along the second route.
Money and Credit Synthesis
Net Fed Liquidity and Its Relationship to M2
Net Fed Liquidity is the Fed balance sheet minus the Treasury account and overnight reverse repo. It shows how much dollar liquidity is not locked in the government account or parked back at the central bank.
As of 27 August, NFL stands at $5.780 trillion, against $5.826 trillion on 30 July. The decline is $46.6 billion, or 0.80%.
The breakdown matters. The Fed balance sheet removes $7.3 billion. The larger Treasury account removes another $40.0 billion. The depletion of reverse repo returns only $620 million. The three parts add exactly to the total $46.6 billion decline.
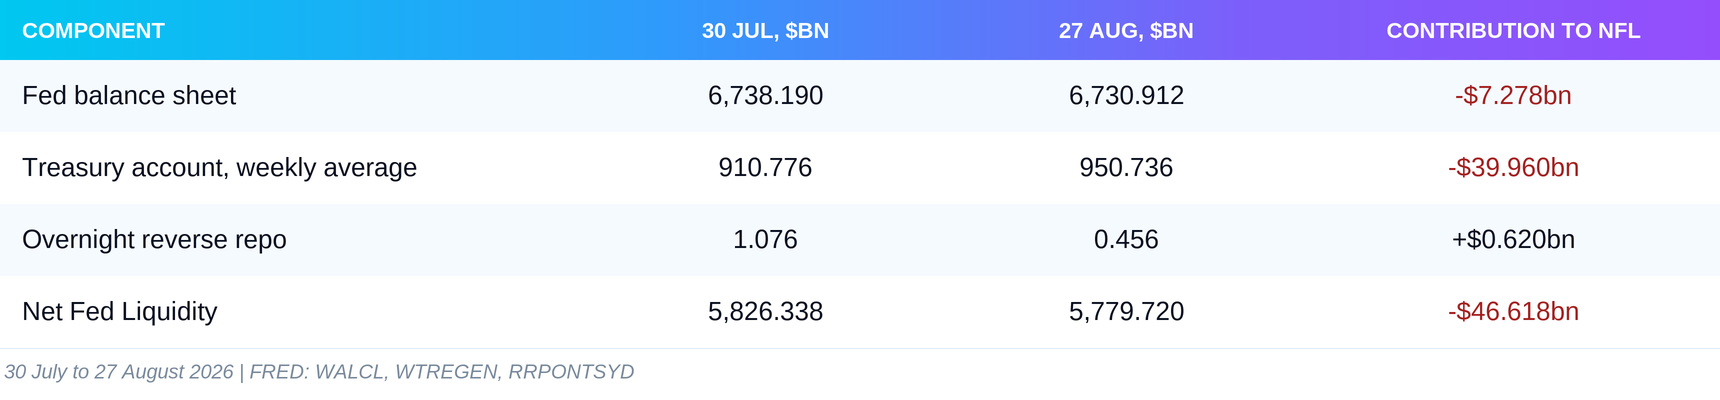
The reverse repo buffer is now effectively exhausted. The next increase in the Treasury account will not be softened by tens or hundreds of billions of parked cash returning to the system. The offset must come from the Fed balance sheet, bank reserves and deposits, or later government spending from the Treasury account.
The annual divergence is even clearer. Between July 2025 and July 2026, M2 grows by $1.193 trillion, while NFL falls by $231.3 billion. The arithmetic gap between them widens by $1.424 trillion.

This is not an accounting measure of privately created money. M2 is a monthly average, NFL is a weekly snapshot and the two series measure different things. The divergence has a narrower meaning. Broad money is growing while the federal liquidity infrastructure is contracting.
Credit Stress
The full breakdown is in Credit Pulse, August 2026, with most data through 28 August and ICE spreads through 27 August. Only the regime calls and the changes that matter are carried over here.
The United States falls from WARNING to NEUTRAL. Europe remains RELAXED. Asia remains NEUTRAL. The calm is not uniform. The US credit premium layer remains in warning because the weakest borrowers continue to lag the rest of the market.
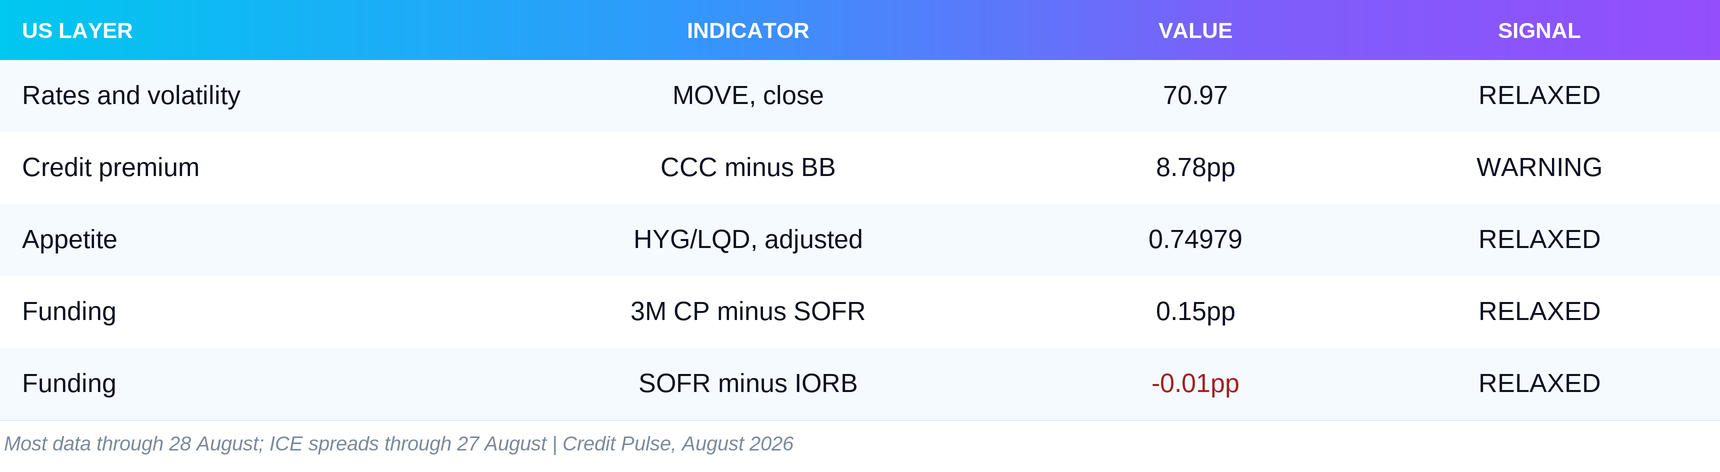
MOVE falls from 83.02 to 70.97 and removes July’s warning in rates and volatility. Corporate funding becomes cheaper relative to SOFR. Appetite for high yield debt remains strong.
The problem is concentrated in the tail. The gap between CCC and BB reaches 8.78 percentage points, the 99th percentile of its twelve-month window and 101 basis points above the end of May. But the broad high yield spread is only 2.63%, while investment grade stands at 0.79%.
This is the strongest counterargument to the case for a liquidity shortage. If the decline in quantities were already squeezing the entire system, funding, investment grade and the broad high yield market would show it. They do not.
The signal is not a broad credit accident. It is selection. The detour remains open to good risk and is almost closed to the weakest borrowers.
Transmission into Risk Assets
Equities
August confirms the message from credit. The market is buying risk, but it is choosing carefully.
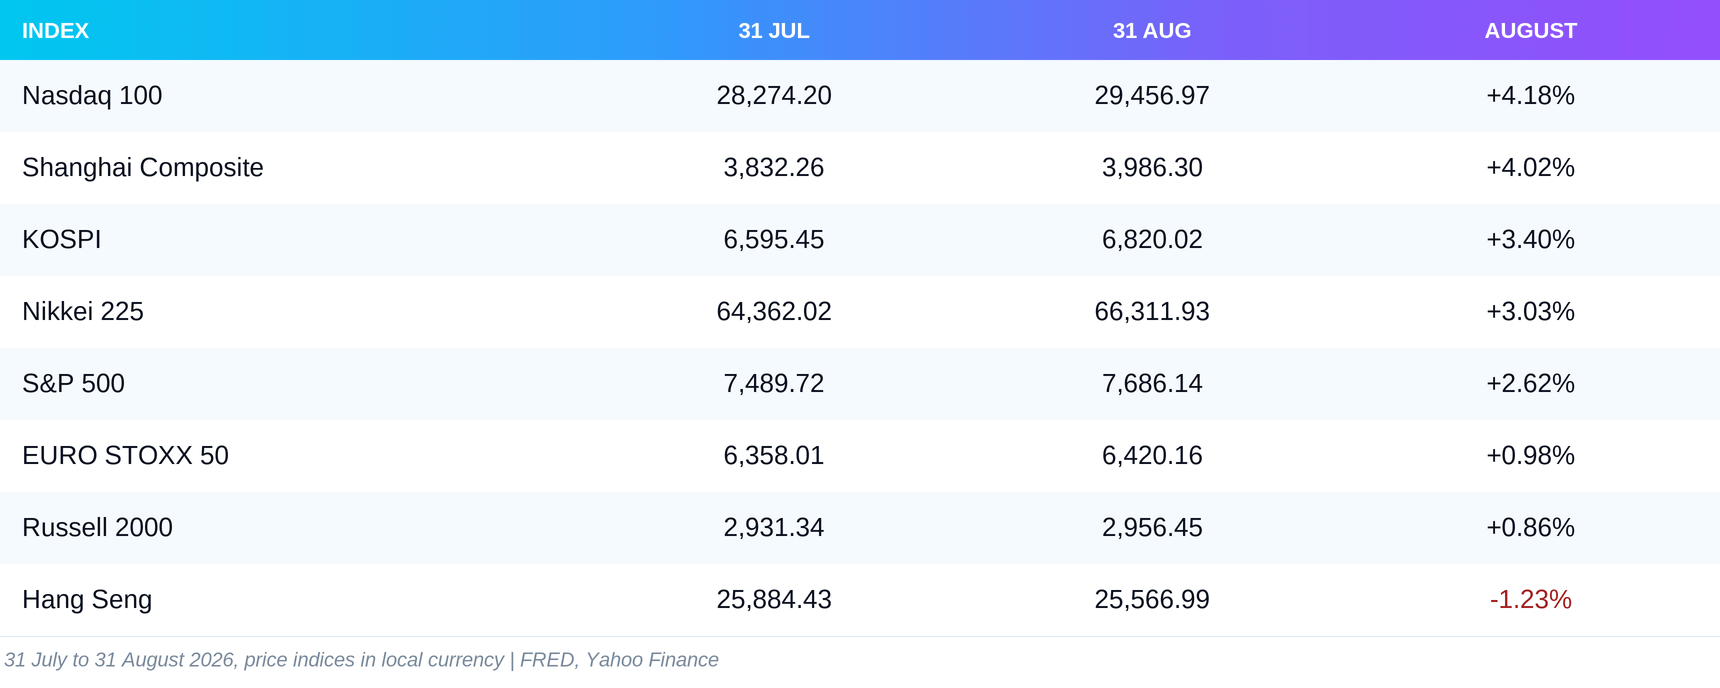
The two US extremes are the Nasdaq 100 and the Russell 2000. Large technology companies gain 4.18%, while smaller companies rise by less than 1%. This is an advance, but liquidity is not being distributed evenly.
In Asia, the Shanghai Composite rises by 4.02% while the Hang Seng falls by 1.23%. The two indices look toward the same economy but receive different flows. Chinese state support reaches the mainland market more easily than international Hong Kong. That is consistent with financing dominated by government bonds, but it does not prove the connection by itself.
Europe remains positive but weak. The EURO STOXX 50 gains 0.98%, behind the United States, Japan, Korea and mainland China.
The Next 30 to 60 Days
The base regime remains selectively risk-on. Bank credit in the United States, the euro area and Japan is still offsetting the contraction in base liquidity. Credit markets do not show broad stress, while the large equity indices continue to rise.
The condition is that the detour remains open. In the United States, weekly growth in loans and deposits must continue after the July decline in business credit. In the euro area, corporate credit must withstand tighter standards. In Japan, bank lending must keep growing while the monetary base contracts.
The first risk is the US Treasury. Only $456 million remains in reverse repo. A further increase in the Treasury account no longer has a large buffer to neutralise it. If bank credit slows while more liquidity moves into the government account, the offset will disappear from both sides.
The second risk is China. July credit is almost entirely state-driven, while the PBoC’s August operations are negative on net. For the regime to change, the next release must show not just larger total social financing, but stronger bank and household credit.
The dates that will test the regime are 10 September for the ECB, 16 September for the Fed and 18 September for the Bank of Japan. The next monthly money and credit releases will show whether the banking offset continued after July.
Key Data Changes
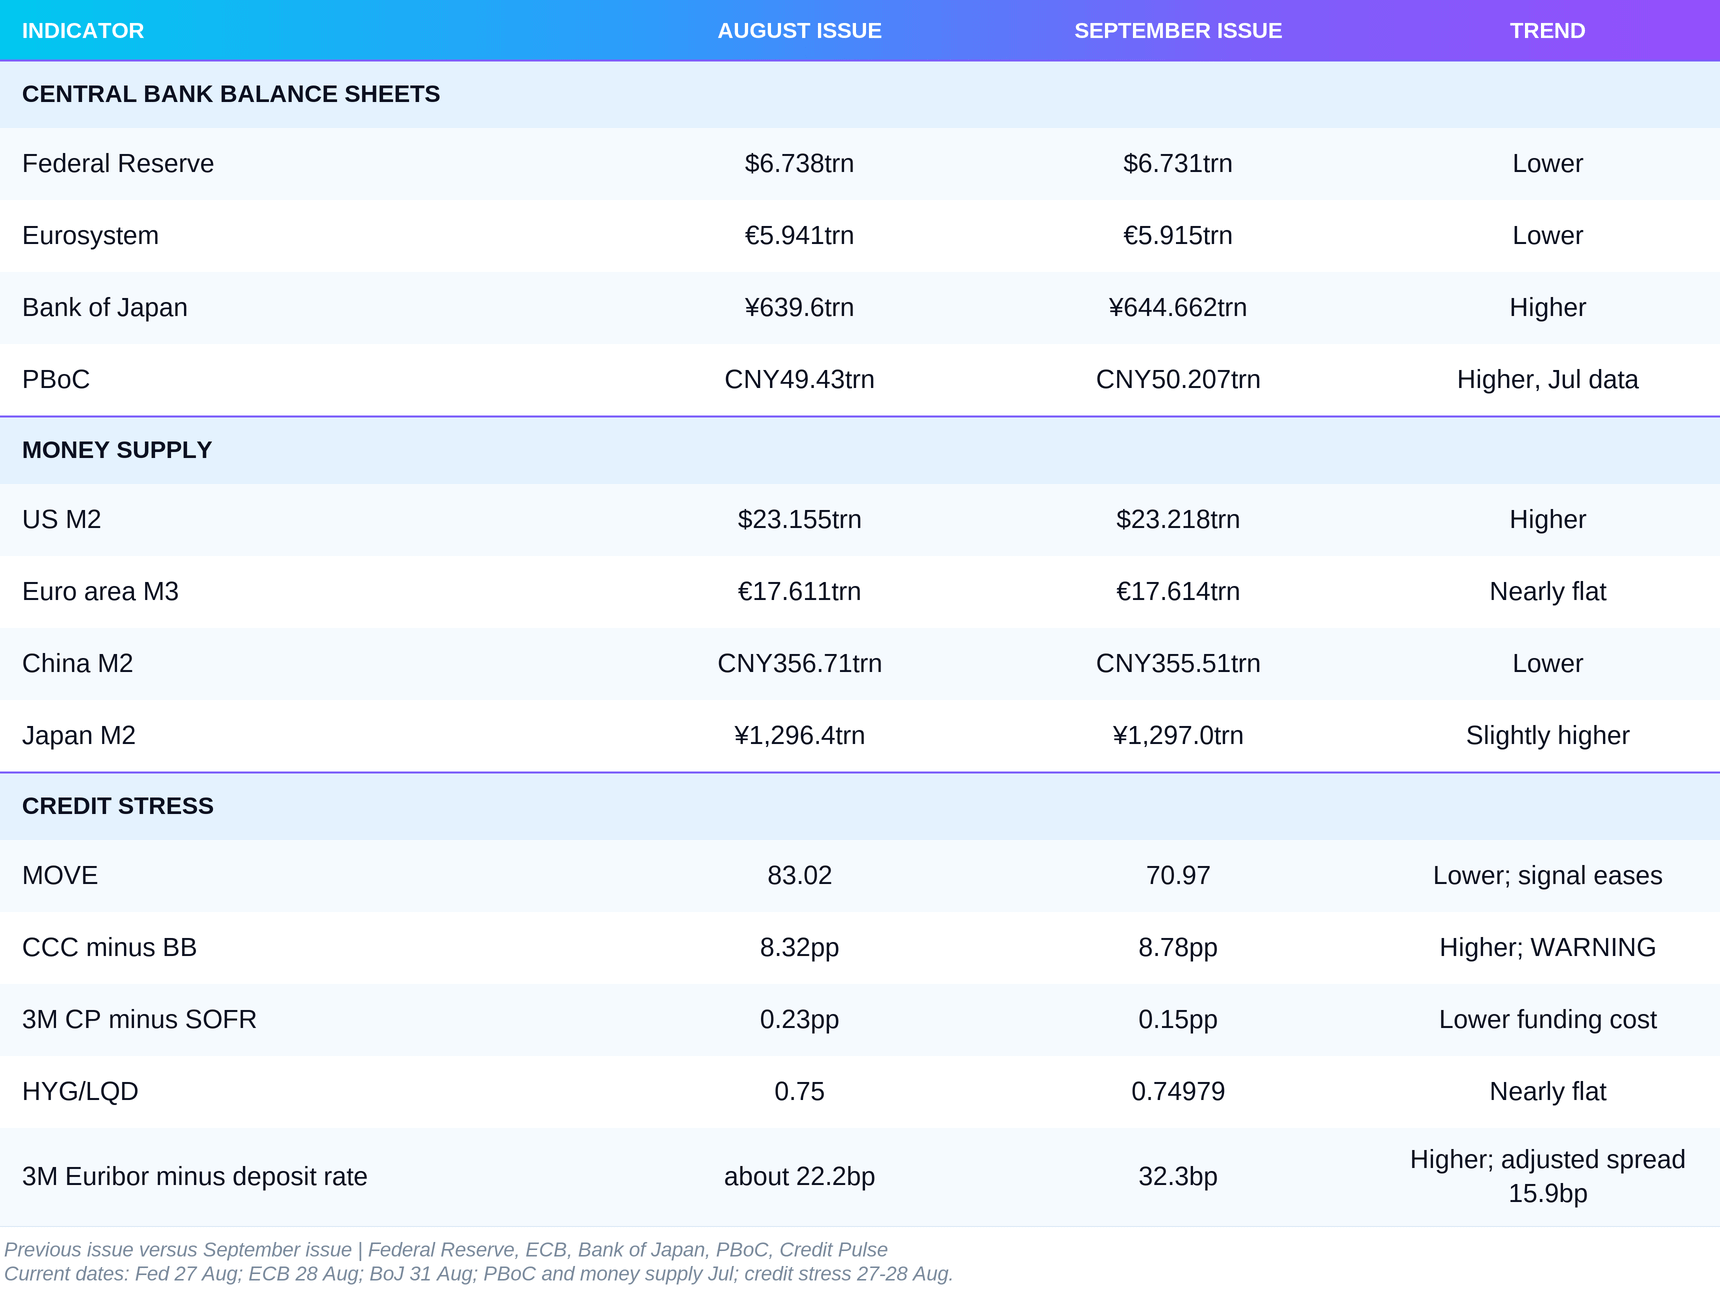
This table preserves the memory of the publication. The previous column contains the figures published in the August issue, not necessarily values for the same calendar date. Comparable monthly moves are explained in the text above.
Final Liquidity Verdict
Regime: selectively risk-on, taking the detour.
The August argument was that liquidity was wearing thin underneath. The September issue adds the important second half. The system has not stopped because banks are carrying part of the movement that central banks no longer provide.
The four central banks are not delivering a common expansionary impulse. The Fed balance sheet is almost neutral, but the Treasury account removes $40 billion. The Eurosystem is running down its portfolios. Japan’s balance sheet grows while its monetary base falls by 15.7% over the year. China’s balance sheet also grows, but reserve money declines and August operations are negative on net.
The headline size of a balance sheet is no longer enough. In Japan and China, assets are rising while the usable reserve layer is falling. That is the central lesson of the month.
The offset comes from commercial banks. US loans and leases add $108.4 billion in August. Corporate and household credit in the euro area grows faster than an almost stationary M3. Japanese bank lending rises by 5.4% over the year while the monetary base contracts sharply.
The United States also shows the limit of this offset. NFL falls by $46.6 billion in August and by $231.3 billion between July 2025 and July 2026. Over the same annual window, M2 grows by $1.193 trillion. Broad money is expanding, but the federal liquidity infrastructure is not supporting it.
China shows what happens when the second route fails. Almost all of July’s total social financing comes from government bonds. Bank loans and household loans decline. The central bank can change the scale and maturity of its operations, but it cannot force private credit to move.
Credit markets do not yet see a broad accident. MOVE is calmer, funding is cheaper, and investment grade and the broad high yield market remain relaxed. The warning is confined to the gap between CCC and BB. The market is not rejecting risk. It is rejecting the weakest risk.
That allows the regime to remain positive but narrow. If bank credit keeps growing, markets can continue for some time without help from central banks. If it slows just as the Treasury account withdraws more liquidity and Chinese private credit remains negative, the detour will close.
The movement continues. The main road is no longer carrying it.
Sources
FRED: WALCL, WTREGEN, RRPONTSYD, M2SL, BUSLOANS, TOTBKCR, TOTLL, SBCACBW027SBOG, DPSACBW027SBOG
ECB: weekly balance sheet as of 31 July, weekly balance sheet as of 28 August, monetary developments for July, Bank Lending Survey
Bank of Japan: balance sheet as of 31 July, balance sheet as of 31 August, monetary base for August, money stock for July, bank lending for July
PBoC: balance sheet of the monetary authority, operations in July, operations in August, money and credit data for July
Market series: S&P 500, Nasdaq 100, Nikkei 225, Russell 2000, EURO STOXX 50, KOSPI, Shanghai Composite, Hang Seng
Credit stress data in the Credit Stress section comes from Credit Pulse, August 2026, with most data through 28 August and ICE spreads through 27 August.
This issue tracks liquidity. Figures from other areas are covered in detail in the rest of the month’s publications: the economies of the United States, the euro area, Japan and China, Global Sector Rotation, Commodity Snapshot, Sector Deep Dive and Credit Pulse.
For informational and analytical purposes only. Not financial advice.
Liquidity Desk | liquiditydesk.org