

Global Liquidity Snapshot | October 2026
Introduction
In September the Nasdaq 100 rose 3.23%. The Russell 2000, the index of smaller US companies, lost 5.40%. That is a gap of 8.6 percentage points in a single month. The Hang Seng fell 3.73%, the Shanghai Composite 3.61% and the broad European STOXX Europe 600 2.49%. This was not a crash. The S&P 500 ended the month almost unchanged. But the market split into a small group that kept moving forward and everyone else, who lost ground.
The cause starts with three decisions. On 10 September the ECB raised its deposit rate by 25 basis points. On 16 September the Fed did the same. On 18 September the Bank of Japan followed. Three hikes in eight days. Warren Buffett has an old line for this: only when the tide goes out do you discover who has been swimming naked.
The tide is already going out. Excess liquidity in the euro area fell by €33.0 billion during the month. Japan’s monetary base shrank by ¥10.2 trillion between August and September alone. The balance sheet of China’s central bank was CNY 350.1 billion smaller in August. And after month end, the gap between the weakest and the stronger high-yield bonds in the US moved above 10 percentage points. The question this month is whether the water is pulling back evenly or only from some shores. And which boats are already touching bottom.
Central Banks
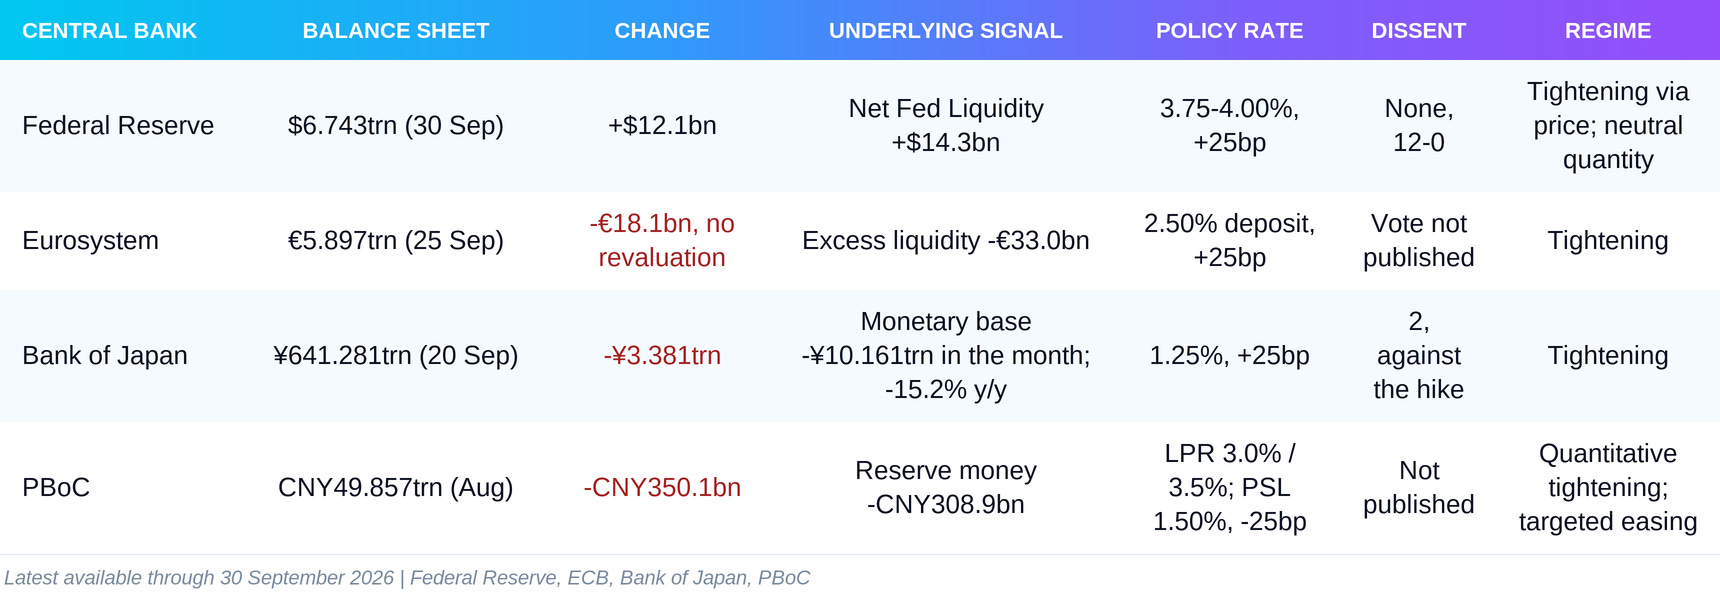
Three of the four major central banks raised rates within eight days. The quantities beneath those decisions are not moving in the same way. The Fed is tightening almost entirely through the price of money. The Eurosystem and the Bank of Japan are tightening through both price and quantity. China’s central bank is moving the other way on price, but not on quantity.
Federal Reserve
The Fed balance sheet stands at $6.743 trillion as of 30 September, against $6.731 trillion on 26 August. The increase is $12.1 billion. Treasury securities within it rise by $18.0 billion, because the Fed rolls over maturing Treasuries and reinvests principal from mortgage-backed securities into Treasury bills. This is not new QE. The balance sheet is effectively neutral.
On 16 September the Fed raised the target range by 25 basis points to 3.75 to 4.00%. The decision was unanimous, 12 to 0. At the previous meeting in July, three members voted against holding because they wanted a hike. This time there was not a single dissent. Interest on reserve balances, the rate the Fed pays banks on their reserves, is 3.90% from 17 September. Quantities barely move. Net Fed Liquidity rises by $14.3 billion over the month (details in the Net Fed Liquidity section). In the US, the ebb comes from the price of money, not from a shrinking balance sheet.
Regime: tightening through price, neutral on quantity. The Fed is making money more expensive without withdrawing assets.
European Central Bank
The Eurosystem balance sheet falls from €5.915 trillion to €5.897 trillion between 28 August and 25 September. Of the €18.1 billion decline, €19.8 billion comes from securities held for monetary policy purposes. The APP and PEPP portfolios continue to shrink because maturing principal is no longer reinvested. No revaluation distorts this comparison. The latest published weekly balance sheet is as of 25 September, before the quarterly revaluation of gold and foreign currency at the end of September. That revaluation will show up in the first October balance sheet.
Excess liquidity confirms the direction. It falls from €2.142 trillion on 31 August to €2.109 trillion on 30 September, a decline of €33.0 billion (-1.54%). Last month it was almost stationary. Now it is moving. On 10 September the ECB raised all three rates by 25 basis points, effective 16 September. The deposit facility rate is 2.50%, the main refinancing rate 2.65% and the marginal lending rate 2.90%. The published decision does not give a numerical vote.
Regime: tightening. A higher price of money and excess liquidity that is genuinely falling.
Bank of Japan
The Bank of Japan balance sheet falls from ¥644.662 trillion on 31 August to ¥641.281 trillion on 20 September, a decline of ¥3.381 trillion. The full month-end figure for 30 September is published on 7 October. What matters is what sits beneath the balance sheet. Holdings of government bonds actually rise slightly, by ¥0.375 trillion. But banks’ current account deposits at the central bank fall by ¥14.069 trillion over the same three weeks. Current account deposits are bank reserves, the most liquid money in the system. Banks use them to settle payments with each other and to buy bonds. The credit they extend also rests on them. In Japan they make up more than three quarters of the entire monetary base: ¥416.6 trillion out of ¥535.4 trillion at the end of September. When they fall, banks have less free money, even if the central bank’s total balance sheet looks almost unchanged. The balance sheet also shows where the money went. About ¥7.3 trillion moved into the government’s account at the Bank of Japan, the equivalent of the US Treasury General Account. Banks repaid another ¥3.4 trillion under the BoJ programme that gave them cheap loans to support lending. About ¥3.0 trillion was absorbed through repo operations, in which the central bank hands over bonds against cash and commits to buy them back. Part of the ebb is temporary, part is not. Money in the government’s account can return to banks when the state spends it. The repo is short term. The repaid programme loans, however, do not come back on their own.
The monetary base, the independent check, confirms the move for the full month. Its average level falls from ¥543.007 trillion to ¥532.846 trillion, a drop of ¥10.161 trillion. The annual decline is 15.2%, against 15.7% in August. A smaller annual decline is not an improvement. The base keeps shrinking from month to month, and the end-September level is ¥8.344 trillion below the end-August level. On 18 September the policy rate was raised by 25 basis points to 1.25%, effective 24 September. The vote was 7 to 2. The two dissenters, Toichiro Asada and Ayano Sato, opposed the hike.
Regime: tightening. The rate is rising, and the monetary base is shrinking on both the monthly average and the month-end level.
People’s Bank of China
The latest published PBoC balance sheet is for August. Assets fall by CNY 350.1 billion to CNY 49.857 trillion. The main reason is a CNY 508.1 billion drop in claims on banks, meaning the central bank has pulled back part of the loans it had extended to them. This time the balance sheet does not mislead. Reserve money falls by CNY 308.9 billion and bank deposits at the PBoC by CNY 310.6 billion. Government deposits rise by only CNY 30.5 billion. The contraction is real and reaches bank reserves. It matches the net CNY 408.6 billion withdrawal through August operations reported in the previous issue.
In September the direction on price reverses. On 29 September the PBoC cut the rate on its one-year pledged supplementary lending, its targeted lending to selected sectors, by 25 basis points to 1.50%. The quota for technology relending rises by CNY 200 billion to CNY 1.4 trillion. The quota for agriculture and small business rises by CNY 500 billion to CNY 4.85 trillion. Of that, CNY 300 billion is reserved for private firms. The new capacity totals CNY 700 billion. That is a quota, not credit already extended. Whether it is used will show up in the September and October credit data. The one-year loan prime rate remains at 3.0% and the five-year rate at 3.5%.
Regime: quantitative tightening in August, targeted easing in September. The price of targeted funding is falling, but the total quantity of liquidity in the latest measured month is shrinking.
Central Bank Synthesis
Money and Credit Transmission
In the previous issue, bank credit was the detour that kept the system moving without help from central banks. The monthly money and credit data are for August, before the three hikes, and they show that this route is still open. For September there are so far only the weekly US bank data through 23 September, which cover one week after the Fed decision. The September monthly data arrive during October, first in Japan on 13 and 14 October, then in the euro area and the US on 27 October. They will be the first real test.
United States
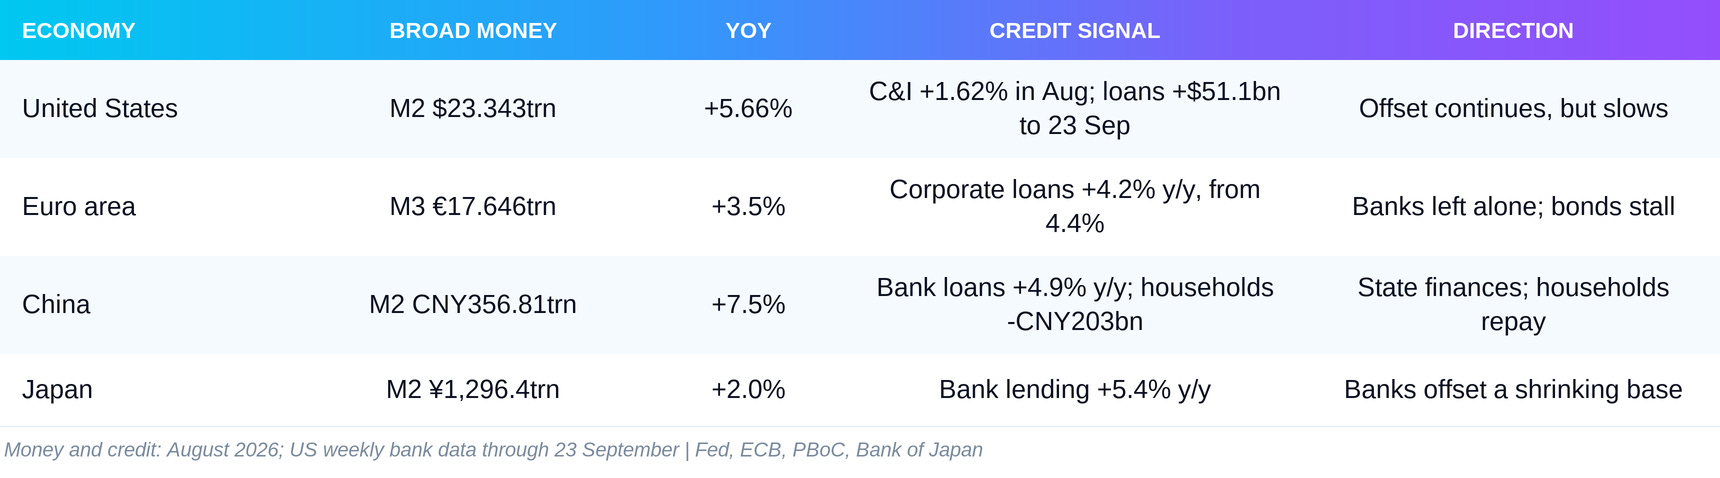
US M2 reaches $23.343 trillion in August, after a monthly increase of $124.9 billion. That is a rise of 0.54% for the month and 5.66% over the year. Commercial and industrial loans rebound strongly. They grow 1.62% in August to $2.935 trillion, the strongest monthly gain in the last five months. The annual rate is 9.52%.
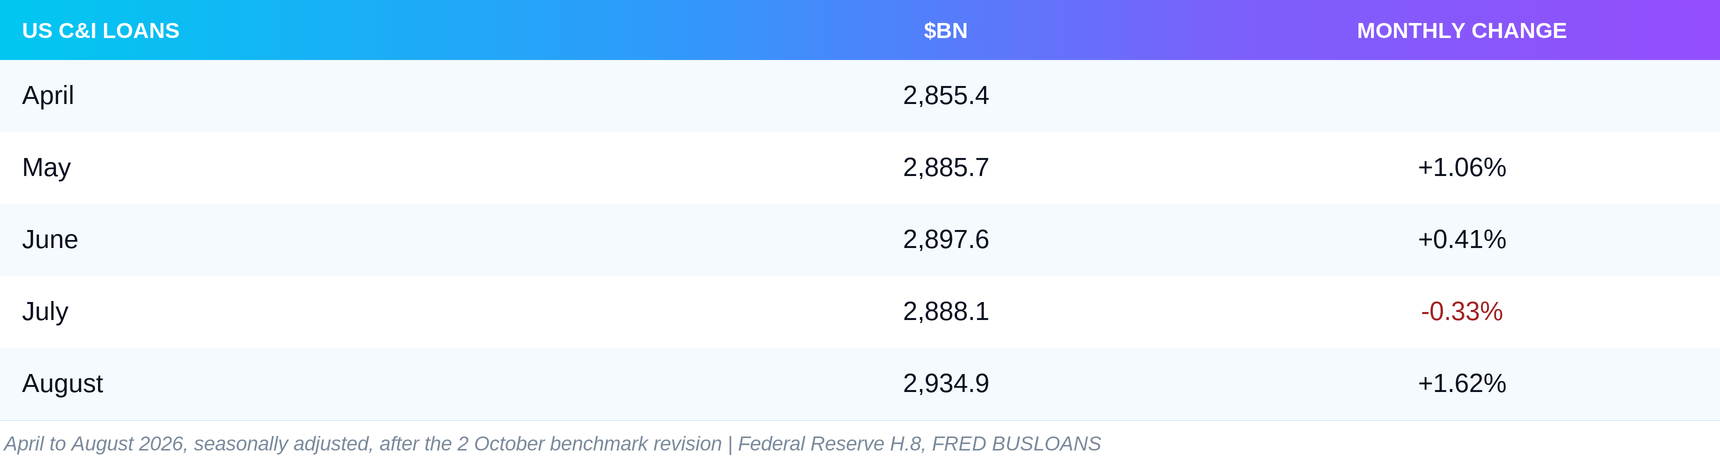
The July decline has been revised. Last month it was -0.20% at a level of $2.899 trillion. Now it is -0.33% at $2.888 trillion. The revision comes from benchmarking the weekly data against banks’ quarterly reports for June, included in the 2 October release. The weekly data run to 23 September. Between 26 August and 23 September, bank loans and leases rise by $51.1 billion and deposits by $75.5 billion. Total bank credit adds only $18.6 billion, because banks reduce their securities holdings by $32.5 billion. The pattern is the same as in August: more loans, fewer bonds. But the pace is half of August’s $108.4 billion.
Euro Area
M3 rises by €31.4 billion in August to €17.646 trillion. The annual rate accelerates from 3.4% to 3.5%. Credit to companies is slowing. Adjusted loans to non-financial corporations grow 4.2% over the year, against 4.4% in July. Household loans hold at 3.1%. The adjusted series remove the effect of loans sold and securitised and match the growth rates the ECB publishes.
The bond channel is closing. Net debt issuance by non-financial companies is €9.6 billion in June, €7.2 billion in July and -€0.2 billion in August, meaning companies repaid more than they issued. Bank credit is still growing, but it is now almost the only open channel. This does not prove that companies have swapped bonds for bank loans. It shows that the second channel has stalled. The latest ECB bank lending survey covers the second quarter. A net 7% of banks tightened standards for companies, and a net 9% for mortgages. The next survey is published on 27 October and will be the first after the hike.
China
China’s M2 recovers after the July decline. It rises by CNY 1.30 trillion in August to CNY 356.81 trillion, or 0.37% for the month. The annual rate keeps slowing, however, from 7.7% to 7.5%. Total social financing, the broadest measure of credit reaching the real economy, adds CNY 1.658 trillion in August, against CNY 1.407 trillion in July. Government bonds provide CNY 1.010 trillion, or 60.9% of the flow. In July their share was 93.7%. August credit is broader than July’s, but the state remains the main channel. Renminbi loans to the real economy add only CNY 55.2 billion. Year to date, total social financing is CNY 23.91 trillion, CNY 2.64 trillion less than a year earlier.
Renminbi bank loans grow by around CNY 60 billion for the month. Beneath that figure, the two private sectors move in opposite directions. Companies and organisations add around CNY 260 billion, while households reduce their borrowing by around CNY 203 billion. Annual growth in bank loans slows from 5.1% to 4.9%. Households keep paying down debt while the state borrows. The new targeted quotas from 29 September are trying to change exactly that, but the August data predate them.
Japan
Japan’s M2 stands at ¥1,296.4 trillion in August, up 2.0% over the year. M3 is ¥1,640.0 trillion, up 1.2%. Without seasonal adjustment, M2 falls by ¥0.2 trillion against a revised July. On seasonally adjusted levels it rises by around 0.11%. On either measure, broad money is effectively flat. Lending by major, regional and shinkin banks reaches ¥680.3 trillion, up 5.4% over the year. At the major and regional banks alone, growth is 5.8%.
Japan remains the clearest example of the offset. The monetary base is shrinking 15.2% over the year, while bank lending grows 5.4%. The central bank is draining the water, and commercial banks are still putting it back. The September lending data arrive on 13 October and will show whether this survived the hike.
Money and Credit Synthesis
Net Fed Liquidity and Its Relationship to M2
Net Fed Liquidity is the Fed balance sheet minus the Treasury General Account and overnight reverse repo. It shows how much dollar liquidity is not locked in the government’s account or parked back at the central bank.
Net Fed Liquidity
As of 30 September, Net Fed Liquidity is $5.794 trillion, against $5.780 trillion on 26 August. The increase is $14.3 billion, or 0.25%.
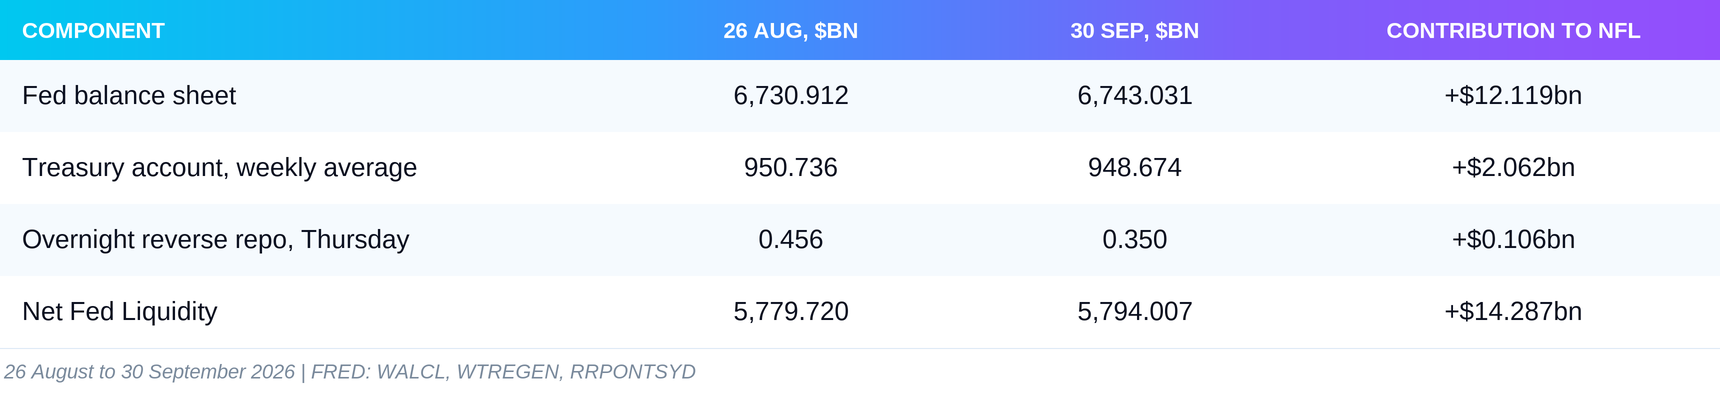
Almost the entire increase comes from the Fed balance sheet. The Treasury account ends the month almost where it started. Reverse repo is practically at zero and has nothing more to give back. The monthly comparison hides a large move in the middle of the month. Net Fed Liquidity reaches $5.869 trillion on 16 September, the day of the Fed decision. Then quarterly corporate tax payments in mid-month lift the weekly average of the Treasury account from $877.0 billion to $977.1 billion in a single week. Net Fed Liquidity falls to $5.770 trillion on 23 September, before recovering to $5.794 trillion at month end.
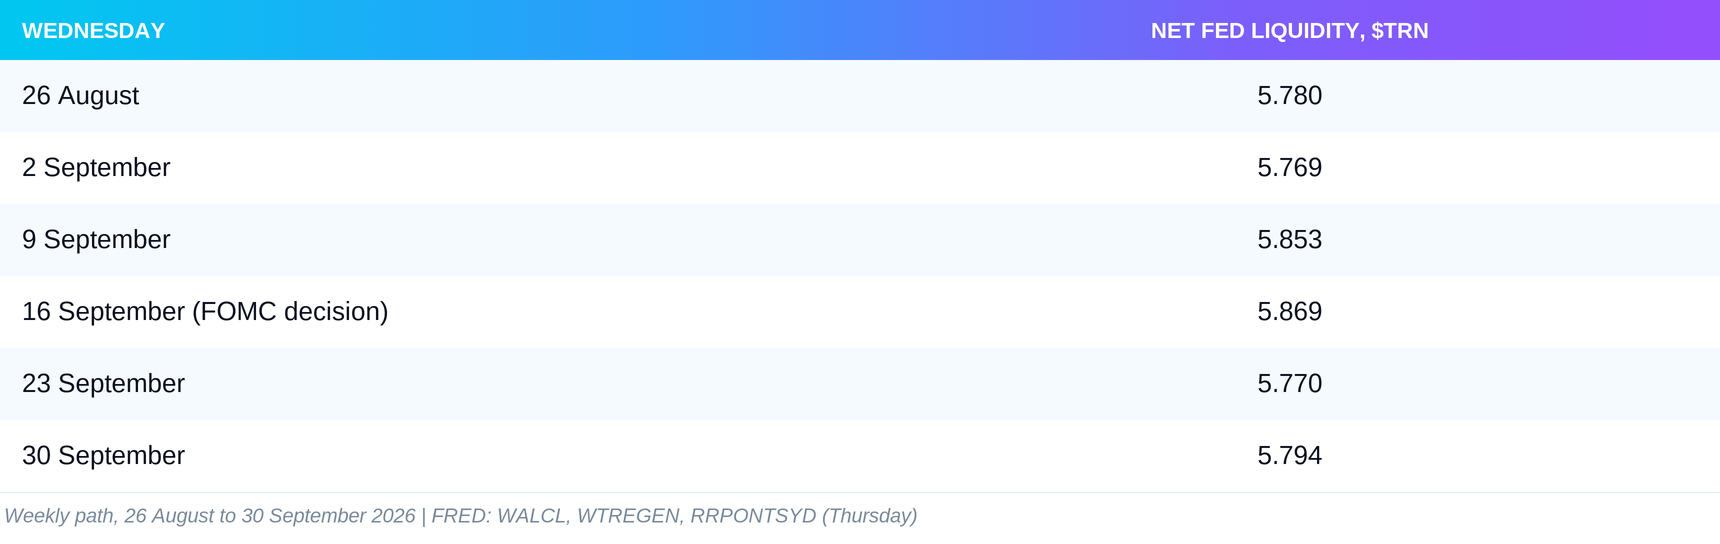
The reverse repo buffer remains exhausted. When the Treasury account grew by $100 billion in one week, there was no parked cash to absorb the blow. With reverse repo empty, a build-up like that is paid for out of bank reserves.
M2 vs Net Fed Liquidity
The comparison covers the same twelve-month window, August 2025 to August 2026.

The annual decomposition of Net Fed Liquidity: the Fed balance sheet adds $127.5 billion, the drain of reverse repo adds another $31.5 billion, and the higher Treasury account removes $360.7 billion. The three parts sum exactly to -$201.7 billion. Over one year, the Treasury has drawn almost three times as much out of the system as the Fed balance sheet has added. This is not an accounting measure of privately created money. M2 is a monthly average, Net Fed Liquidity is a weekly snapshot, and the two series measure different things. The divergence has a narrower meaning. Broad money is growing, while the federal liquidity plumbing is smaller than it was a year ago.
