

Energy leads on both sides of the Atlantic, Asia chooses semiconductors, and the rest of the cyclical market loses speed.
After the detour
August showed a market that could still rise even as central banks withdrew part of the underlying liquidity. Bank credit kept the detour open, large technology companies led, and Asia looked like the cleanest place to take risk.
That route is not closing in September, but it is getting narrower. The market is choosing specific sources of profit: energy, semiconductors and individual companies with resilient cash flow. Technology remains strong over longer horizons, but the move is concentrating in Taiwan and South Korea. Energy continues to lead in both the United States and Europe. At the same time, industry, materials, consumption, real estate and much of the European market are falling together.
The question this month is therefore not whether there is an appetite for risk. There is, but it is selective. The question is why investors are paying for two narrow themes while abandoning the sectors that should benefit from broad economic acceleration.
Macro backdrop
The rate environment
The long end of the bond market is moving higher in both the United States and Europe. This is the most direct pressure on sectors with distant earnings, heavy debt or strong dependence on consumer credit.
The Federal Reserve kept its target range at 3.50% to 3.75% on 29 July, while the effective rate remains 3.63%. The ten-year US Treasury yield, however, reached 4.95% on 10 September, up from 4.63% on 13 August. The gap between the ten-year yield and the effective federal funds rate is now 1.32 percentage points. The market is demanding more compensation for long-term risk even though the Fed has not changed its short-term rate.
The European Central Bank took the next step. On 10 September, it raised all three policy rates by 25 basis points. From 16 September, the deposit facility rate rises to 2.50%, the main refinancing rate to 2.65% and the marginal lending rate to 2.90%. The reason is energy-driven inflation pressure from the conflict in the Middle East. The ECB now forecasts inflation of 3.0% in 2026, 2.5% in 2027 and 2.1% in 2028. The ten-year German government bond yield has reached 3.56%, up from 3.22% on 14 August.
The Bank of Japan is holding its policy rate at 1.00%, but its long end is becoming more expensive again. The average yield at the 30-year Japanese government bond auction on 3 September was 4.079%, up from 3.937% in August. The gap to the policy rate is 3.079 percentage points. This matters for the carry trade, the practice of borrowing cheaply in yen and investing the money in higher-yielding assets elsewhere. As long-term funding in Japan becomes more expensive, that trade becomes less attractive. The bank’s next meeting is on 17 and 18 September.
The broad dollar
The Federal Reserve’s Broad Dollar Index stood at 118.0732 on 4 September, the latest available date, down from 119.1790 on 11 August. That is a decline of 0.93%.
A weaker dollar works through two channels. It raises the dollar value of foreign revenue for US companies and reduces the burden of dollar debt for emerging economies. The second channel is visible this month in Brazil and the broad Latin American fund. Mexico and Chile remain negative, however. The dollar matters again, but it is not enough to explain the whole region.
Risk appetite
The VIX stood at 17.84 on 10 September, up from 14.63 on 13 August. The VIX measures the price of protection against short-term moves in the US equity market. Below 20 signals calm, above 20 greater nervousness and above 30 active fear.
The market is more tense, but it is not in panic. That distinction matters. The declines in industry, consumption and real estate are not a forced flight to cash. They are a repricing under pressure from higher long-term rates and a narrower choice of profitable themes.
United States: One leader, broad retreat
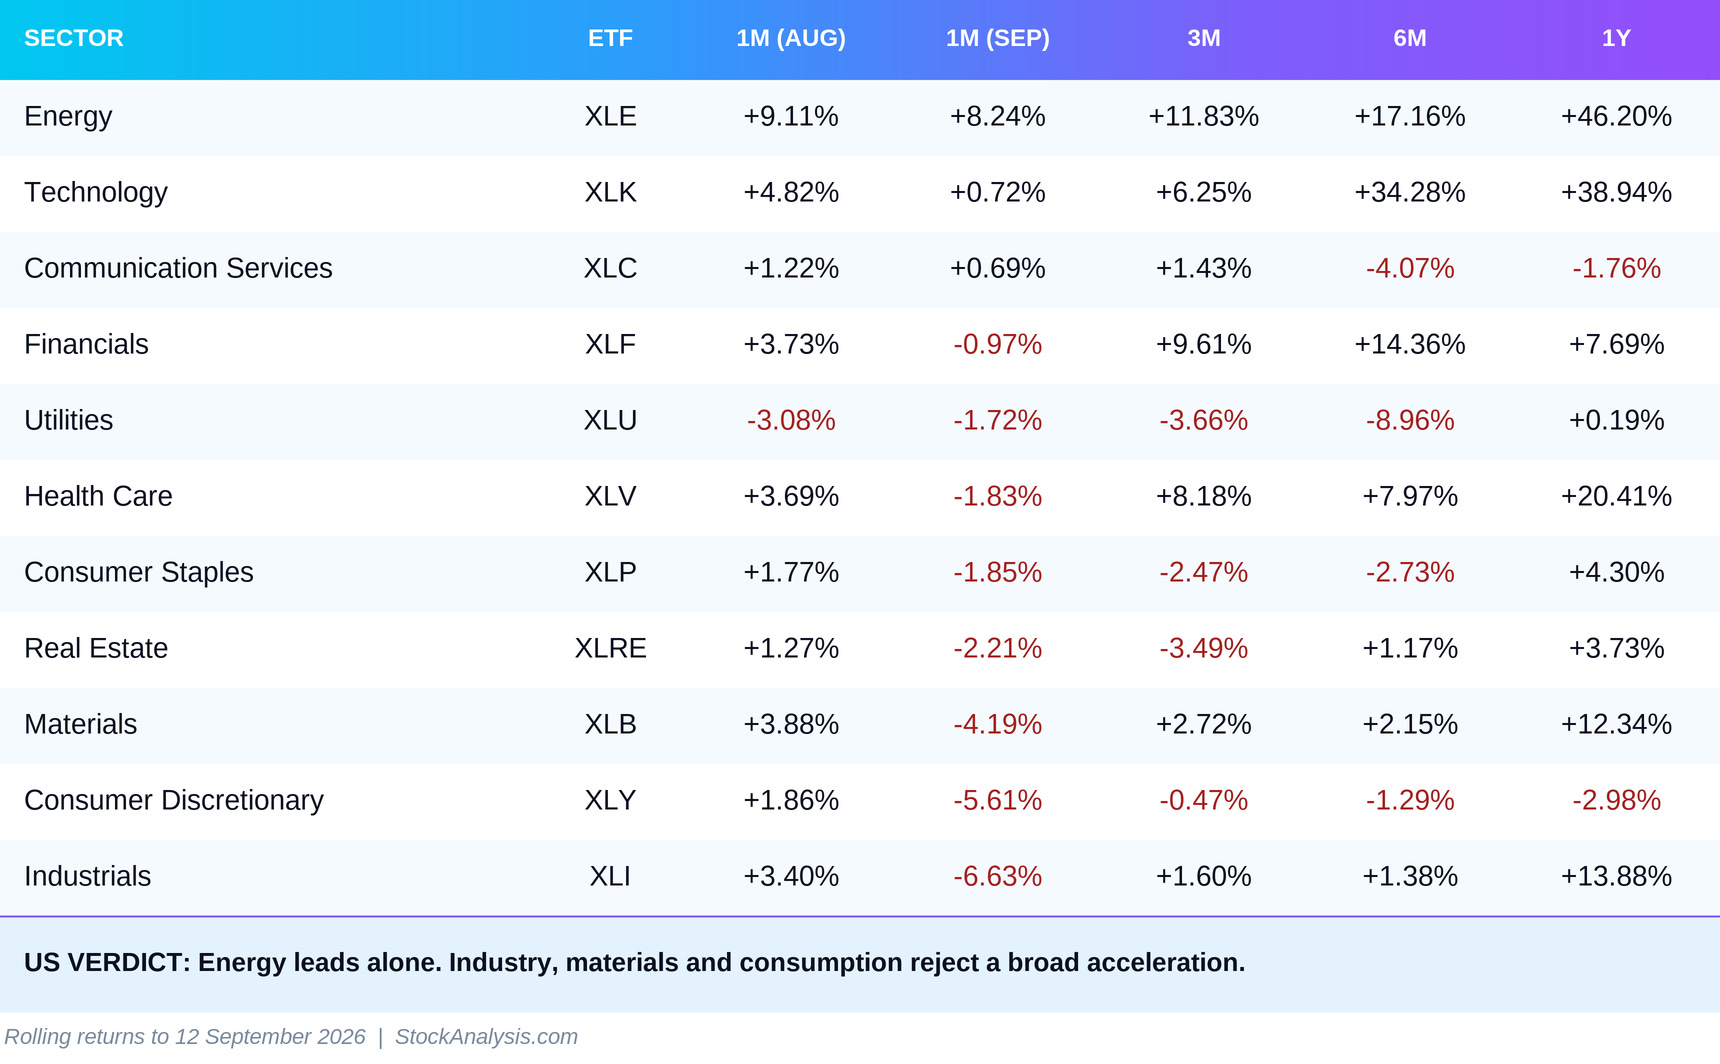
Energy is the only convincing US leader. XLE gains 8.24% for the month after 9.11% in August. This is not a one-off jump. The fund is up 11.83% over three months, 17.16% over six and 46.20% over one year. Continued uncertainty around energy flows through the Middle East is keeping a premium in the sector, while the ECB now treats the energy shock as persistent enough to justify higher rates.
Technology looks resilient only when viewed beyond the latest month. XLK is up 0.72%, but its six-month return remains 34.28% and its one-year return 38.94%. This is cooling after a powerful cycle, not a collapse of the thesis. The difference is that the US fund is no longer accelerating, while the Asian markets that manufacture the key chips and memory are.
Communication Services is the second positive sector, but it gains only 0.69% and remains negative over one year. This is an early recovery attempt from a weak base, not established leadership.
The rest of the market is retreating. Industrials fall 6.63%, consumer discretionary 5.61% and materials 4.19%. All three were positive in August. The reversal is too synchronised to be read as a collection of isolated corporate problems. A higher ten-year yield makes investment, housing, cars and credit-funded consumption more expensive at the same time.
Financials and health care are also negative for the month, but their longer periods remain strong. XLF is up 9.61% over three months and XLV 8.18%. This is why the relative rotation graph keeps them in Leading despite the negative month. They still carry accumulated relative strength against the S&P 500, but their momentum is fading.
RRG: The slower signal
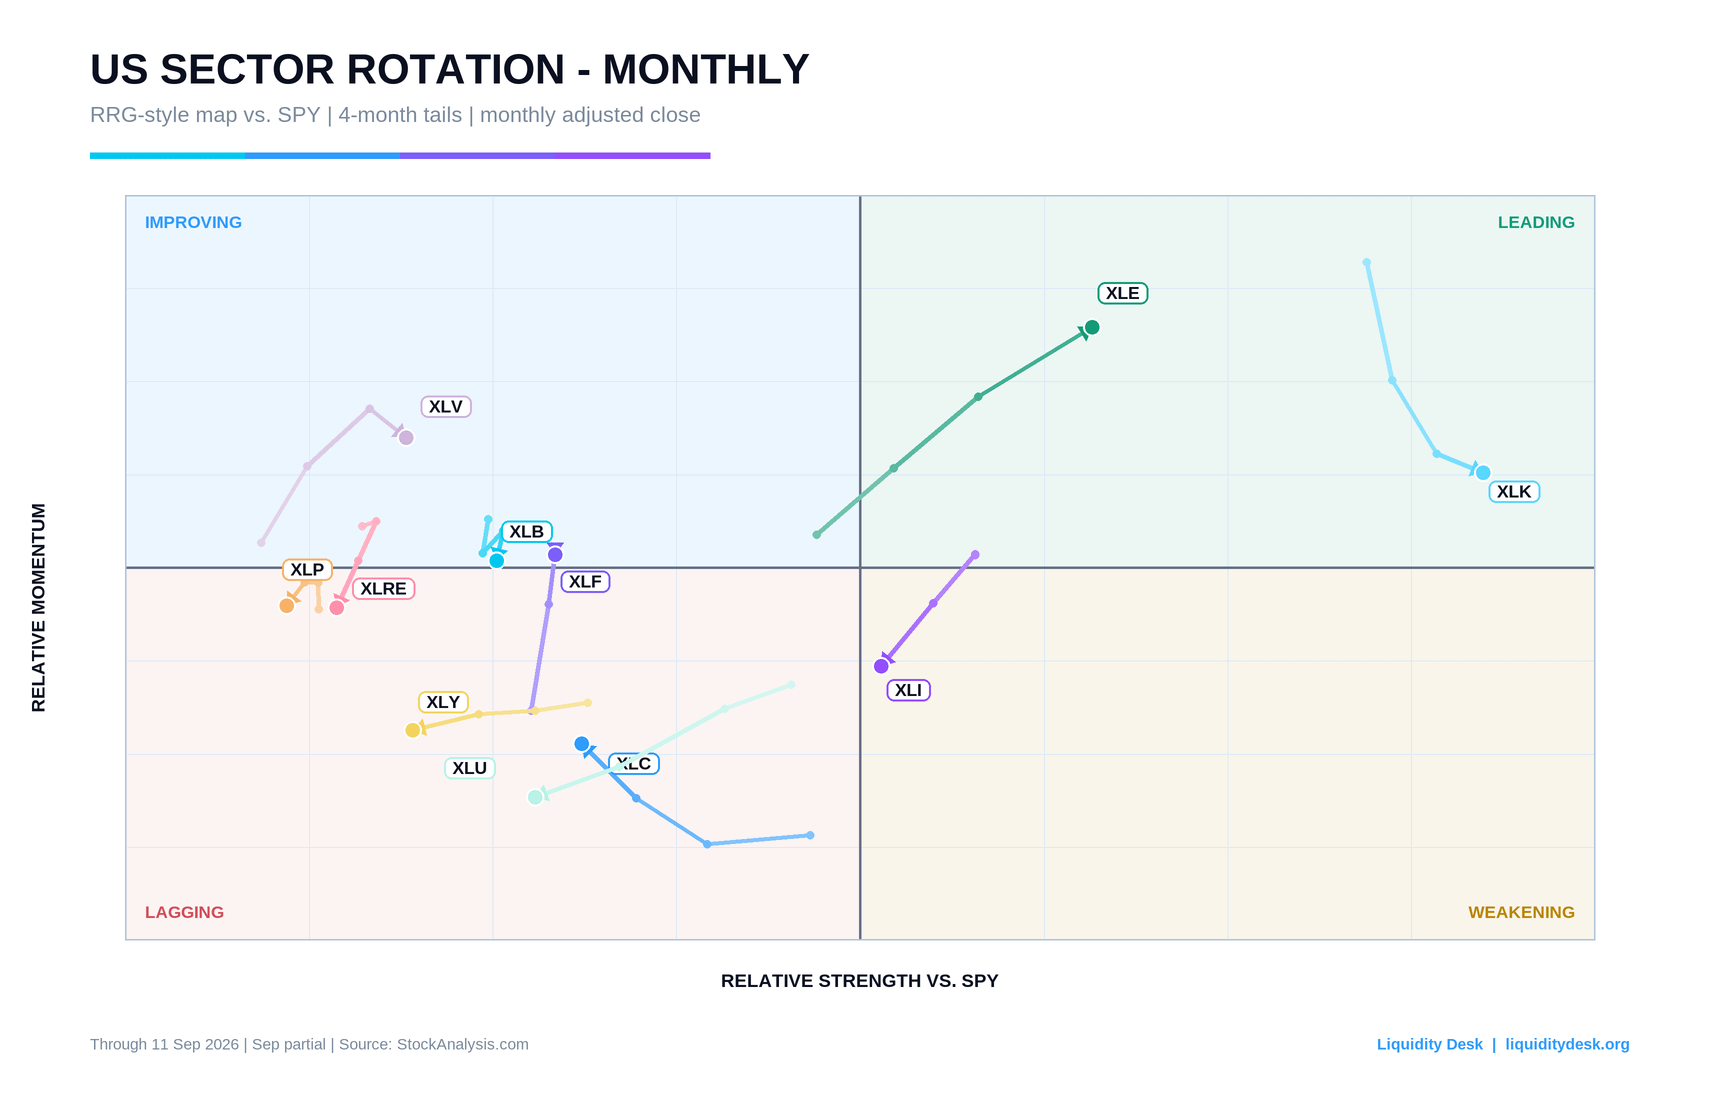
The horizontal axis shows relative strength against SPY, while the vertical axis shows the change in that strength. The upper-right Leading quadrant combines strength with positive momentum. The lower-right Weakening quadrant means a sector remains strong but is losing speed. The upper-left Improving quadrant shows recovery from a weak base, while the lower-left Lagging quadrant combines a weak position with weak momentum.
The monthly horizon filters out weekly noise and shows the more persistent direction. XLE is the clean signal. Energy is in Leading and moving up and to the right. XLK also remains in Leading and has the highest relative strength on the map, but its latest step is down and to the right. Technology is preserving its leadership while momentum gradually cools.
XLI is now in Weakening and moving down and to the left. This is the clearest confirmation that the broad cyclical trade is losing strength. Materials, financials and health care sit in Improving, but their latest direction does not show a common acceleration. XLV is moving to the right, while XLB and XLF are losing momentum. The quadrant itself changes for materials and financials under 8-, 10- and 12-month smoothing, so those signals remain less certain.
Communication Services, consumer staples, real estate, utilities and consumer discretionary remain in Lagging. XLC is beginning to lift its momentum, but its relative strength is still weakening. The rest of the group is moving down and to the left. The monthly map does not show a broad sector turn. It shows two persistent themes, energy and technology, against a market that is still searching for direction.
The RRG does not measure actual money flows. It shows relative performance and the change in that performance. The chart is therefore a map of market preference, not proof that every dollar leaving industry has moved into energy. It is a transparent RRG-style approximation built from the final available weekly adjusted price in each month, not the official proprietary JdK model. The last point is the incomplete September observation through 11 September 2026.
Europe: Energy holds, breadth disappears
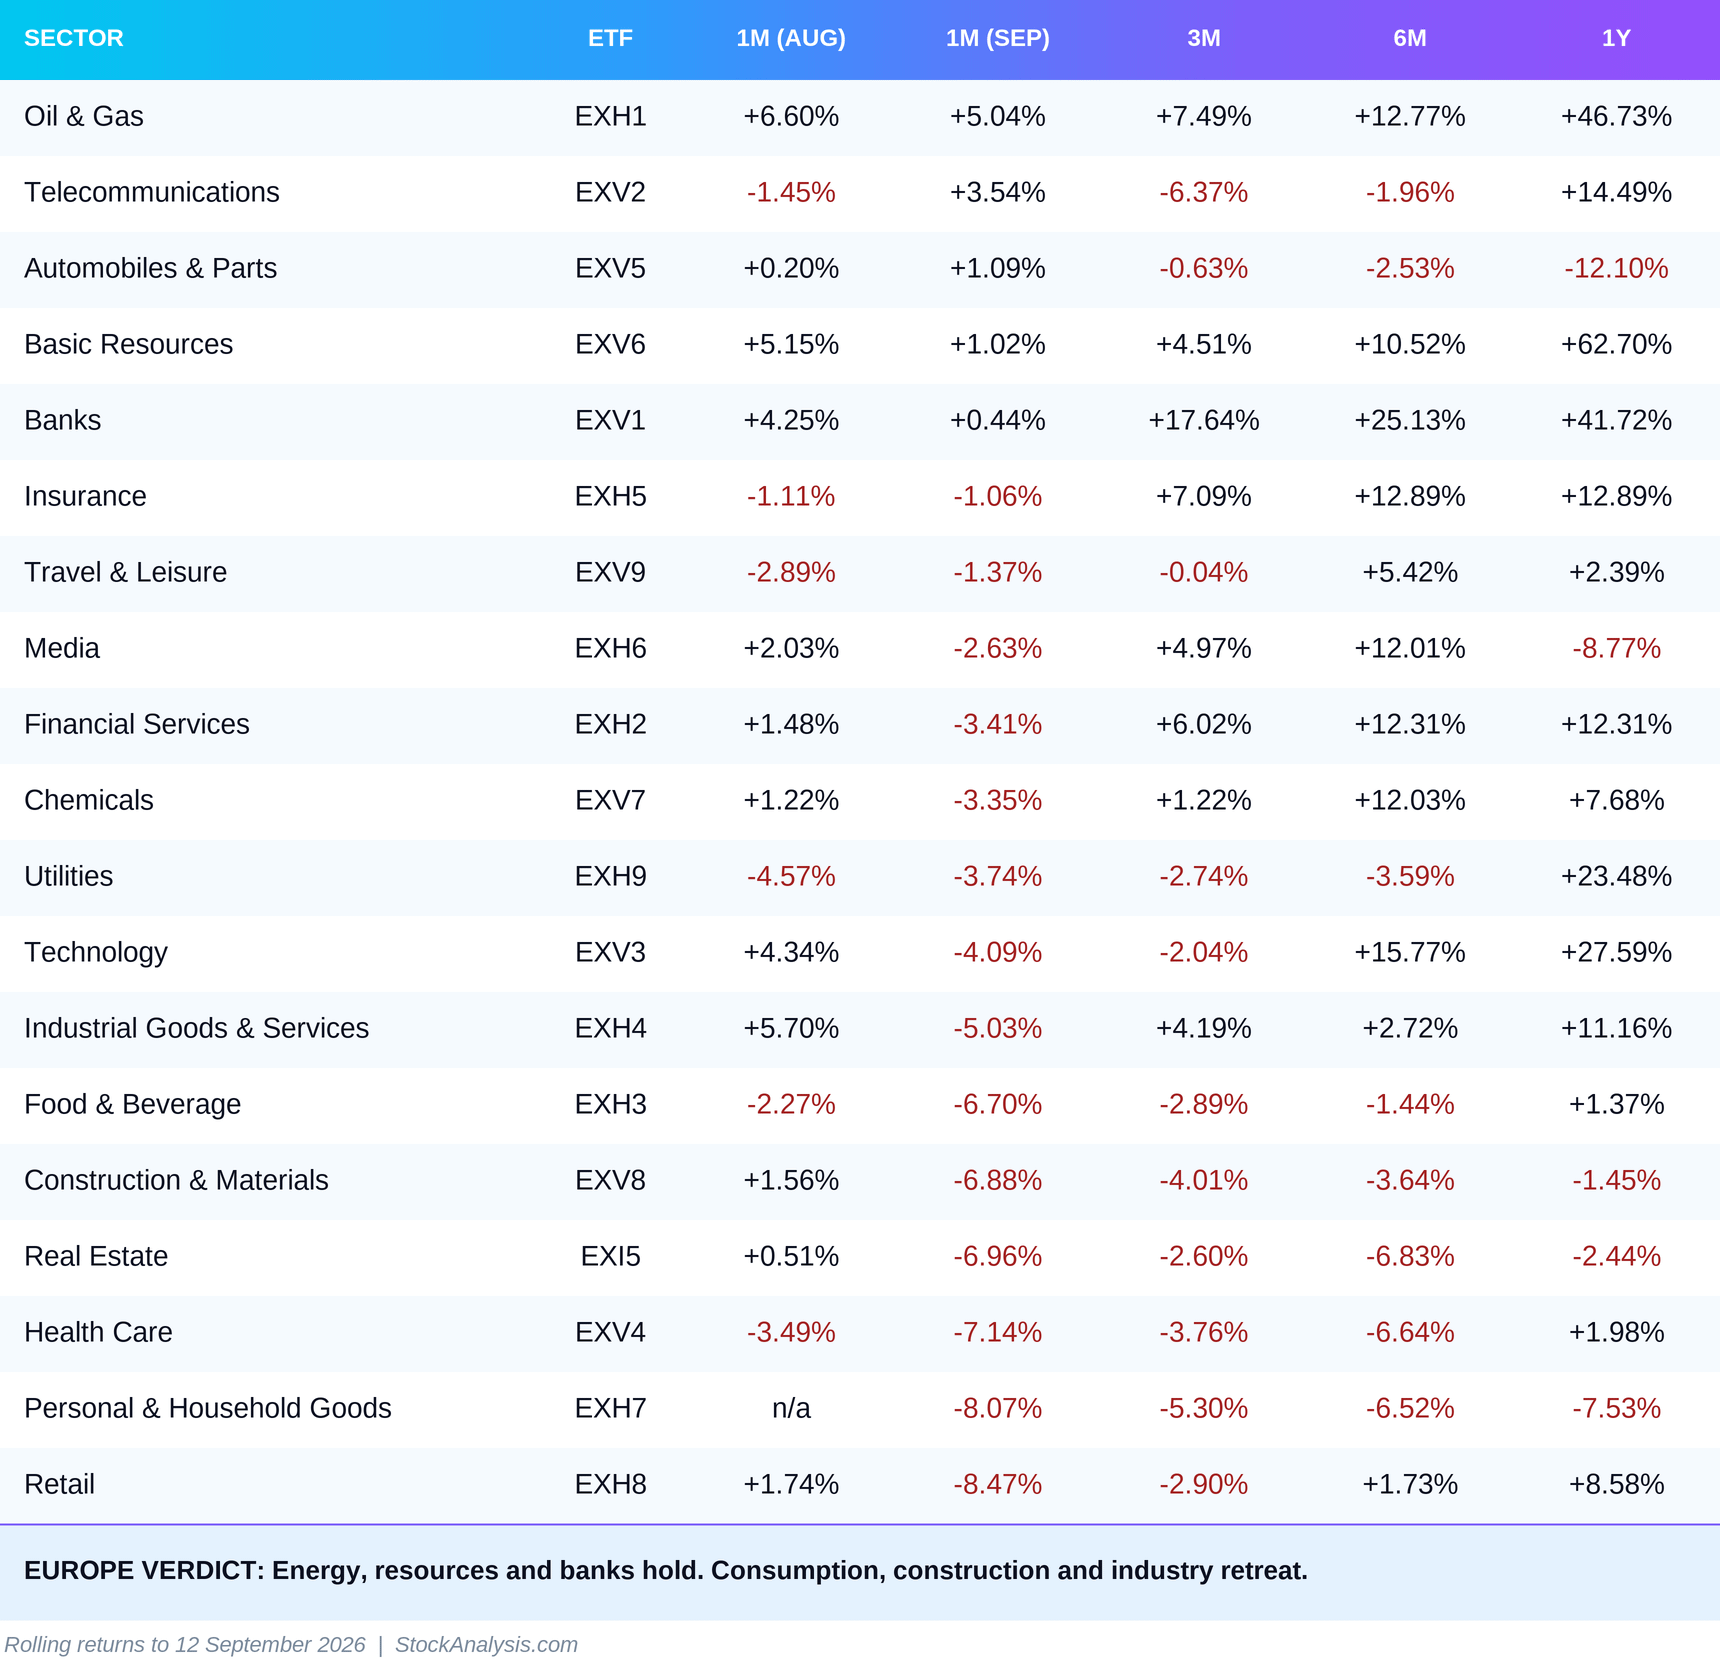
Europe repeats the US energy story, but with a heavier decline below the surface. Oil and gas lead with a 5.04% gain. US XLE is stronger at 8.24%, again illustrating the difference between a producer that benefits directly from a higher commodity price and a region that absorbs more of the inflation cost of imported energy.
Telecommunications are the surprise. EXV2 reverses from a 1.45% decline in August to a 3.54% gain. Its three-month return remains negative at 6.37%, however, so this is stabilisation from a low base. Automobiles also move slightly above zero, but their six-month and one-year returns remain negative. The structural pressure from Chinese competition and Europe’s slow domestic transition has not disappeared.
Banks retain Europe’s strongest established trend. The monthly gain is only 0.44%, but the three-month return is 17.64%, the six-month return 25.13% and the one-year return 41.72%. Higher rates support income from lending margins as long as the economy avoids recession. The ECB’s latest increase extends that support, but it also raises the risk to credit quality.
Basic resources also deserve a separate place. EXV6 adds 1.02% in September after gaining 5.15% in August and remains among the few European sectors in positive territory. It is the clear one-year leader at 62.70%, ahead of oil and gas and banks. This is a continuation of the commodity cycle, not a signal of broad acceleration in Europe. While industry, chemicals and construction fall, mining and metals companies preserve their accumulated premium.
The real story sits in the bottom half of the table. Technology reverses from a 4.34% gain to a 4.09% decline. Industrial goods and services swing from a 5.70% gain to a 5.03% loss. Real estate falls 6.96%, construction 6.88%, health care 7.14% and retail 8.47%.
European health care remains weaker than its US counterpart despite the same demographic support from ageing populations. The difference lies in composition and regulation. The European fund is more concentrated in pharmaceutical companies exposed to price controls, while the US fund includes a broader set of insurers, service providers and medical device makers.
Asia: Semiconductors against China
In Asia, we use country funds rather than sectors. Currencies, regulation and economic cycles differ too widely to fit into one common sector index. This month, the country map shows the clearest division anywhere in the world.
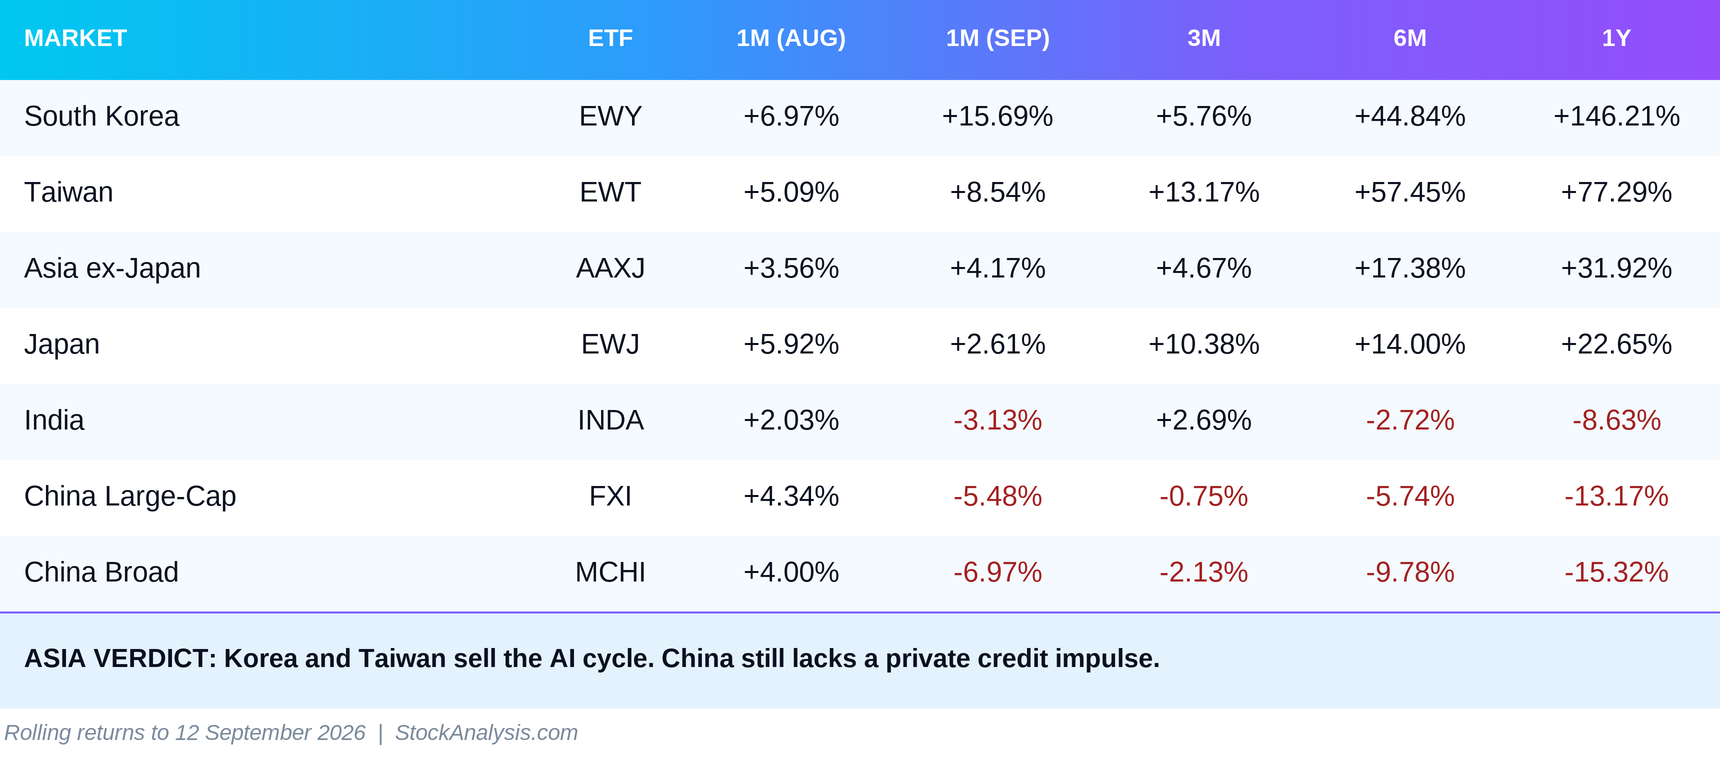
South Korea leads with a 15.69% monthly gain. The signal is unambiguous. EWY is up 44.84% over six months and 146.21% over one year. Samsung Electronics and SK Hynix together account for almost half of the fund, making Korea a direct position in memory and artificial intelligence infrastructure.
Taiwan adds 8.54% and remains the structural six-month leader with a 57.45% return. TSMC and its surrounding supply chain give the market something missing from the broad cyclical trade: visible scarcity, strong demand and a specific role in global capital spending on artificial intelligence.
Japan is up 2.61%, but slows from August. The higher long end sends a two-sided signal. It attracts capital towards Japanese bonds and reduces the appeal of the carry trade, while also showing a normalisation of domestic yields. The BOJ meeting on 17 and 18 September will determine which force dominates.
China turns fully downward. FXI falls 5.48% and the broad MCHI fund loses 6.97%. Their six-month returns are negative 5.74% and negative 9.78%, respectively. September’s liquidity analysis already showed the mechanism. China’s social financing in July was supported almost entirely by government bonds, while bank lending and household borrowing contracted. The state can create financing, but private credit impulse has not started.
India is also negative and remains down over both six and twelve months. This continues to contradict the idea that India automatically benefits whenever capital leaves China. Investors now want a specific source of profit and a defensible valuation, not merely an alternative geography.
Latin America: The dollar helps again, but not everyone
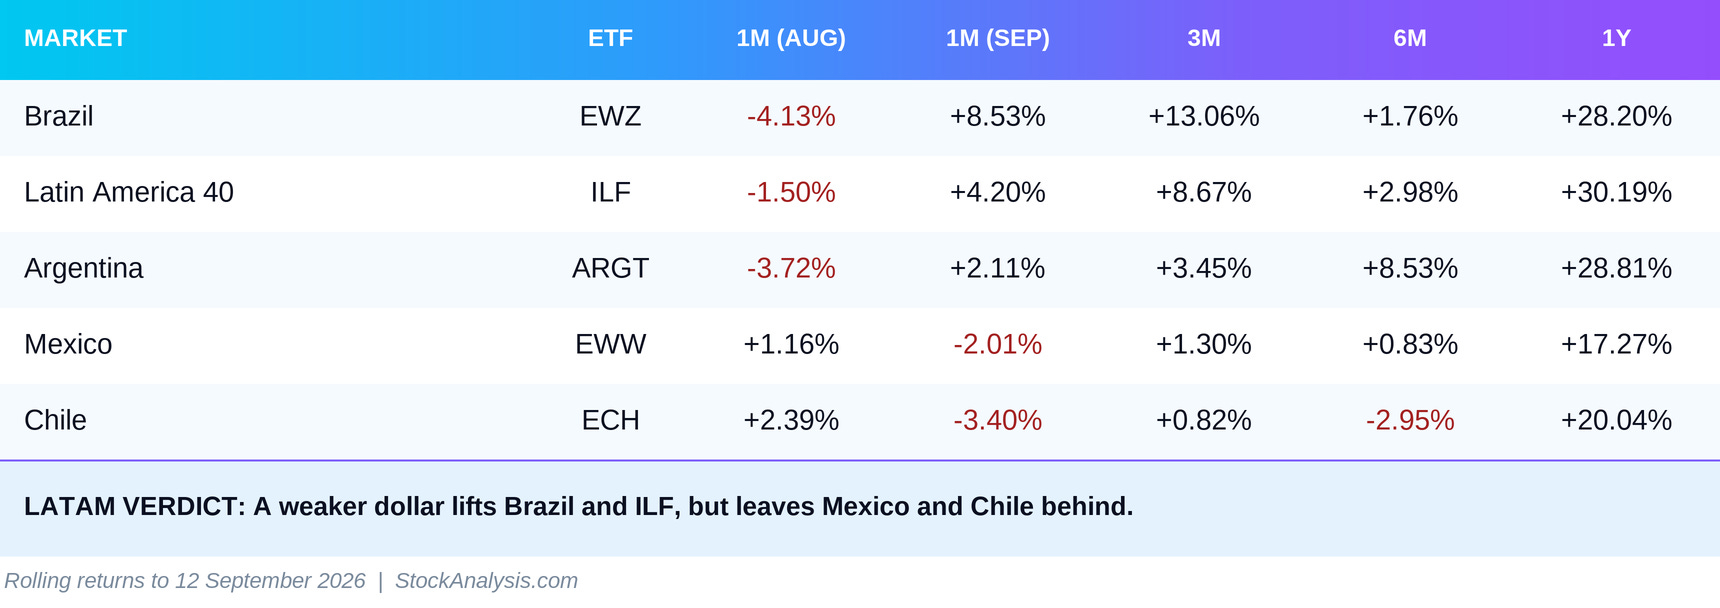
The weaker dollar is once again a tailwind for Latin America. It reduces the local cost of dollar debt and supports the dollar value of local assets. The regional ILF fund gains 4.20% after losing 1.50% in August.
Brazil makes the largest reversal. EWZ swings from negative 4.13% to positive 8.53% and is now up 13.06% over three months. Its six-month return of only 1.76% shows that this is a strong tactical recovery, not a completed structural breakout. High domestic real rates and fiscal risk have not disappeared.
Argentina returns to positive territory with a 2.11% gain. Its reform thesis, based on fiscal consolidation and liberalisation of the currency regime, remains separate from the regional cycle. It does not lead this month, but neither is it breaking down.
Mexico and Chile show the limit of the dollar explanation. EWW falls 2.01% and ECH 3.40% despite the weaker dollar. Mexico remains exposed to the US trade and political cycle. Chile is an indirect bet on Chinese industrial demand through copper, and weakness in Chinese equities offers no confirmation of a new commodity cycle.
The rotation signal
Capital is not fleeing risk. It is refusing to pay for risk without a visible source of profit.
The first theme is the persistent energy premium. XLE and EXH1 remain at the top for a second consecutive month. The move is symmetric across the United States and Europe, which makes its cause global. The difference in scale again favours US producers. Europe gains through its companies but loses through its economy because it depends more heavily on imported energy. The ECB’s decision has converted that cost into a higher interest rate.
The second theme is the geographic split in technology. Korea and Taiwan accelerate, US XLK keeps its strength but loses momentum, and European technology returns to negative territory. The market is not buying the word AI everywhere. It pays most where scarcity in chips, memory and production capacity provides the clearest visibility into future earnings.
The third theme is the discipline of the long end. The US ten-year yield, the German Bund and the 30-year Japanese government bond yield are rising at the same time. The result appears across regions. US industrial and consumer sectors fall, European real estate, construction and retail sit among the weakest, and the Japanese market slows before the next BOJ decision.
The quiet signal is that defensive sectors are not providing defence. Consumer staples, utilities and health care fall in the United States, while their European counterparts are even weaker. If this were panic, the VIX would be above 20 and capital would be seeking predictability at any price. Instead, the VIX is 17.84. The market does not pay for a defensive label when higher bond yields offer an alternative.
September’s map is narrower than August’s, but it is no less rational. Energy has physical scarcity and a geopolitical premium. Korea and Taiwan have a specific role in the global AI cycle. Brazil is receiving help from a weaker dollar. Every other asset must prove why its earnings can withstand more expensive long-term capital.
The next test comes immediately, with Fed and BOJ decisions in the same week. If the long end continues higher, the narrow market will become narrower still. If yields settle, the first real confirmation of broader leadership should come from industry and consumption, not from another peak in energy alone.
Data and sources
ETF performance: StockAnalysis, retrieved on 12 September 2026. Values are rolling returns as displayed by the source.
Federal Reserve effective rate and ten-year yield: FRED DFF and FRED DGS10.
FOMC decision of 29 July 2026: Federal Reserve.
Broad Dollar Index: FRED DTWEXBGS.
VIX: FRED VIXCLS.
ECB decision of 10 September 2026: European Central Bank.
September ECB macroeconomic projections: ECB staff projections.
Ten-year German government bond yield: Deutsche Bundesbank.
Bank of Japan decision and calendar: BOJ statements and BOJ meeting calendar.
30-year Japanese government bond auction of 3 September 2026: Japan Ministry of Finance.
Monthly RRG-style methodology and numerical verification: Liquidity Desk calculations using the final available weekly adjusted price in each month for SPY and the 11 US sector ETFs.
Liquidity Desk | liquiditydesk.org