

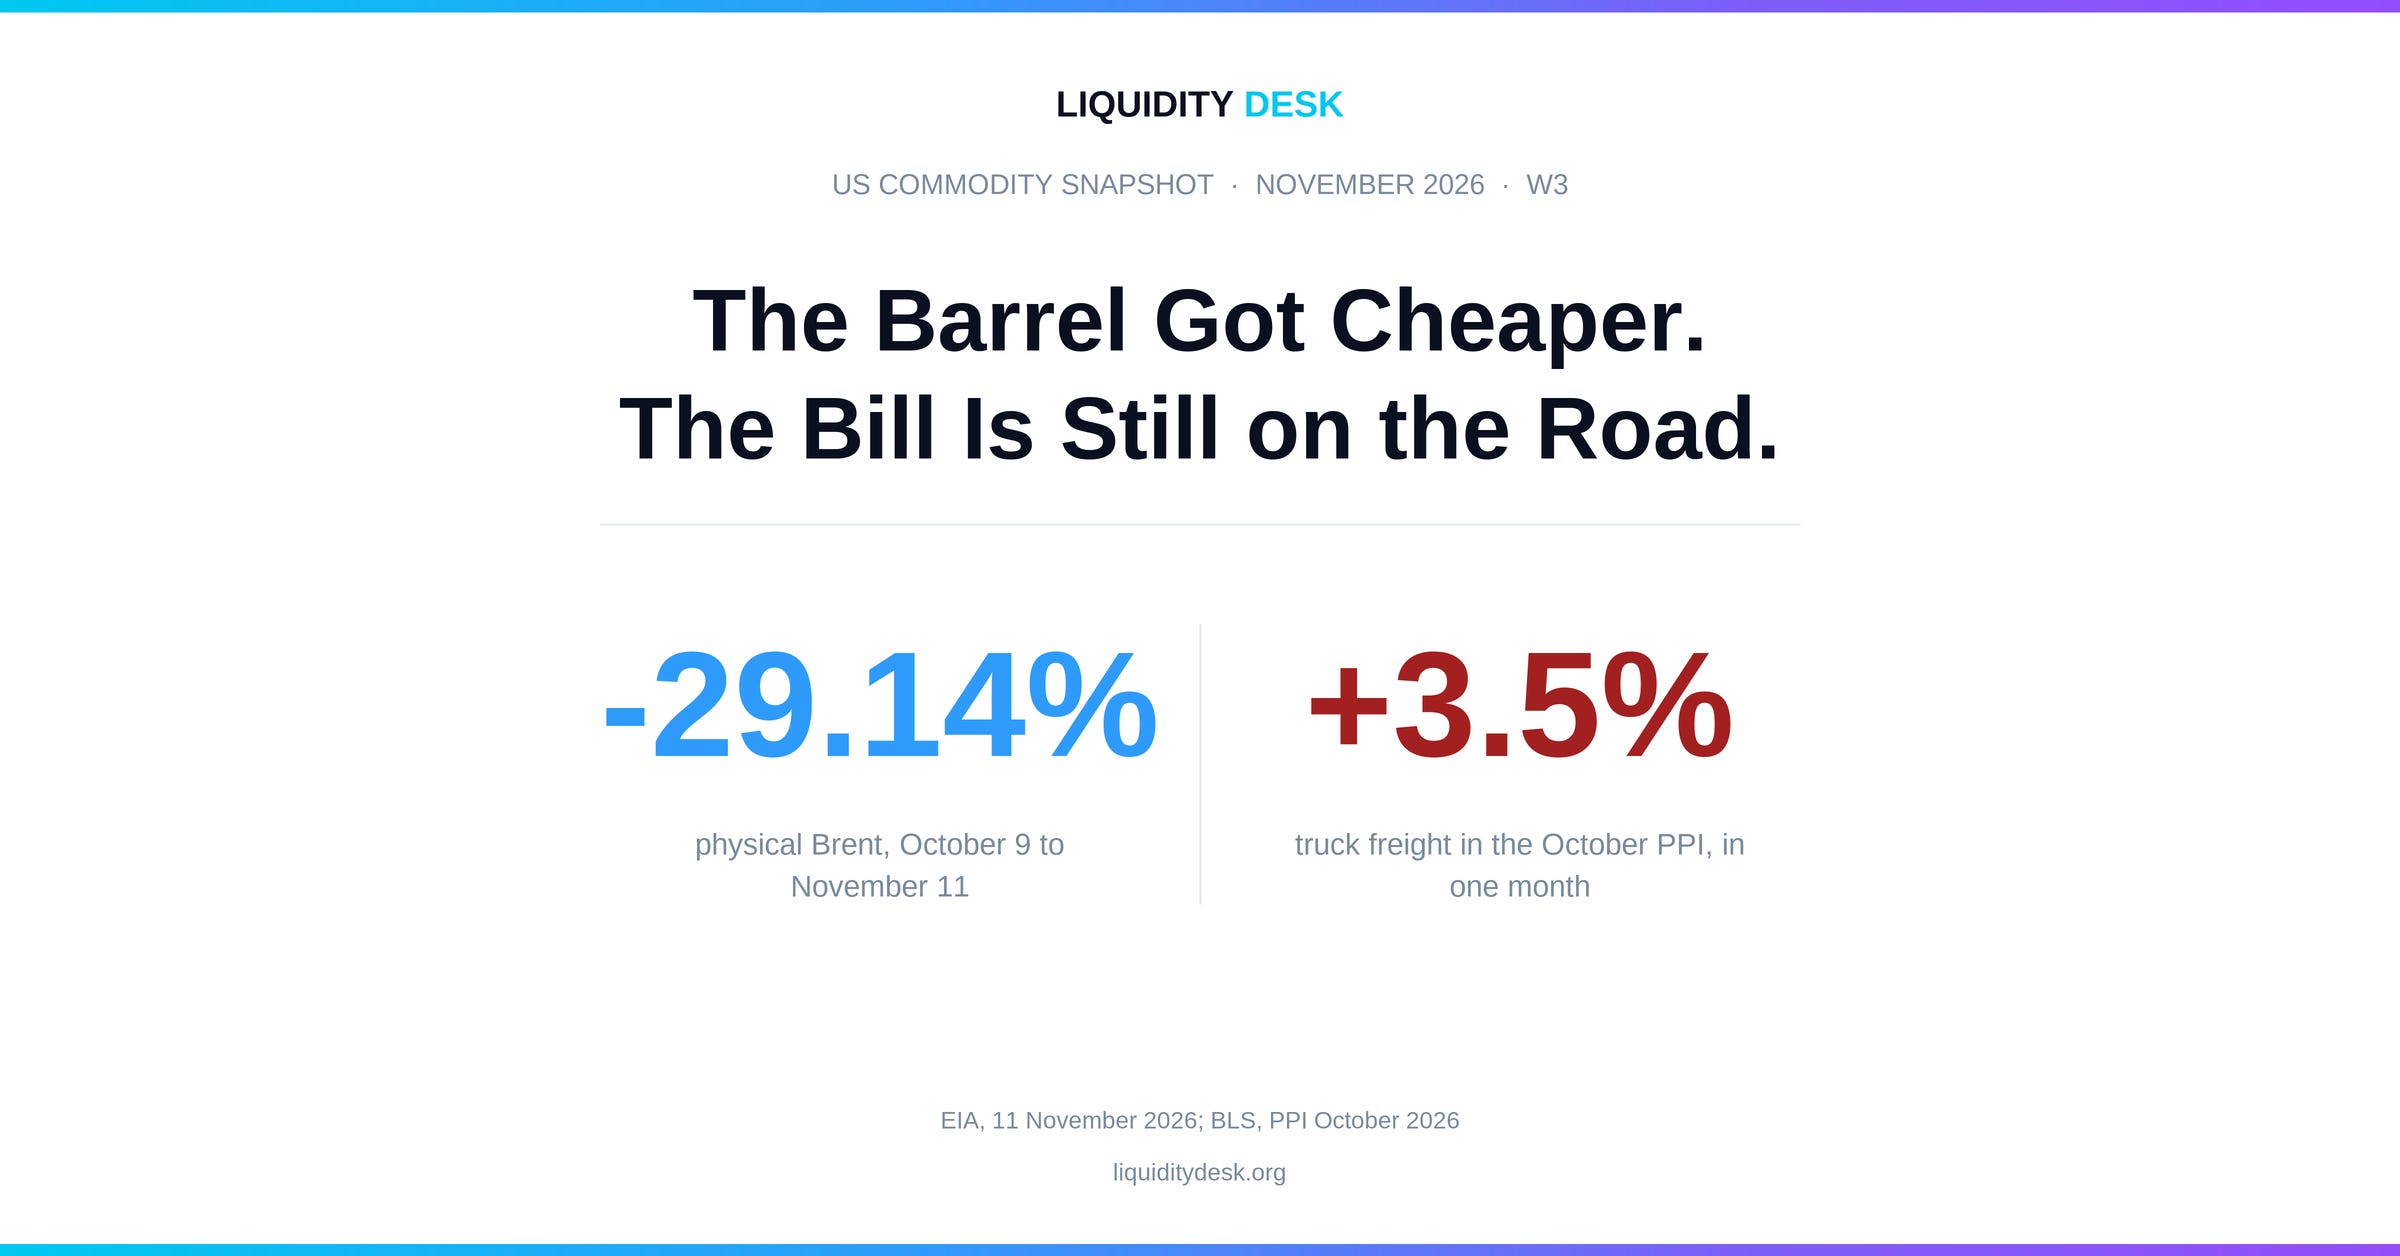
In one month the seaborne barrel lost almost a third of its price. Physical Brent fell from $130.03 to $92.14, and its premium over US WTI, which was above $30 in October, has almost disappeared. Exports from the Persian Gulf are recovering, and according to the IEA the world is producing more oil than it burns for the first time since the war began. That is the good news, and it arrived fast. Everything after the refinery travels more slowly. Wholesale diesel fell half as much as crude, the pump price of diesel is down less than 1% in four weeks, and truck freight rates rose 3.5% in October alone. On November 3 America voted with gasoline at $4.15 and diesel at $6.29, and handed the Democrats both chambers of Congress. According to the NBC News exit poll, 87% of voters were concerned about the price of fuel. Gasoline fell below $4 a week later. Diesel has been above $6 for nine weeks in a row. The price of the commodity falls at the speed of the news. The bill travels at the speed of the truck. That is why the Federal Reserve is discussing a rate increase in December just as Brent is at its cheapest since late August.
Energy: the war premium vanished in three sessions
The October edition described seven White House moves against the price of diesel and concluded that none of them would arrive in time for the election. Relief did come, but not from Washington and not from Moscow. It came from the tankers in the Persian Gulf. Physical Brent was $120.15 on October 30 according to the EIA and $91.84 on November 4. That is a fall of almost a quarter in three sessions. On November 11 the price was $92.14, 29.14% below its level on October 9. WTI at Cushing fell much less, by 9.23% to $89.62. The gap between the two grades narrowed from $31.30 to $2.52. In October we called it the premium of war and freight. Now it is close to zero.
The cause lies in physical flows, not in a signed peace. According to the IEA’s November report, Gulf exports excluding Oman reached 18.4 million barrels a day in October. That is still 26% below the pre-war level, but crude oil is already back to 82% of it. World supply rose by 2.3 million barrels a day in a month, and observed inventories increased for the first time since June. Reuters describes how this is happening: some tankers pass through Hormuz with their tracking signals switched off to avoid attack. The EIA, independently, expects production to exceed consumption in the fourth quarter. Politics added noise in both directions. According to The Guardian, the price fell to its lowest since late August after Trump said the war with Iran was “practically over”. According to DTN, two days later he said the US should not seek a deal with Tehran, and Iran reported a tanker hit by a mine in the strait. Oil still ended a second straight week lower. The market now trades the barrels it can see, not the statements it hears.
This is where the good news stops. It is crude oil that is recovering, not fuels. According to the IEA, refined product exports from the Gulf remain around half their pre-war level, onshore inventories are the lowest since at least 2016, and diesel in Europe is 77% above its pre-war price. For now the surplus is floating in tankers. The agency calls the diesel shortage the “main concern” of the market and of consumers.
America shows the same picture on a smaller scale. Distillate inventories rose by 4.1 million barrels in the week to November 6, to 103.3 million. The deficit against the 2021-2025 seasonal average narrowed from 12.2% to 8.4%, and on the East Coast from 29% to 20.7%. Refineries are running at 95.2% of capacity, and distillate exports fell to their lowest weekly level since March. The buffer is filling, but it is not yet full. The Strategic Petroleum Reserve is paying part of the bill. It fell by 2.6 million barrels in the week to 279.5 million, the lowest level in the EIA’s weekly series since October 1982. In October we wrote that the G7 pledge did not show up in US data. Now it is starting to.
Natural gas remains a separate story. Working gas in storage is 3,862 billion cubic feet, 75 billion above the five-year average. Henry Hub is $3.00 per MMBtu, 21% below last year.
The election: fuel was on the ballot
On November 3 the Democrats won majorities in both the House of Representatives and the Senate. The new Congress takes office in January. This is the main political news of the month, and it is directly tied to the dashboard below, because voters said so themselves.
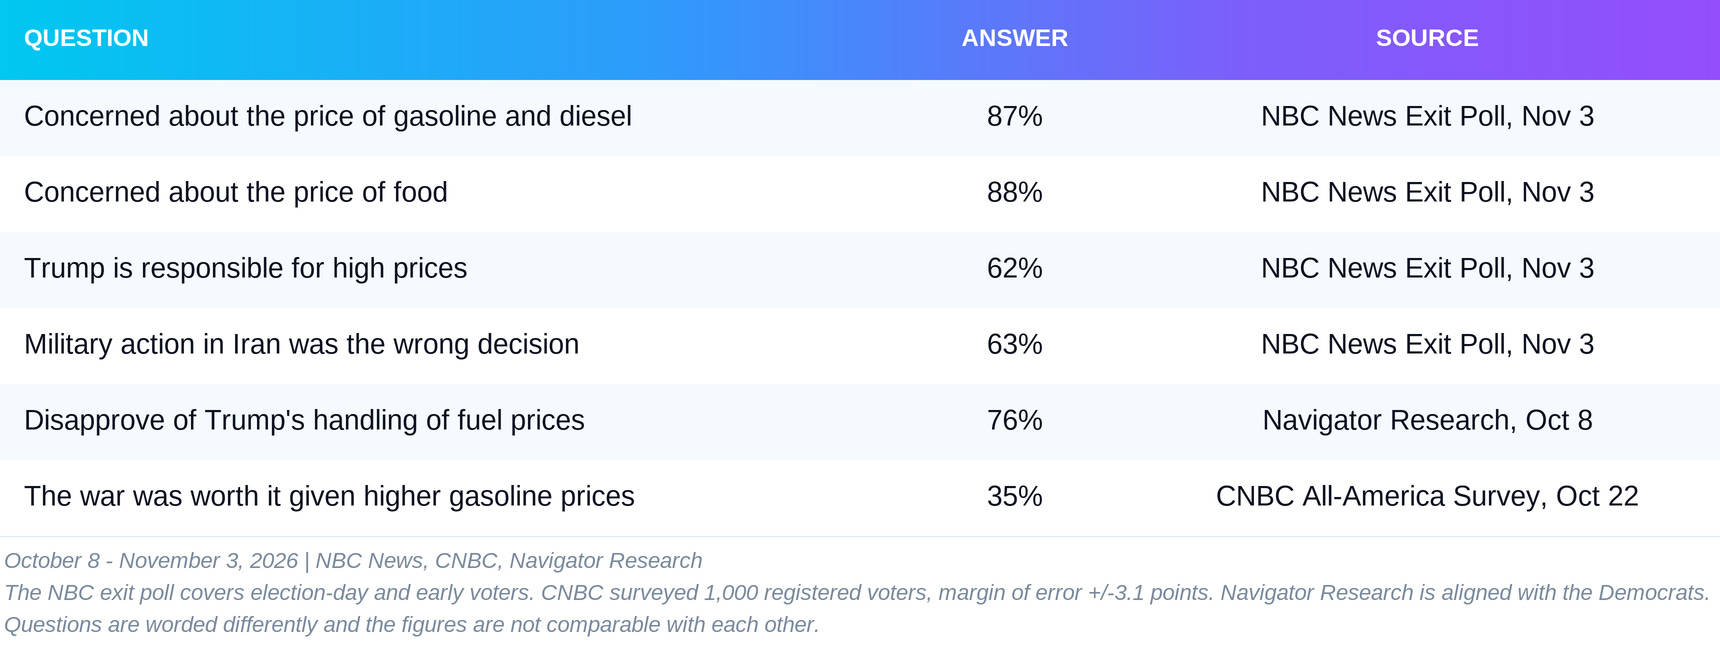
The economy was the most important issue for 39% of voters, and just under eight in ten say inflation is a hardship for their family. Unlike in 2024, voters trust Democrats more than Republicans on economic issues. Approval of the President among voters is 38%. Two details matter for our subject. The first is that food weighs more than fuel. In the CNBC survey 34% named food prices as their biggest concern, and 23% the price of gasoline. This is the same chain we follow: fuel is the visible price, and food is where it arrives later. The second is timing. In the week before the vote gasoline was already 33 cents below its September peak. Diesel was 24 cents below its own. Physical Brent fell 14% on the day after the election, from $107.03 to $91.84. We do not claim that one caused the other, because Gulf exports had been rising since September. We note only that voters cast their ballots with the prices they remember, not the ones on the way. The political bill for a price shock is paid with the same delay as the freight bill.
What does this mean for commodities? Nothing changes in law before January. After that the Democrats will have majorities, but not the two thirds needed to override a presidential veto. According to NBC News, their ideas include limiting the war in Iran and temporarily suspending the federal excise tax on gasoline and diesel, and Texas Senator-elect James Talarico says he is ready to work with Trump on it. The federal excise tax is 18.3 cents a gallon on gasoline and 24.3 cents on diesel. Suspending it would lower the pump price without adding a single gallon of supply. In a market where the bottleneck is the refinery, cheaper fuel from a tax measure raises demand exactly where supply is missing.
The US commodity dashboard
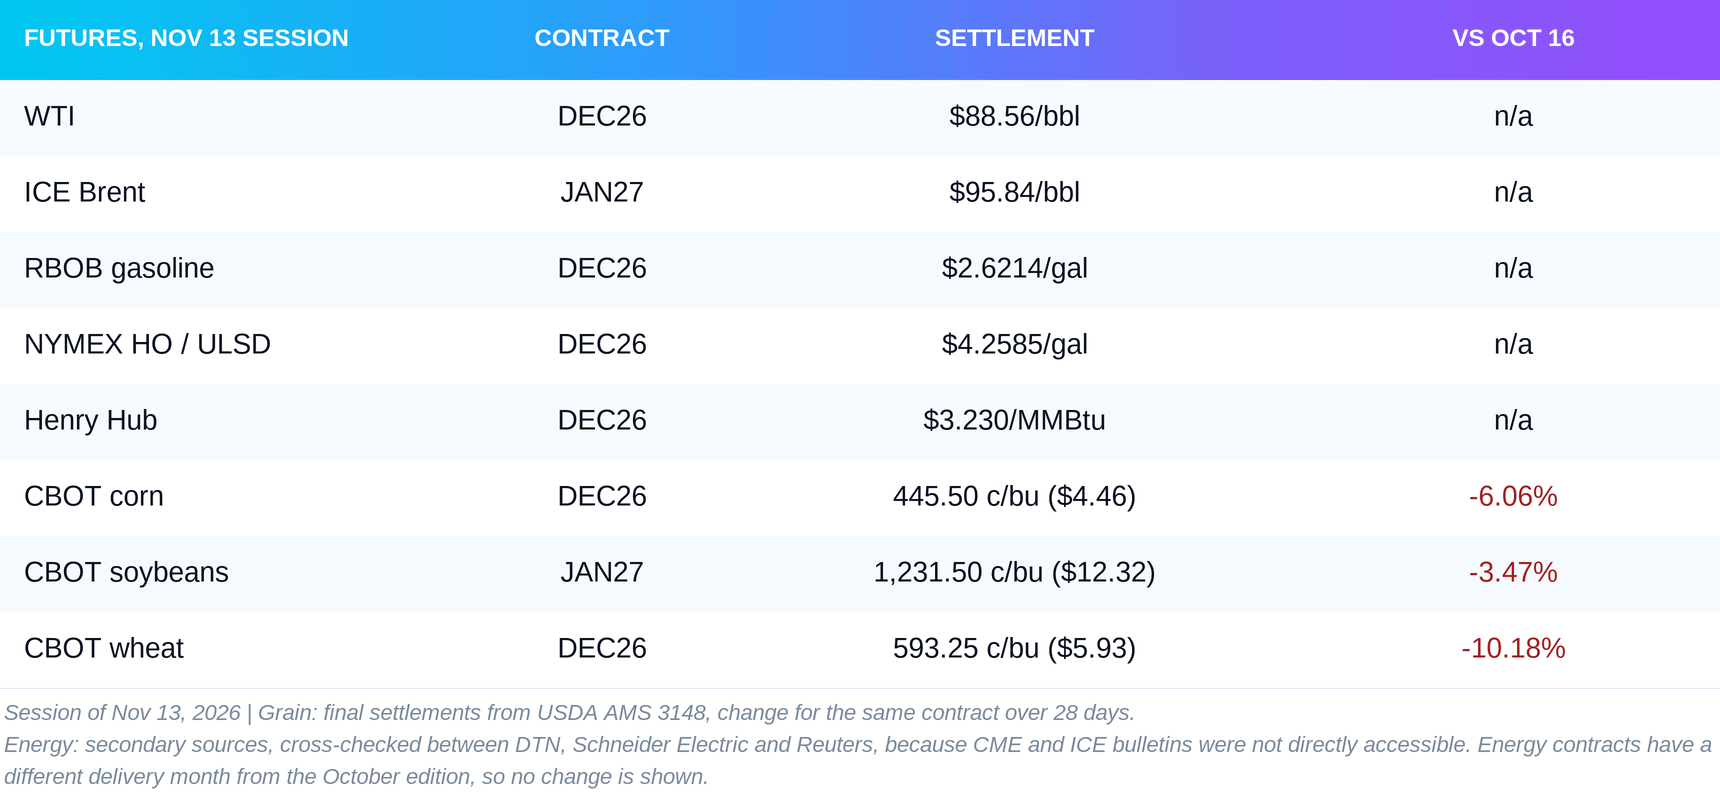
The dashboard combines different sources, because the official history of futures contracts is not publicly available. Percentages are calculated only within the same series. Futures prices are shown in a separate table below.
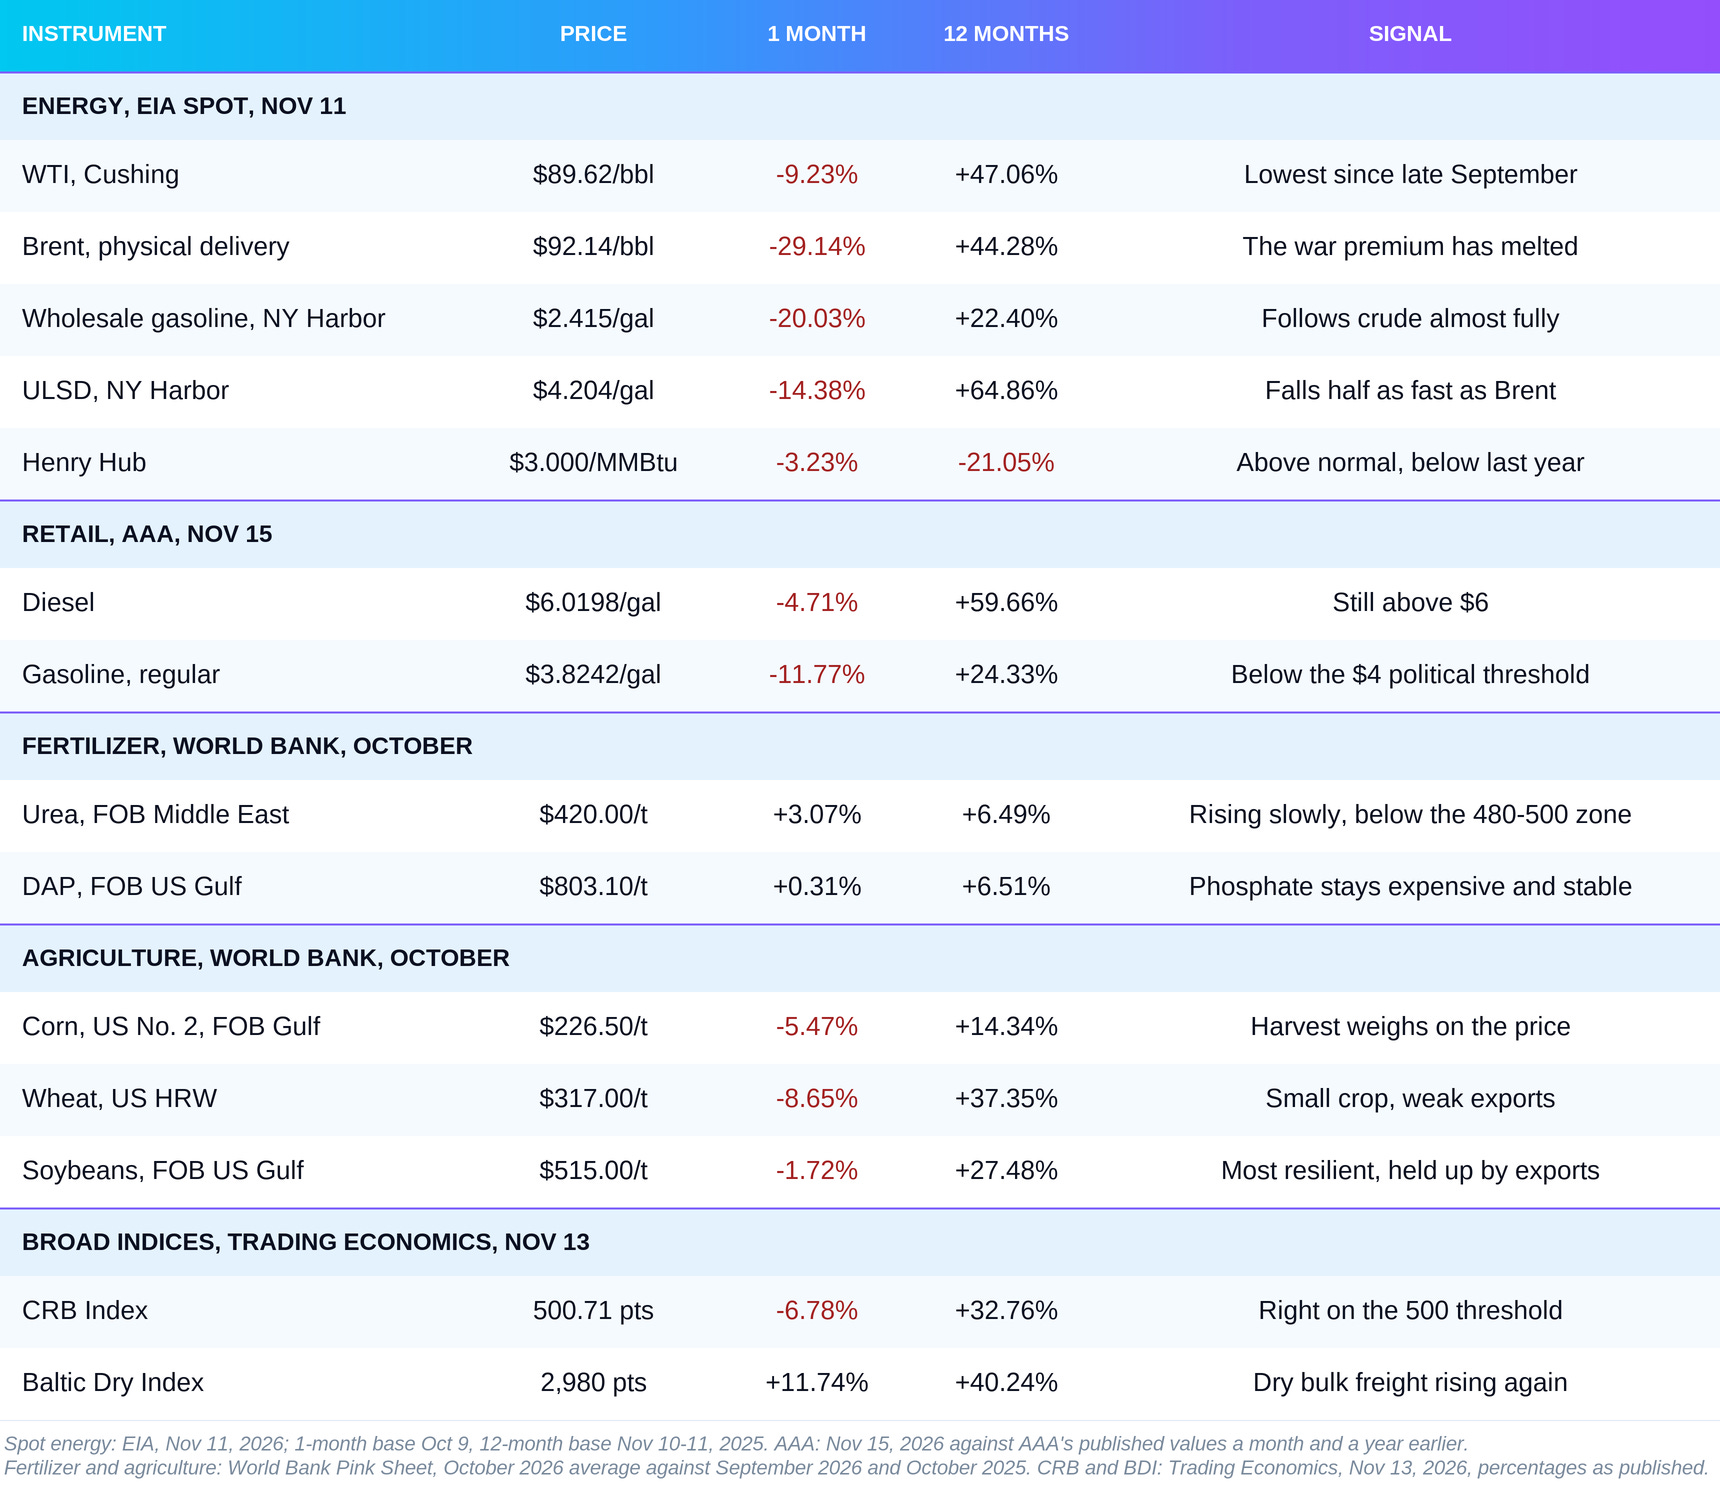
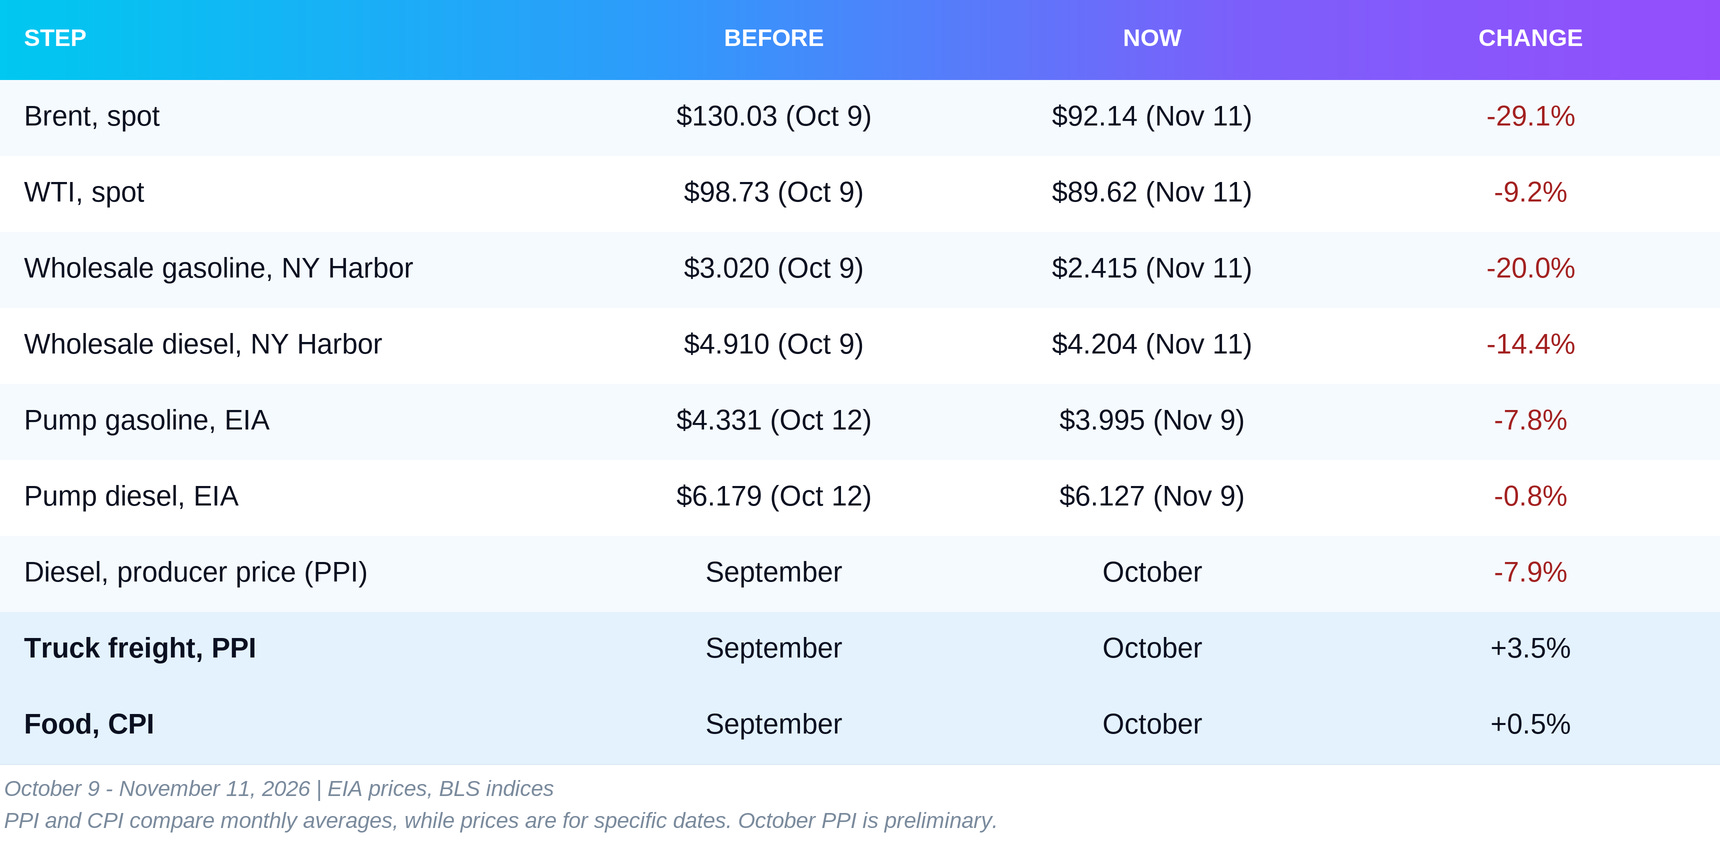
The easiest way to read the dashboard is to follow the barrel. Brent is down 29%, wholesale gasoline 20%, wholesale diesel 14%, and diesel at the pump less than 5%. Each step further down the chain receives a smaller share of the fall. World Bank monthly averages lag spot prices. Its energy index rose 7.11% in October, because the average Brent price for the month was $125. The decline since the start of November will appear in the next edition of the table.
Urea is quoted on the international benchmark, FOB Middle East. The USDA regional report for Oklahoma puts it at $643.04 a ton at the dealer as of November 13, against $638.08 in our previous edition. The two prices belong to different markets and are not compared as a percentage.
Russian diesel set sail but did not arrive
In October we set eight signals and a base case: within 30 days, Washington’s promise would stay on paper. Here is the scorecard.
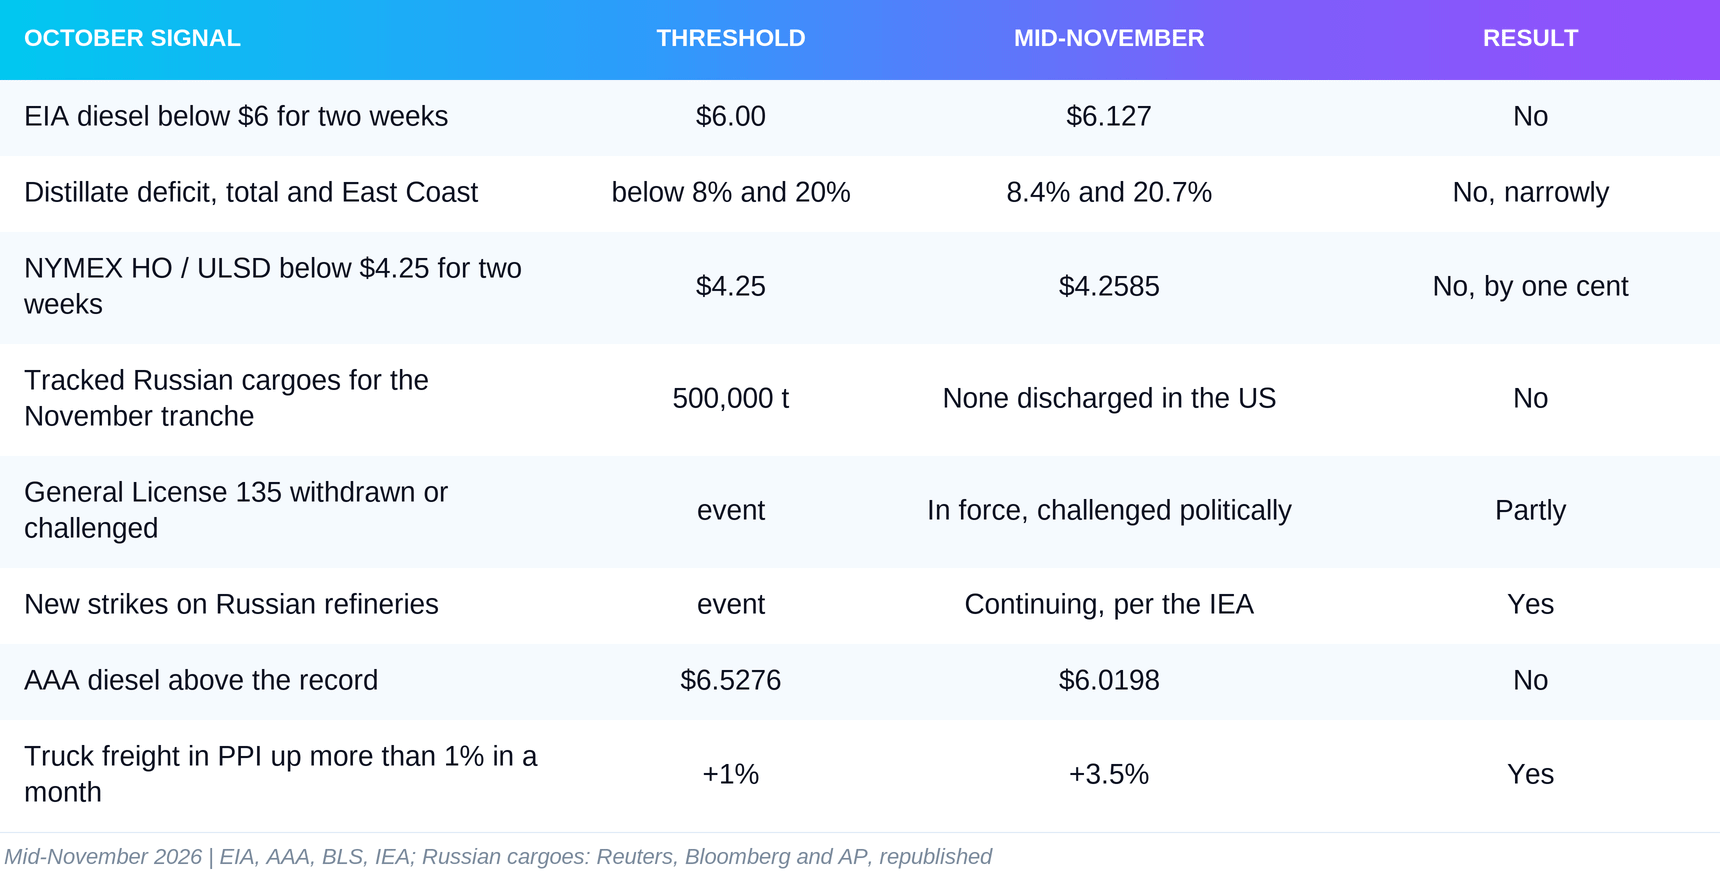
Scenario B was confirmed for the period it covered. None of the three price thresholds for relief was crossed, although all three are within reach. We were wrong about something else. We expected pump diesel to stay close to October levels, and it started to come down. And the cause was none of the seven moves.
The Russian deal delivered exactly as much as the law allowed. According to Deputy Prime Minister Novak, Russia exported around 510,000 tonnes of diesel in October and plans 2.15 million tonnes in November, while the general export ban stays in place until the end of January with exemptions for individual suppliers. Yet not a single cargo has been discharged in America. Three tankers have changed course, the last one about 400 nautical miles from New York, after the Governor of New Jersey and several senators warned ports and owners of liability under the 2022 law. That is the legal knot we described in October. Energy Secretary Chris Wright told Reuters that the cargo would go to another port and that the aim is for the diesel to reach the world market. That is our October argument, now voiced by the administration: the deal is not for the American market, it is for the world market. How much it helped cannot be separated from the larger factor, the barrels from the Gulf. The IEA is categorical on one point only: strikes on Russian energy infrastructure continue to keep Russian diesel off international markets.
The transmission chain: how much of the fall reaches each step
The chain from the barrel to the till receipt also works in reverse, but not at the same speed.
Channel 1: crude oil to the gasoline pump
Gasoline is the channel that works by the textbook. EIA regular gasoline fell to $3.995 a gallon in the week of November 9, below $4 for the first time since mid-July. AAA has it at $3.8242 on November 15. The political threshold was crossed to the downside in the week after the November 3 election.
Channel 2: ULSD to freight and producer prices
With diesel, the fall gets lost along the way. A barrel turned into diesel in New York is worth about $177, while the crude in it costs about $90. The difference of about $87 is the margin after the refinery, by our calculation. In October it was above $107, so it is narrowing, but it remains several times the gasoline margin of about $12. An ECB analysis of November 11 describes the same thing in Europe: the diesel margin is about three times its pre-conflict level, and in energy crises margins affect final prices almost as much as oil itself. At the pump it looks like this: diesel costs $2.13 more than gasoline. A year ago the difference was 78 cents. It has been larger only once in the EIA weekly data, the week before. When the commodity gets cheaper and the bottleneck sits after the refinery, the driver gains before the carrier does.
The second part of the channel is the delay. The producer price of diesel fell 7.9% in October, while truck freight rose 3.5% for the month and 20% for the year. There is no contradiction. Carriers renegotiate contracts and fuel surcharges with a lag of 6 to 10 weeks. October invoices carry September diesel, when the pump price was at a record. Overall PPI is 6.5% above last year.
Channel 3: gas and urea to the next season
This channel remains the quietest. Urea was $420 a ton in October, 3% above September and well below the $480-500 zone we watch. The risk comes from abroad: gas in Europe is $28.50 per MMBtu, 162% above last year, against under $3 in America. Farm diesel in Oklahoma keeps getting cheaper, and one USDA contact reports a price just under $5 a gallon for the first time.
Channel 4: biofuels hold up demand
EPA mandates do not depend on the oil price, and the USDA is leaving its projections unchanged: 5.650 billion bushels of corn for ethanol and 17.8 billion pounds of soybean oil for biofuels. Ethanol production is 1.13 million barrels a day. What changes is the extra demand above the mandate. With WTI below $90, biofuels lose part of their price advantage. That is one reason corn has slipped below $4.50.
The last step is the shelf. In October we wrote that expensive diesel was not raising food prices in the same month, because the September CPI showed no change in food. October shows 0.5%. One month is not a trend, but the direction is the one the delay implies. A cost that did not show up in the price on time has not disappeared. It is on its way.
Grain: a smaller crop, a lower price
In November the USDA cut its corn forecast, and the price fell. That is the opposite of September, when a smaller crop pushed the price to $5.28 a bushel.
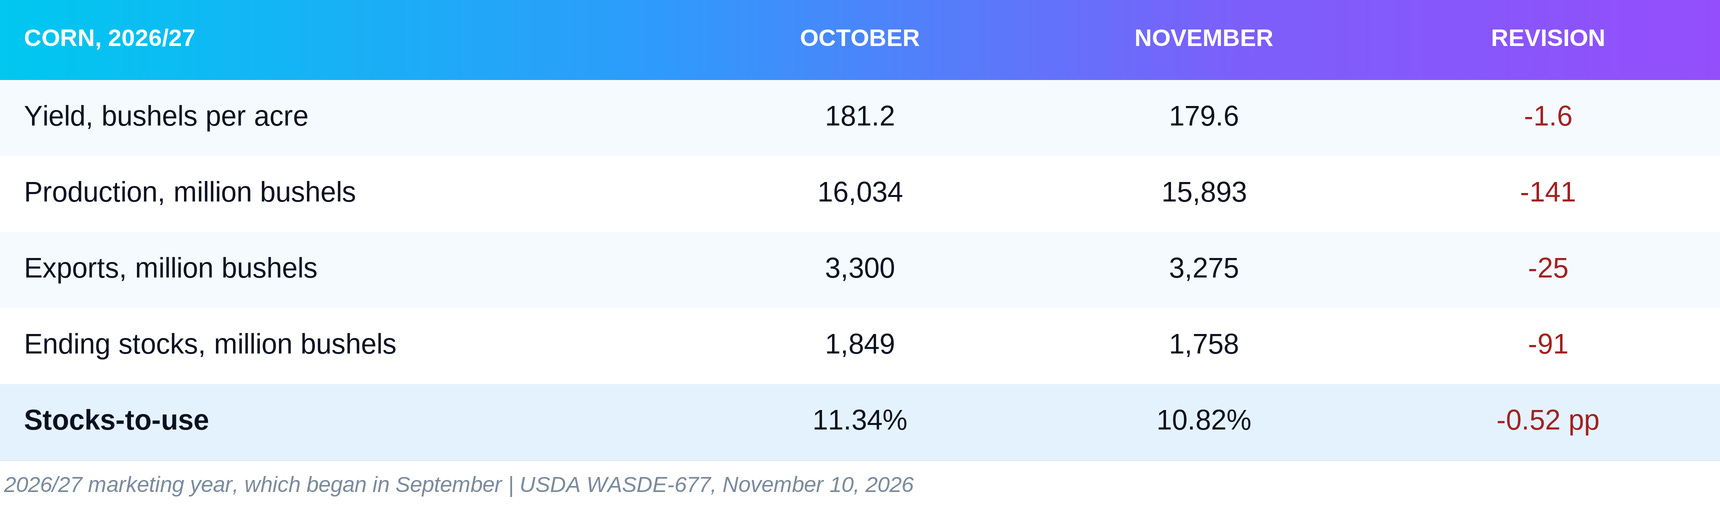
The December contract settled at 445.50 cents on November 13, 6.06% below its level on October 16. The explanation is demand. The USDA cut both exports and feed use. Accumulated export commitments at the end of October were 24.8 million tonnes, 34% below last year, and inspected shipments since the start of the season are 16% lower. The harvest is 81% complete and the grain is going into storage. Add cheaper oil, which also lowers the value of ethanol. Stocks remain below last year’s, 1.758 against 2.095 billion bushels, so this is not a market in surplus. It is a market that no longer pays for fear. The March contract is 2.5% above December. That premium covers storage and financing and is typical of a curve when there is enough grain.
Wheat repeats October’s lesson in a sharper form. The December contract is 593.25 cents, down 10.18% in four weeks and below the $6 threshold we watch. The US crop is 22.9% smaller than last year’s, but inspected exports since the start of the year are 16.5 million tonnes against 21.4 million a year earlier. A small harvest does not make grain expensive if the world does not want to buy it. New winter wheat is 89% planted, and 49% of the crop is rated good or excellent, up 5 points in a week. Soybeans are the exception. The USDA raised exports by 25 million bushels and cut ending stocks to 300 million, 6.5% of use. The January contract is down only 3.47%.
The conclusion for food has two sides. The raw material for bread, feed and cooking oil is getting cheaper. Moving it is still getting more expensive. The coming months will show which of the two weighs more on the shelf.
CRB at 500: right on the threshold
The CRB Index stood at 500.71 points on November 13, 6.78% below its level a month ago and 32.76% above a year ago. Since July we have watched 500 points as the line between a new broad commodity impulse and normalisation. The index is sitting right on it. The decline is about energy. Energy makes up 39% of the index, agriculture and livestock 34%, industrial metals 18%, and precious metals 9%. With Brent down 29% and grain down 6 to 10%, the index loses less than 7%, because metals are holding it up. Copper was $14,508 a ton in October, 35% above last year and unchanged on the month. Precious metals fell 6.2%.
The Baltic Dry Index moved the other way, rising 11.74% for the month after falling almost a quarter in October. The index tracks dry bulk cargoes, not tankers. It says nothing about the cost of shipping oil, but it does show that physical demand for ore, coal and grain is not weakening along with oil.
A full cycle reversal would require the CRB below 400, WTI below $70 and a broad decline in every group. None of the three is in place. This is a correction driven by one component, just as the rise was. In September one product lifted the index. In November one product is pulling it down.
The Fed: oil is falling, rates may rise
On October 28 the Fed held its target range at 3.75-4.00% by a vote of 10 to 2. The two dissenters, Lisa Cook and Beth Hammack, wanted an increase. The next meeting is on December 8-9. On November 10 Christopher Waller said he leans towards a 25 basis point increase in December. He added a condition: if October core CPI came in at around 0.3% for the month or higher, a 50-point increase should be considered. The data came out the same day. Core CPI was 0.3%. Headline was 0.4%, energy 0.7% and gasoline 1.0%.
Why would a central bank tighten when oil is getting cheaper? The answer is the same delay that the chain describes. A note by Fed economists of November 9 estimates that since the pandemic, oil price increases have passed through to core inflation about 14 times more strongly than before it. In their model, at current oil prices core inflation is close to 2.8% around mid-2027. That is a model result and depends on its assumptions, but it is the one Waller cites. The central bank is not looking at the price of today’s barrel. It is looking at how much of yesterday’s barrel has not yet reached prices. The other data point the same way. PCE for September was 3.6% annually and core PCE 3.1%. Michelle Bowman estimates October core PCE at 3.3% and attributes about a quarter of the overshoot above target to energy. There is no annual CPI rate for October, because the BLS has no October 2025 base after the federal funding lapse at the time.
The supply shock trap is turning around. In September an interest rate could not produce diesel. Now supply is returning on its own, and the Fed is preparing to tighten against second-round effects: freight, food, wages. The risk lies in the two clocks running out of step. If rates rise in December and invoices start falling in January, the tightening will arrive together with the relief.
What we are watching over the next 30 days
The question for the next month is simple: will the cheaper barrel reach the end of the chain before the Fed decides on December 9?
Signals that the fall is reaching the pump
EIA diesel falls below $6 for two consecutive weeks and reaches $5.75 by mid-December. It is now $6.127. The wholesale price is already 14% lower, and the pump usually lags by two to three weeks.
The distillate inventory deficit narrows below 5%, and on the East Coast below 15%. It is now 8.4% and 20.7%. That would mean the buffer is filling before winter, not just before the holidays.
NYMEX HO / ULSD holds below $4.00 a gallon. It is now $4.2585. With WTI around $90, that means a margin after the refinery below $80 a barrel.
The gap between pump diesel and gasoline falls below $1.75. It is now $2.13. This is the simplest measure of whether the relief is reaching the carrier.
Signals that the fall stops short of the pump
Brent returns above $110. One successful strike on a tanker or terminal is enough. The surplus is in tankers, not in onshore tanks.
US distillate exports return above 1.5 million barrels a day on a four-week average. They are now 1.31 million. With diesel at $180 in Europe, the incentive to export is strong.
The November PPI shows another rise in truck freight of more than 1% for the month. That would mean surcharges are still going up rather than coming back down.
November core CPI is 0.3% or higher again. Then energy is no longer the explanation but the excuse.
Scenario framework
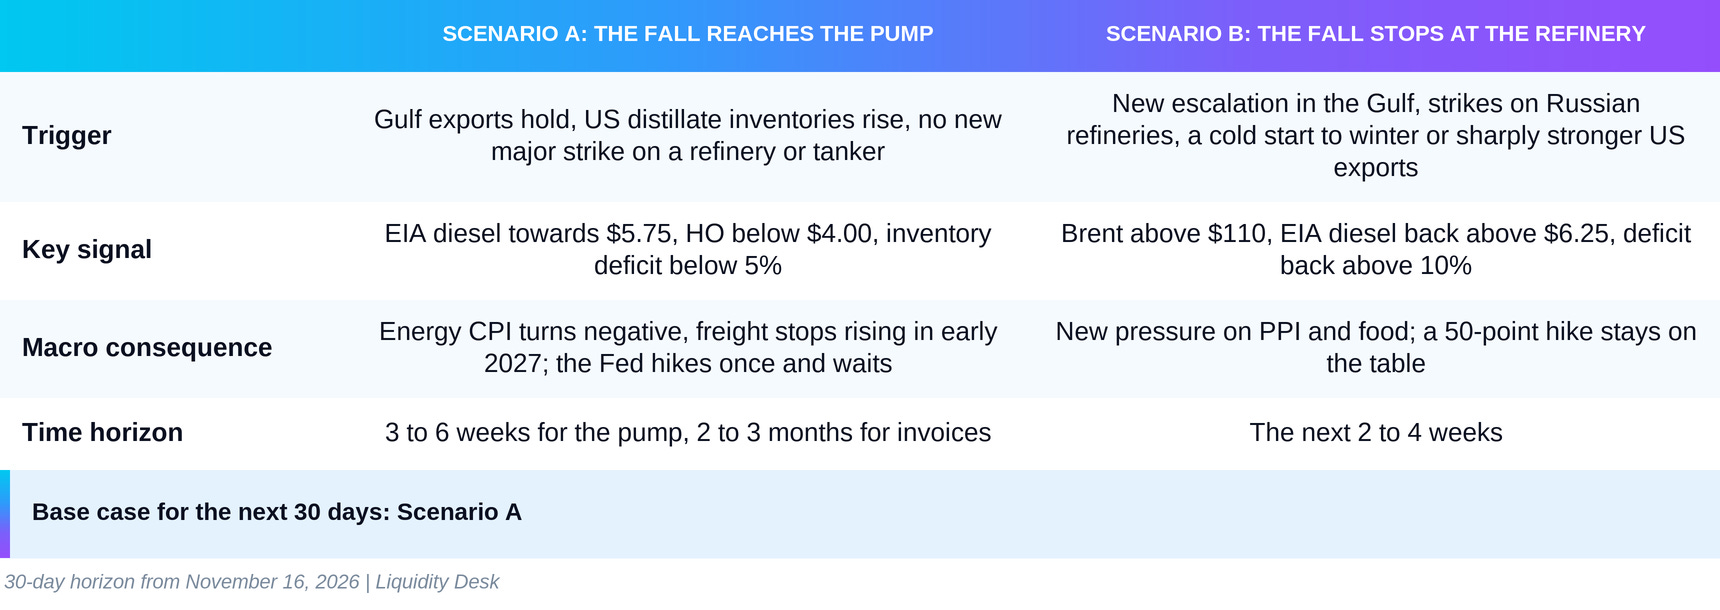
Our base case for the next 30 days is Scenario A: the fall reaches the pump. The wholesale price has already dropped, distillate inventories posted their largest weekly increase since July, refineries are running at 95%, and exports are declining. AAA diesel is two cents away from $6. All that is needed is for the current direction to hold. That does not mean the bill has been paid. The political one was paid on November 3. Freight invoices will keep rising for at least another month, because they carry the fuel price of six to ten weeks ago. Food has already moved. And the Fed will most likely raise rates on December 9, before November’s decline has entered its data. So we split the horizon. For the pump it is weeks. For invoices and for the interest rate it is the first quarter of 2027.
The strongest counterargument is that the surplus is on water, not on land. Onshore inventories are the lowest since at least 2016 and were still falling in October. Refined product exports from the Gulf are at half their normal level. Russian diesel is squeezed by strikes and by Russia’s own export ban. The war with Iran has not ended with a signature, tankers are sailing dark, and one mine could bring the premium back in three sessions, just as it went. The US Strategic Petroleum Reserve is at its lowest since 1982 and cannot serve as a buffer a second time. The EIA itself, in its November outlook, still expects Brent around $100 through the end of the year. Winter is only beginning, and East Coast distillates are a fifth below normal. If any of these links breaks, the fall will turn out to be a window rather than a turning point. The weak point of the counterargument is that for two months in a row physical barrels have outrun the bad news.
The barrel moves at the speed of the news. The truck does not.
Oil got a third cheaper. The bill for it has not arrived yet.
Sources
U.S. Energy Information Administration, spot prices and Henry Hub: WTI, Brent, gasoline, ULSD and natural gas through November 11, 2026; the WTI revision for October 12-14.
EIA, Gasoline and Diesel Fuel Update: weekly retail prices through November 9, 2026.
EIA, Weekly Petroleum Status Report, Table 6 and Table 9: inventories, the SPR, refinery throughput, exports and product supplied for the week through November 6, 2026.
EIA, Weekly Natural Gas Storage Report and ethanol production.
EIA, Short-Term Energy Outlook, November 2026: the global balance for the fourth quarter and the Brent forecast.
IEA, Oil Market Report, November 2026: Gulf exports, global supply, inventories, diesel in Europe and Russian supply.
Reuters, republished by The Straits Times, November 13, 2026: tankers sailing with tracking switched off. Media source.
The Guardian, November 13, 2026: Trump’s statement on the war with Iran and the lowest price since late August. Media source.
DTN, November 13, 2026 and Reuters: the week’s events and energy futures as of November 13; Schneider Electric for the cross-check. Media and secondary sources.
Bloomberg, republished by gCaptain, October 31, 2026: the Russian export ban, exemptions and Novak’s volumes. Media source.
Reuters, republished by gCaptain, November 10, 2026 and The Maritime Executive: the tanker Agioi Fanendes, the warnings from New Jersey and the Senate, and Secretary Wright’s comments. Media sources.
NBC News Exit Poll, November 3, 2026 and NBC News, Democrats won on affordability: the election result, voter attitudes and the excise tax proposals. Media sources.
CNBC All-America Economic Survey, October 22, 2026 and Navigator Research, October 8, 2026: pre-election polling on prices and the war. Navigator is aligned with the Democrats.
EIA, federal fuel taxes: the federal excise tax on gasoline and diesel.
AAA Gas Prices: retail prices as of November 15, 2026.
USDA AMS 3148: grain futures settlements as of November 13, 2026.
World Bank, Pink Sheet, November 2026: monthly prices and indices for October 2026.
Trading Economics, CRB and Baltic Dry: levels as of November 13, 2026.
FTSE Russell, CRB reconstitution notice: index weights.
USDA, WASDE-677, Crop Production and Crop Progress, November 9, 2026: balances, yield, harvest progress and winter wheat.
USDA ERS, Feed Outlook and USDA AMS, Grain Transportation Report: export commitments and inspections.
USDA AMS, Oklahoma Production Cost Report: fertilizer and farm diesel as of November 13, 2026.
U.S. Bureau of Labor Statistics, CPI October 2026 and PPI October 2026: consumer and producer prices.
U.S. Bureau of Economic Analysis, Personal Income and Outlays, September 2026: PCE.
Federal Reserve, FOMC statement, October 28, 2026 and FOMC calendar.
Federal Reserve, FEDS Note, November 9, 2026: oil pass-through to core inflation.
Christopher Waller, November 10, 2026 and Michelle Bowman, November 10, 2026: speeches.
ECB, Economic Bulletin box, November 11, 2026: refining margins.
This publication is for informational and educational purposes only. It does not constitute investment advice, a recommendation, or a solicitation to buy or sell any financial instrument. Past performance is not indicative of future results. Every investor should conduct independent research and assess their personal tolerance for risk.
Liquidity Desk | liquiditydesk.org