

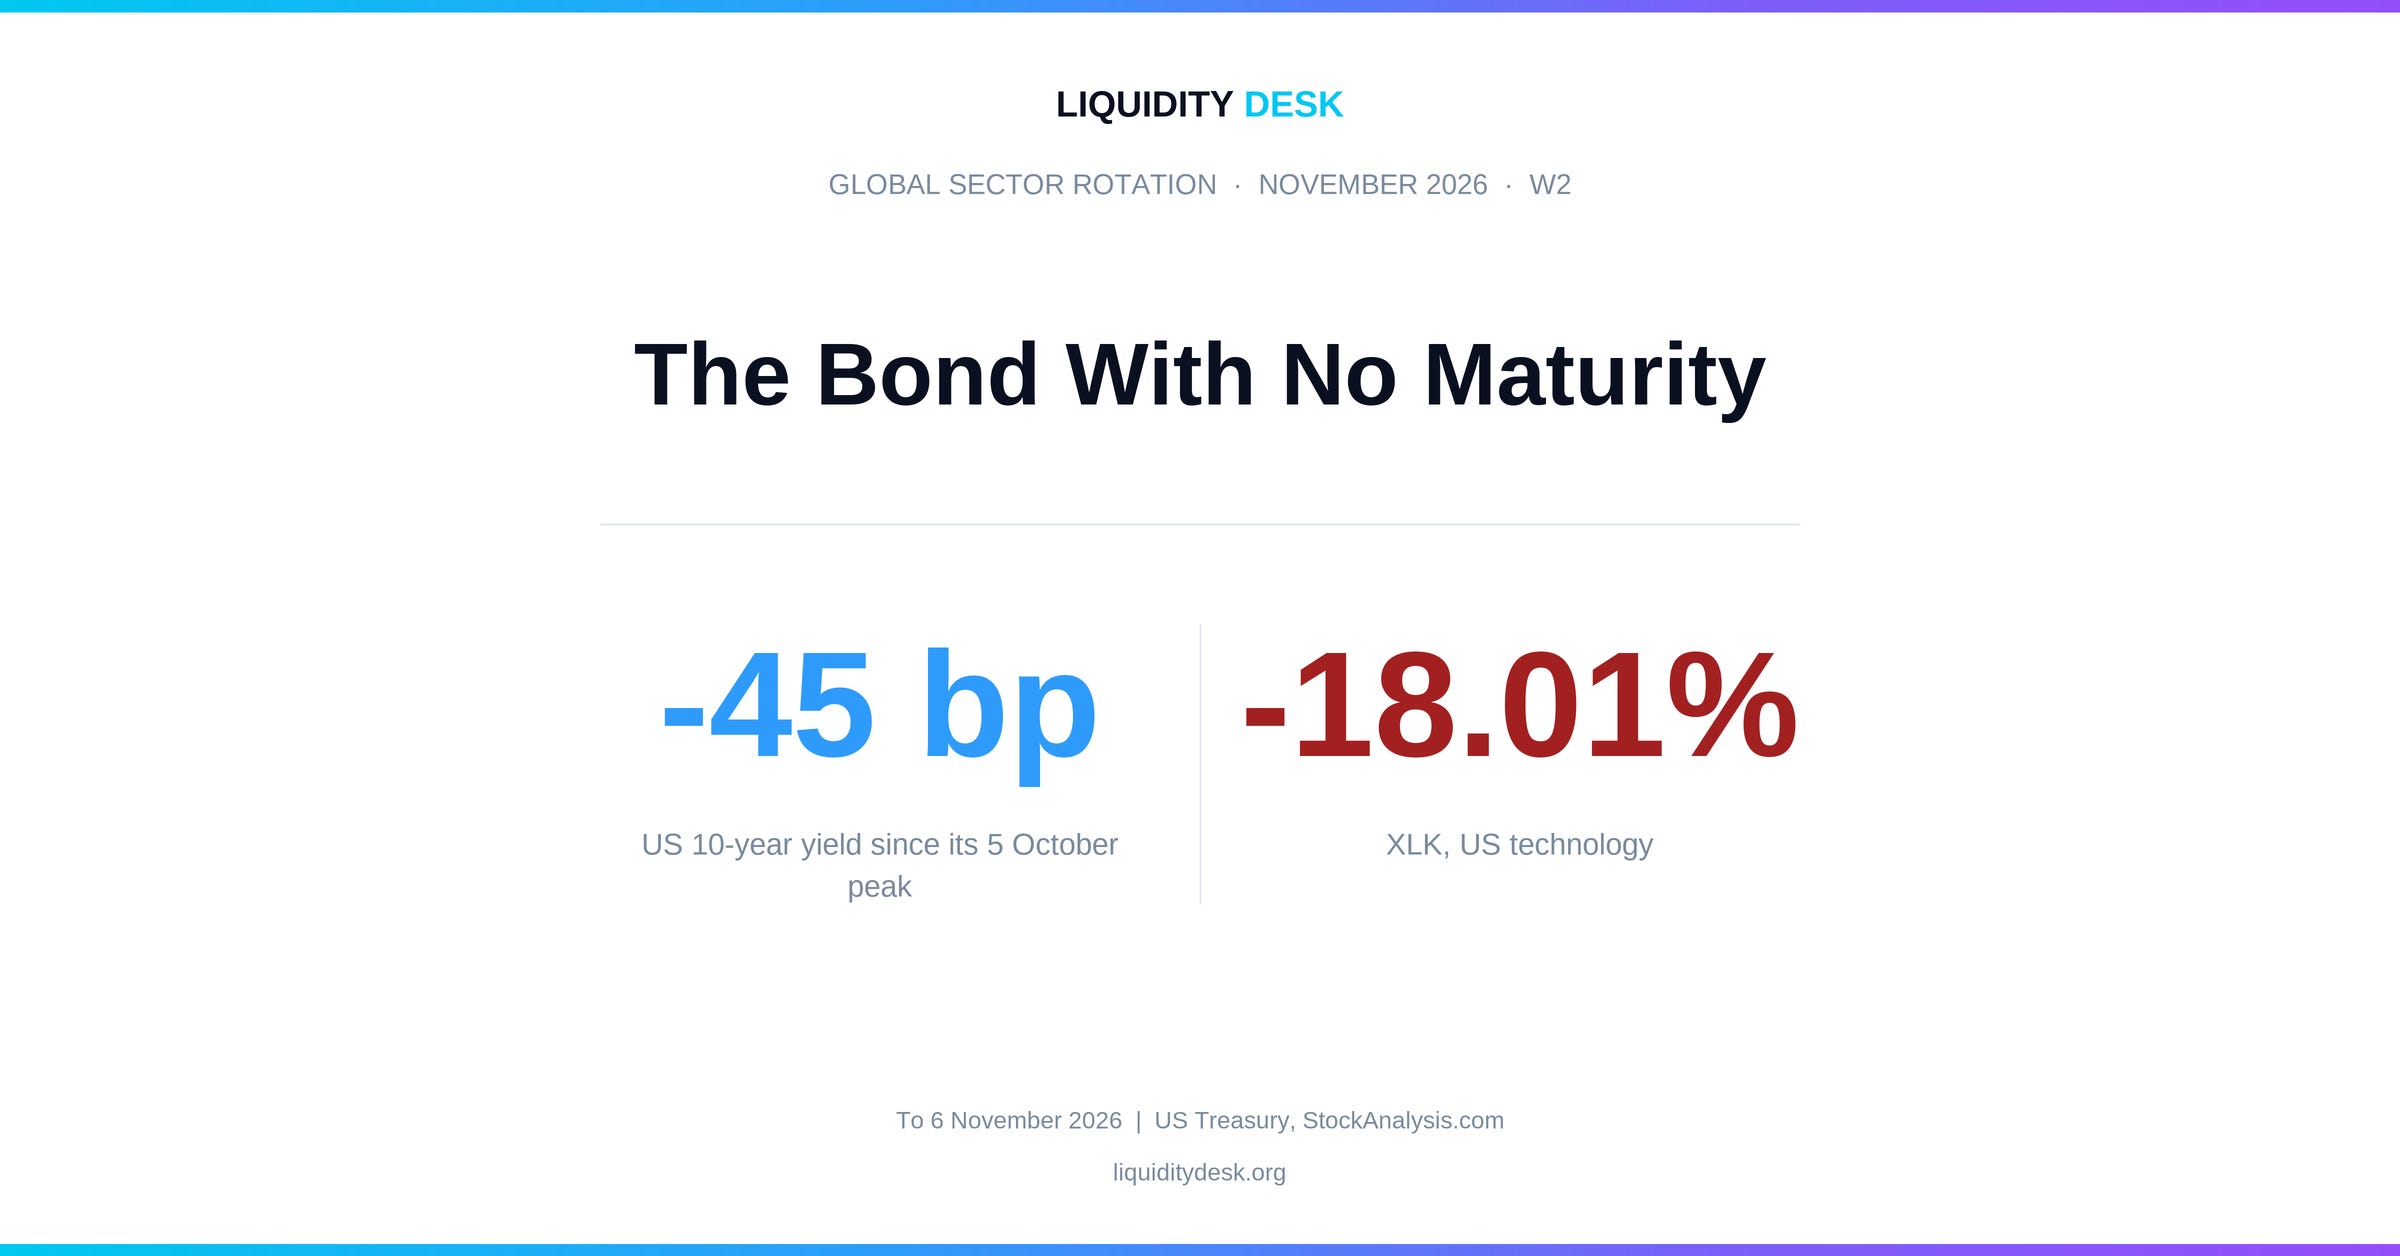
Last month technology was the only investment that paid more than bonds. Then bonds started to gain again, and the market began to ask when the other bond would pay out.
Two bonds
October described the ebb tide. Three central banks raised rates, the dollar strengthened and the US ten-year yield climbed above 5%. In that environment the market paid for one thing only: companies whose earnings grow faster than a government bond pays. Technology was almost the only sector that met that test.
On 5 October, the very day the one-month period in our tables begins, the ten-year yield reached 5.31%, its highest level in at least two years. Then it started to fall, and on 6 November it stood at 4.86%. For the first time in a year the long end is genuinely rallying: the 47 basis point drop to 5 November is the largest since the yield started climbing from 3.97% in October 2025.
At the same time, confidence in the other bond cracked. Investing in artificial intelligence resembles a bond that promises a high return but does not say when it will pay. Results from Meta and Alphabet, the collapse of CoreWeave and the US elections questioned not the promise itself but its maturity. While the real bond was losing money, nobody asked. Once it started to gain again, the comparison flipped.
The question this month is whether, with liquidity that is no longer growing, the expected return on artificial intelligence justifies an uncertain maturity. The market’s answer in November: not at any price.
Macro backdrop
The long end rallies for the first time in a year
The US ten-year yield has been rising for a year. From 3.97% in October 2025 it reached 5.31% on 5 October 2026. Along the way there were only two meaningful pullbacks, of 33 basis points between January and February and of 29 between May and June. The November drop is larger than both: to 4.84% on 5 November, or 47 basis points in a single month. On 6 November the yield was 4.86%.
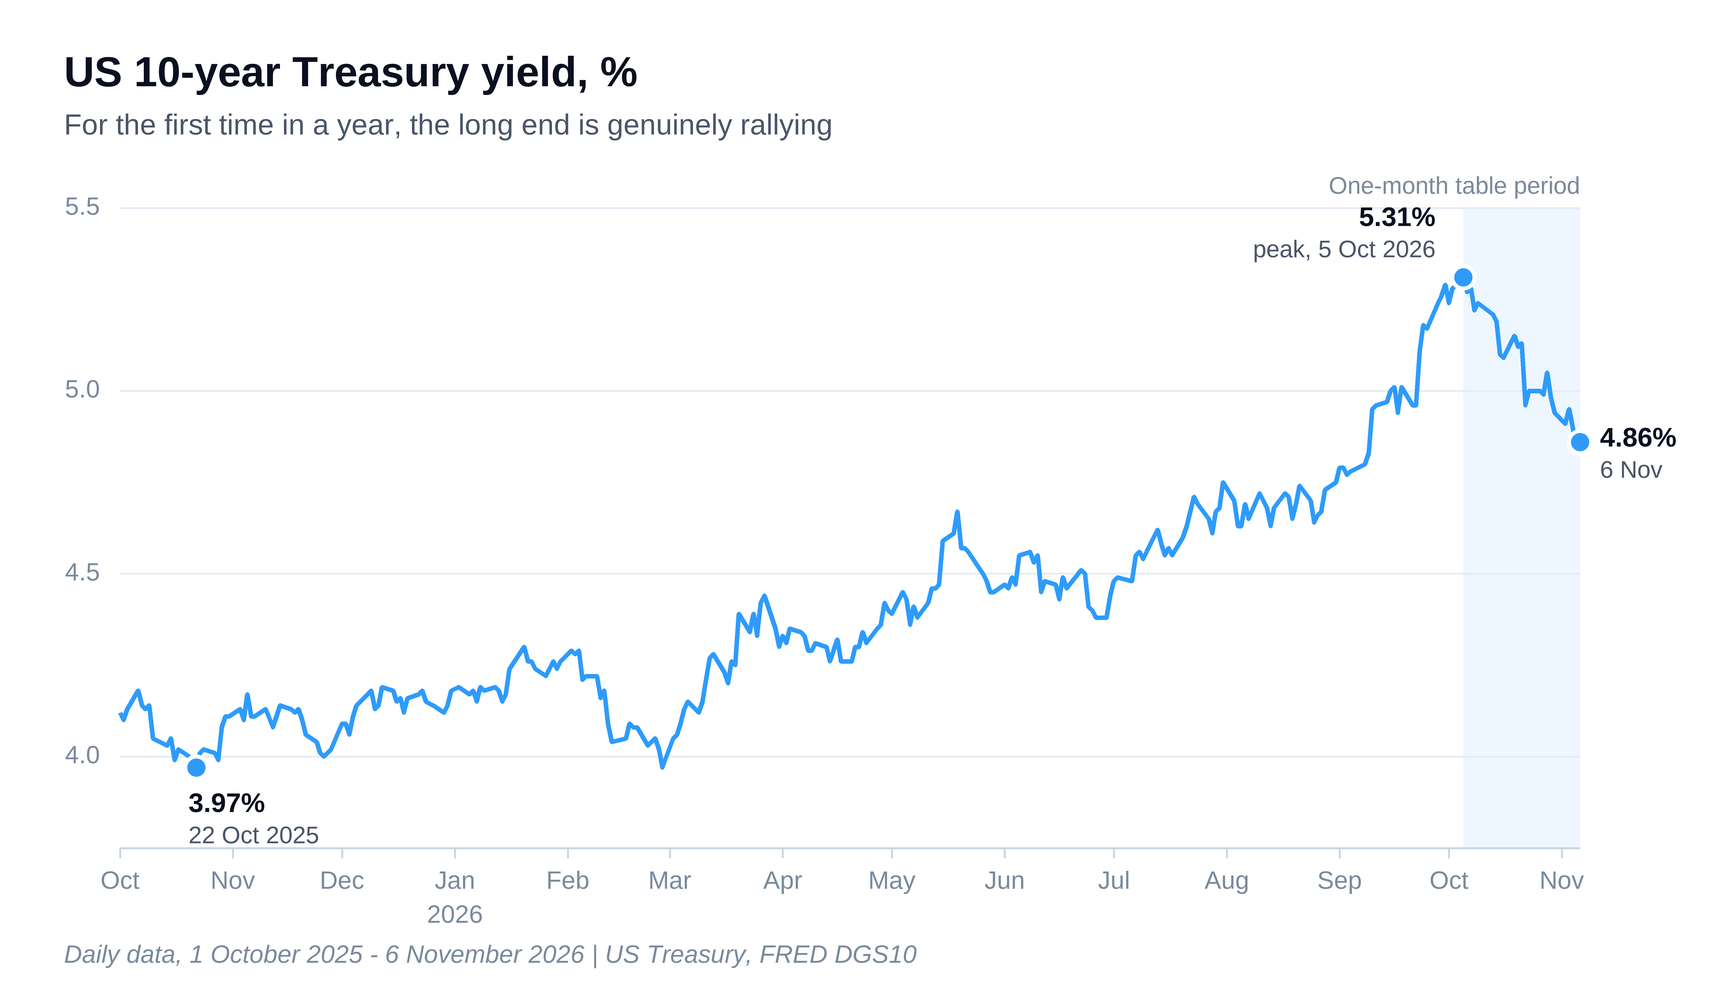
Central banks are not the reason. The Fed, the ECB and the Bank of Japan all held rates, and at all three a hike stayed on the table. The yield fell because the market started buying bonds. The dates show it. The largest one-day drop came on 22 October, 17 basis points, the day Meta’s shares lost 7% after its results. The next steps down coincide with Alphabet on 29 October and with the selloff on 5 November.
With liquidity that is not growing, the money for bonds has to come from somewhere. This month it came from selling shares. Part of the fall in yields is also a repricing: the market is starting to expect slower growth and lower rates ahead. Both point the same way. The bond with a clear maturity has buyers again.
Central banks wait
The Federal Reserve held its target range at 3.75-4.00% on 28 October, by a 10-2 vote. Lisa Cook and Beth Hammack wanted a 25 basis point hike. The effective rate is still 3.88%. The gap between the ten-year yield and that rate narrowed from 1.43 percentage points on 5 October to 0.98 on 6 November.
The European Central Bank held its deposit rate at 2.50% on 29 October. According to Christine Lagarde, the Governing Council discussed a hike but decided to wait. In an interview on 7 November she said euro area inflation was 4% in October, with energy at 20.8%, and that a December hike remains the baseline. The ten-year German Bund nevertheless fell to 3.29% on 6 November, from 3.53% on 9 October.
The Bank of Japan held its rate at 1.25% on 30 October, by an 8-1 vote. Hajime Takata proposed 1.50%. The bank also decided that from January 2027 it will speed up sales of the ETFs in its portfolio, from about ¥330 billion to about ¥860 billion a year. Thirty-year Japanese government bonds yielded 3.915% on 5 November on the Ministry of Finance curve, against 4.085% on 9 October.
All three banks threaten to hike, and bonds are rallying in all three regions. Either the market does not believe the threat, or it fears something else more. The next test is packed into ten days: the Fed on 8 and 9 December, the ECB on 17 December and the Bank of Japan on 18 December.
The dollar stands still
The Federal Reserve’s Broad Dollar Index stood at 121.6656 on 30 October, the latest available date, against 121.3848 on 2 October. That is a rise of just 0.23%. Last month its 2.80% gain was the main pressure on emerging markets. Now it explains almost nothing. Emerging markets are splitting along a different line: those where artificial intelligence or political risk is concentrated fall, the rest do not (see Asia and Latin America).
Risk appetite
The VIX measures the cost of protection against short-term moves in the US stock market. Below 20 means calm, above 20 elevated nervousness and above 30 active fear. On 5 November the index closed at 28.18, against 16.61 a day earlier. On 6 November it was 25.64. It was above 20 on only four days, 2, 3, 5 and 6 November, and never crossed 30, not even intraday.
A market in which technology loses 18% in a month while the VIX stays below 30 is not in panic. It is repricing. Panic sells everything. This month the market sold selectively and bought bonds, health care and food.
Oil
Physical Brent, as reported by the EIA, fell to $107.03 on 3 November from $125.44 on 6 October. US WTI moved the other way, to $99.64 from $96.24. The gap between the two grades narrowed from about $29 to about $7. The premium on the physical barrel, which last month we described as a fuel shortage, is melting away. Cheaper oil is a tax that disappears for everyone who imports it. That explains one of the few winners in Asia.
The bond with no maturity
Two promises
A government bond is the simplest promise in the market. It says how much it will pay and when. Duration measures how far in the future the money an investment will return lies. The further away it is, the more sensitive the price is to two things: what money costs today and how much we trust that the promised money will arrive at all.
Investing in artificial intelligence is almost pure duration. Companies spend enormous sums today on data centres and chips, and nobody can say when that spending will pay off. It is a bond with no maturity: it promises a high return but does not say when.
In October such a promise looked like a good deal. The government bond was losing money while its yield climbed towards 5.3%. The only thing that could beat it was earnings growth faster than that yield. The market paid for technology because it had nothing else to compare it with.
In November the two promises went in different directions. The bond with a maturity gained. The bond with no maturity got four reasons to ask whether its payout lies further away than we thought. When the safe promise pays again, the uncertain one has to offer a higher premium to be held.
Four tests of confidence
The first test was earnings. On 22 October Meta reported, and its shares lost 7% in a day. On 29 October Alphabet lost 12.6% after disappointing revenue. According to our November liquidity analysis, Held Breath, doubts about whether the huge spending on artificial intelligence will pay off returned with exactly these two reports. The market stopped asking whether the technology works and started asking when someone will pay the bill.
The second test was debt. CoreWeave rents out computing power for artificial intelligence and finances it mainly with loans. Its shares lost 43% between 1 October and 2 November and 51% by 5 November, their lowest level since April 2025. According to financial media, the credit market already treats its debt as distressed. This is where doubt about the timing of earnings becomes doubt about credit: if revenue arrives late, who services the loans?
The third test was politics. On 4 November the market greeted the midterm results, in which Democrats won both chambers of Congress, with a rally. The next day the rally reversed. According to Yahoo Finance and CNN, investors fear the new Congress will make it harder to build data centres. The Nasdaq 100 lost 6.36% on 5 November and the semiconductor index 12%. XLK lost 8.00% and SPY 4.41%. Political risk does not cancel the promise, but it can push its maturity further out.
The fourth test was borrowed money. According to Goldman Sachs estimates, hedge funds that invest mainly in technology shares lost more than 4% on 5 November alone and are now flat for the year, after a peak gain of 24% in June. Some large funds are cutting leverage and staff. According to Bloomberg, wealthy clients in Hong Kong and Taiwan are receiving margin calls, demands for additional collateral on positions bought with borrowed money.
Forced selling: the accelerator
When a loss hits a position bought with borrowed money, the lender asks for more collateral, and the fastest way to raise it is to sell the most liquid thing you own. In a forced sale nobody chooses by quality, only by what can be sold immediately. Nomura describes the move as selling the leaders, the largest and most profitable companies, and analysts quoted by Bloomberg call it forced deleveraging, not a reassessment of the long-term prospects of artificial intelligence.
The two explanations do not contradict each other. Forced selling explains the speed of the fall on 5 and 6 November. It does not explain why bonds have been rallying since early October, or why the market is buying short duration in particular. The mechanics are the accelerator. The cause is that the comparison between the two bonds flipped.
United States: the long promise against visible earnings
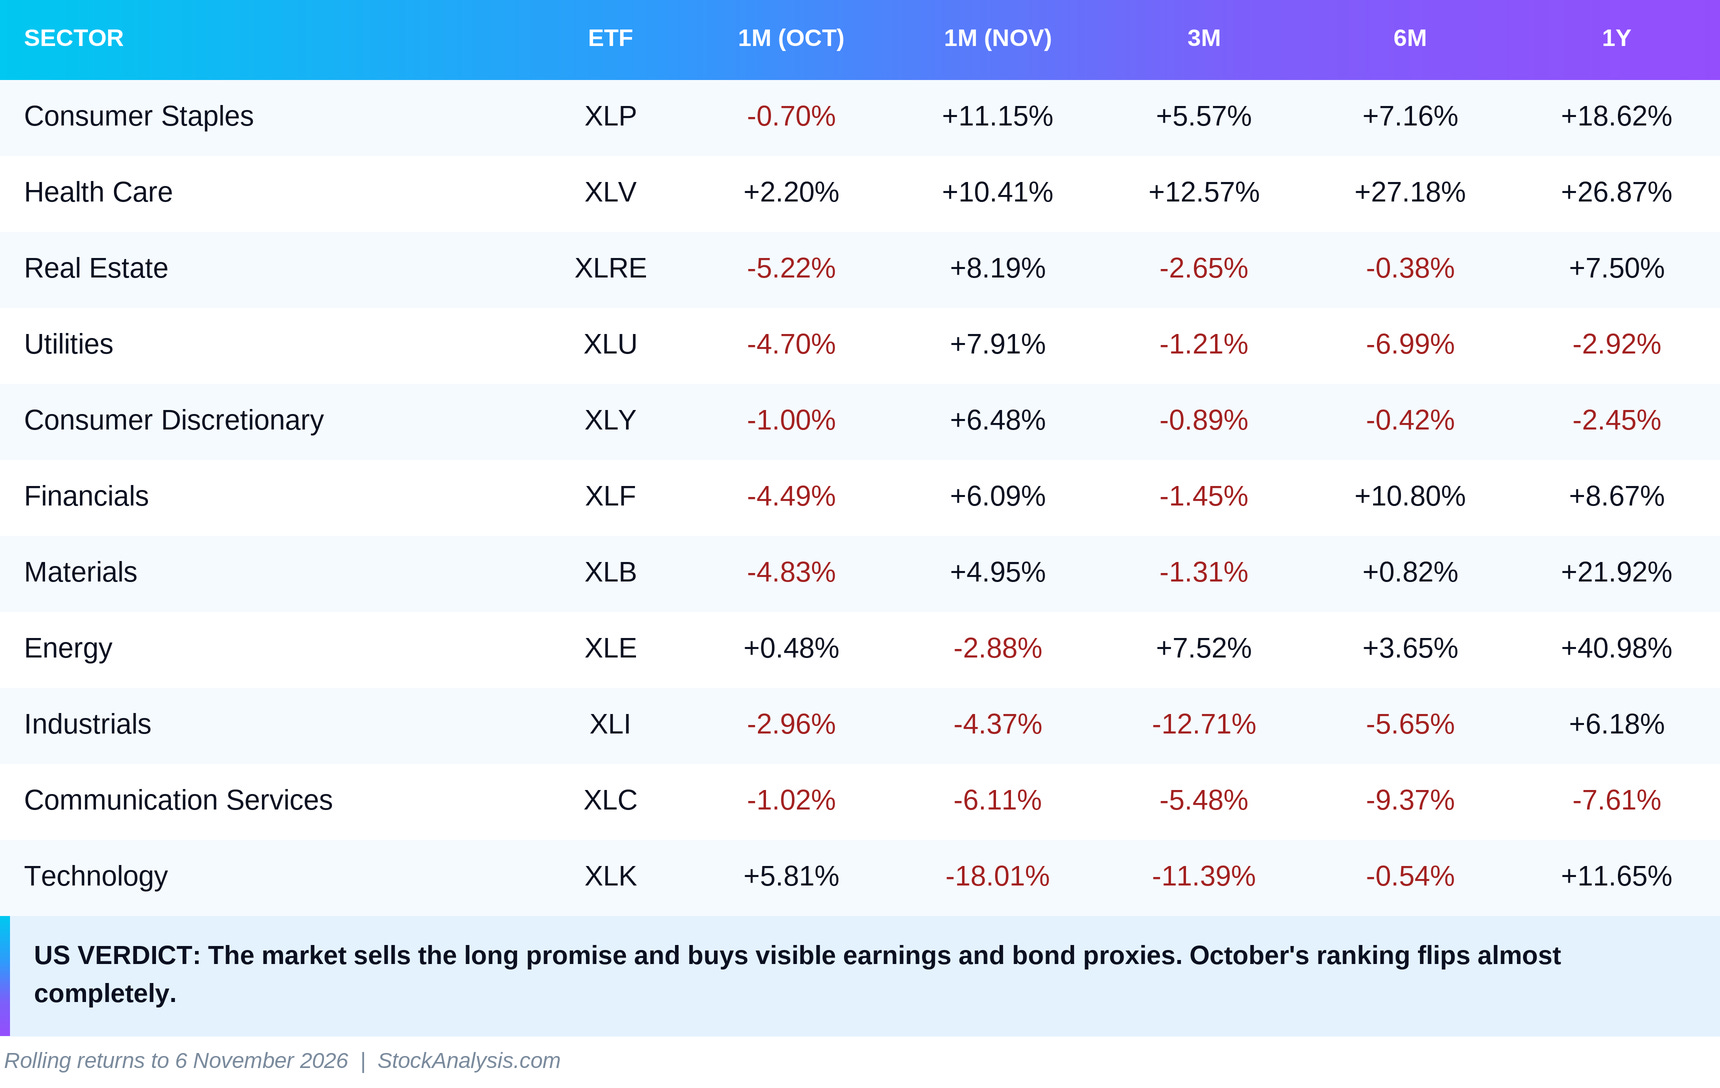
Technology is the longest bond in the table. XLK lost 18.01% in the month, after a 5.81% gain in October. Its six-month return is now minus 0.54%: in one month the sector gave back everything it had gained since May. The one-year return is still plus 11.65%, so this is a large correction, not erased history. Communication services lost 6.11%. This is where Alphabet and Meta sit, the two companies with which the tests began. Industrials lost 4.37%, and 12.71% over three months.
The leaders are short duration. Consumer staples gained 11.15%, after minus 0.70% in October. Health care added 10.41% and is now up 27.18% over six months, the strongest sector in the table over half a year. These are companies whose earnings are visible today and depend neither on artificial intelligence nor on the economic cycle. That was the thesis of The Silver Wave, our July sector analysis: an ageing population guarantees demand, and XLV’s low beta of 0.57 makes it a defensive position. November is the first month in which that defence was tested under real stress, and it held.
Real estate gained 8.19% and utilities 7.91%. Last month they were among the weakest sectors because the ten-year yield was above 5%. Bond proxies, shares valued like bonds, gain directly when real bonds rally. The same mechanism that punishes them when yields rise rewards them when yields fall.
Financials swung from minus 4.49% to plus 6.09%. They too are short duration: their earnings come today, from interest on loans already made. Last month the market sold them because of their borrowers, as credit was getting more expensive for everyone. Now that fear is easing. The surprise is XLY, up 6.48%, even though Tesla, one of its heaviest components, lost more than 9% on 5 November.
Energy lost 2.88% while physical Brent fell 14.7%. XLE is still up 40.98% over a year and keeps what it has gained, but it is no longer among the leaders.
RRG: the slower signal
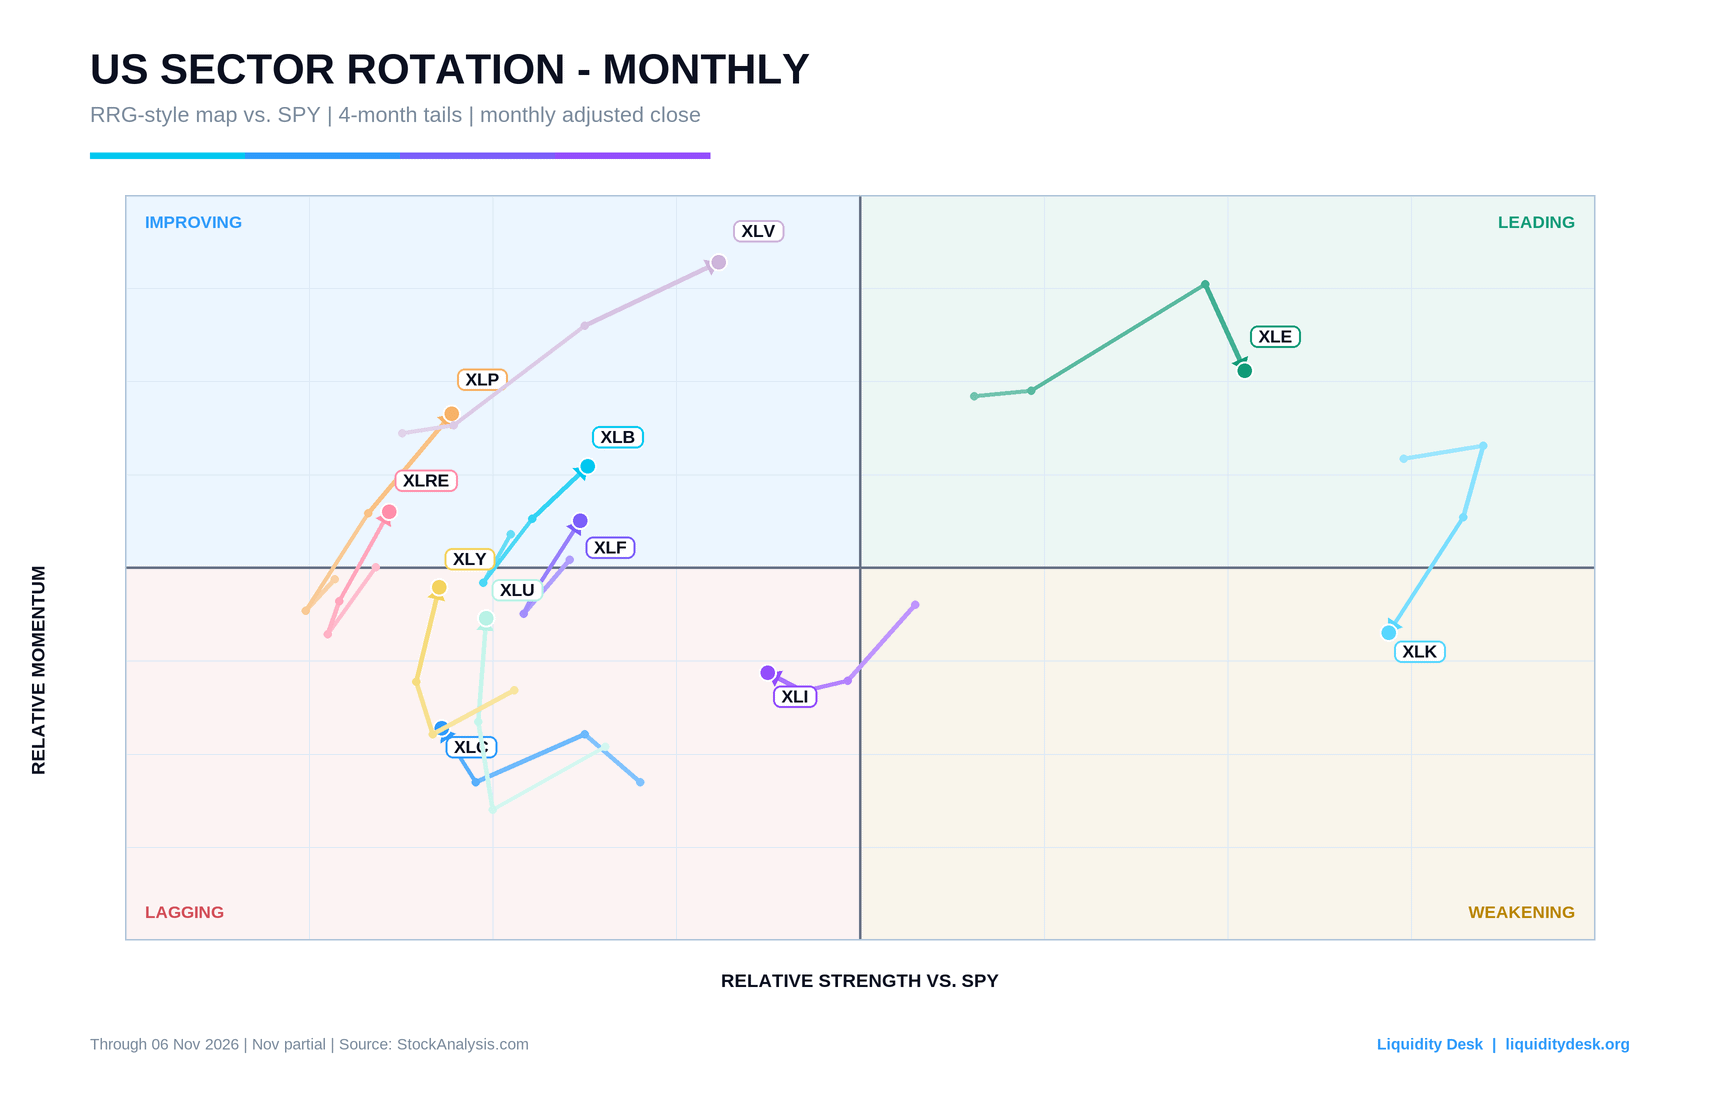
The horizontal axis shows relative strength against SPY, while the vertical axis shows the change in that strength. The upper-right Leading quadrant combines strength with positive momentum. The lower-right Weakening quadrant means a sector remains strong but is losing speed. The upper-left Improving quadrant shows recovery from a weak base, while the lower-left Lagging quadrant combines a weak position with weak momentum.
The map shows how much more slowly the smoothed trend moves. XLK drops from Leading into Weakening but stays furthest to the right, with the highest relative strength of all sectors. The monthly crash took away speed, not position. XLE stays in Leading, although it is now moving down.
The upper-left quadrant is filling up. XLV, XLP and XLB were already in Improving with the full October, and now XLF and XLRE join them. All five are moving up and to the right. XLV is closest to the border with Leading. If the direction holds for another month, health care will become the map’s new leader. XLC, XLI, XLU and XLY stay in Lagging. All quadrants are the same at 8, 10 and 12 months.
The RRG does not measure actual money flows. It shows relative performance and the change in that performance. It is a transparent RRG-style approximation built from the final adjusted price in each month, not the official proprietary JdK model. The last point is the incomplete November observation through 6 November 2026. One revision: on 9 October XLP and XLB were in Lagging; with the full October both are in Improving. That is an effect of the completed data, not a move in November.
Europe: the same direction, fewer long promises
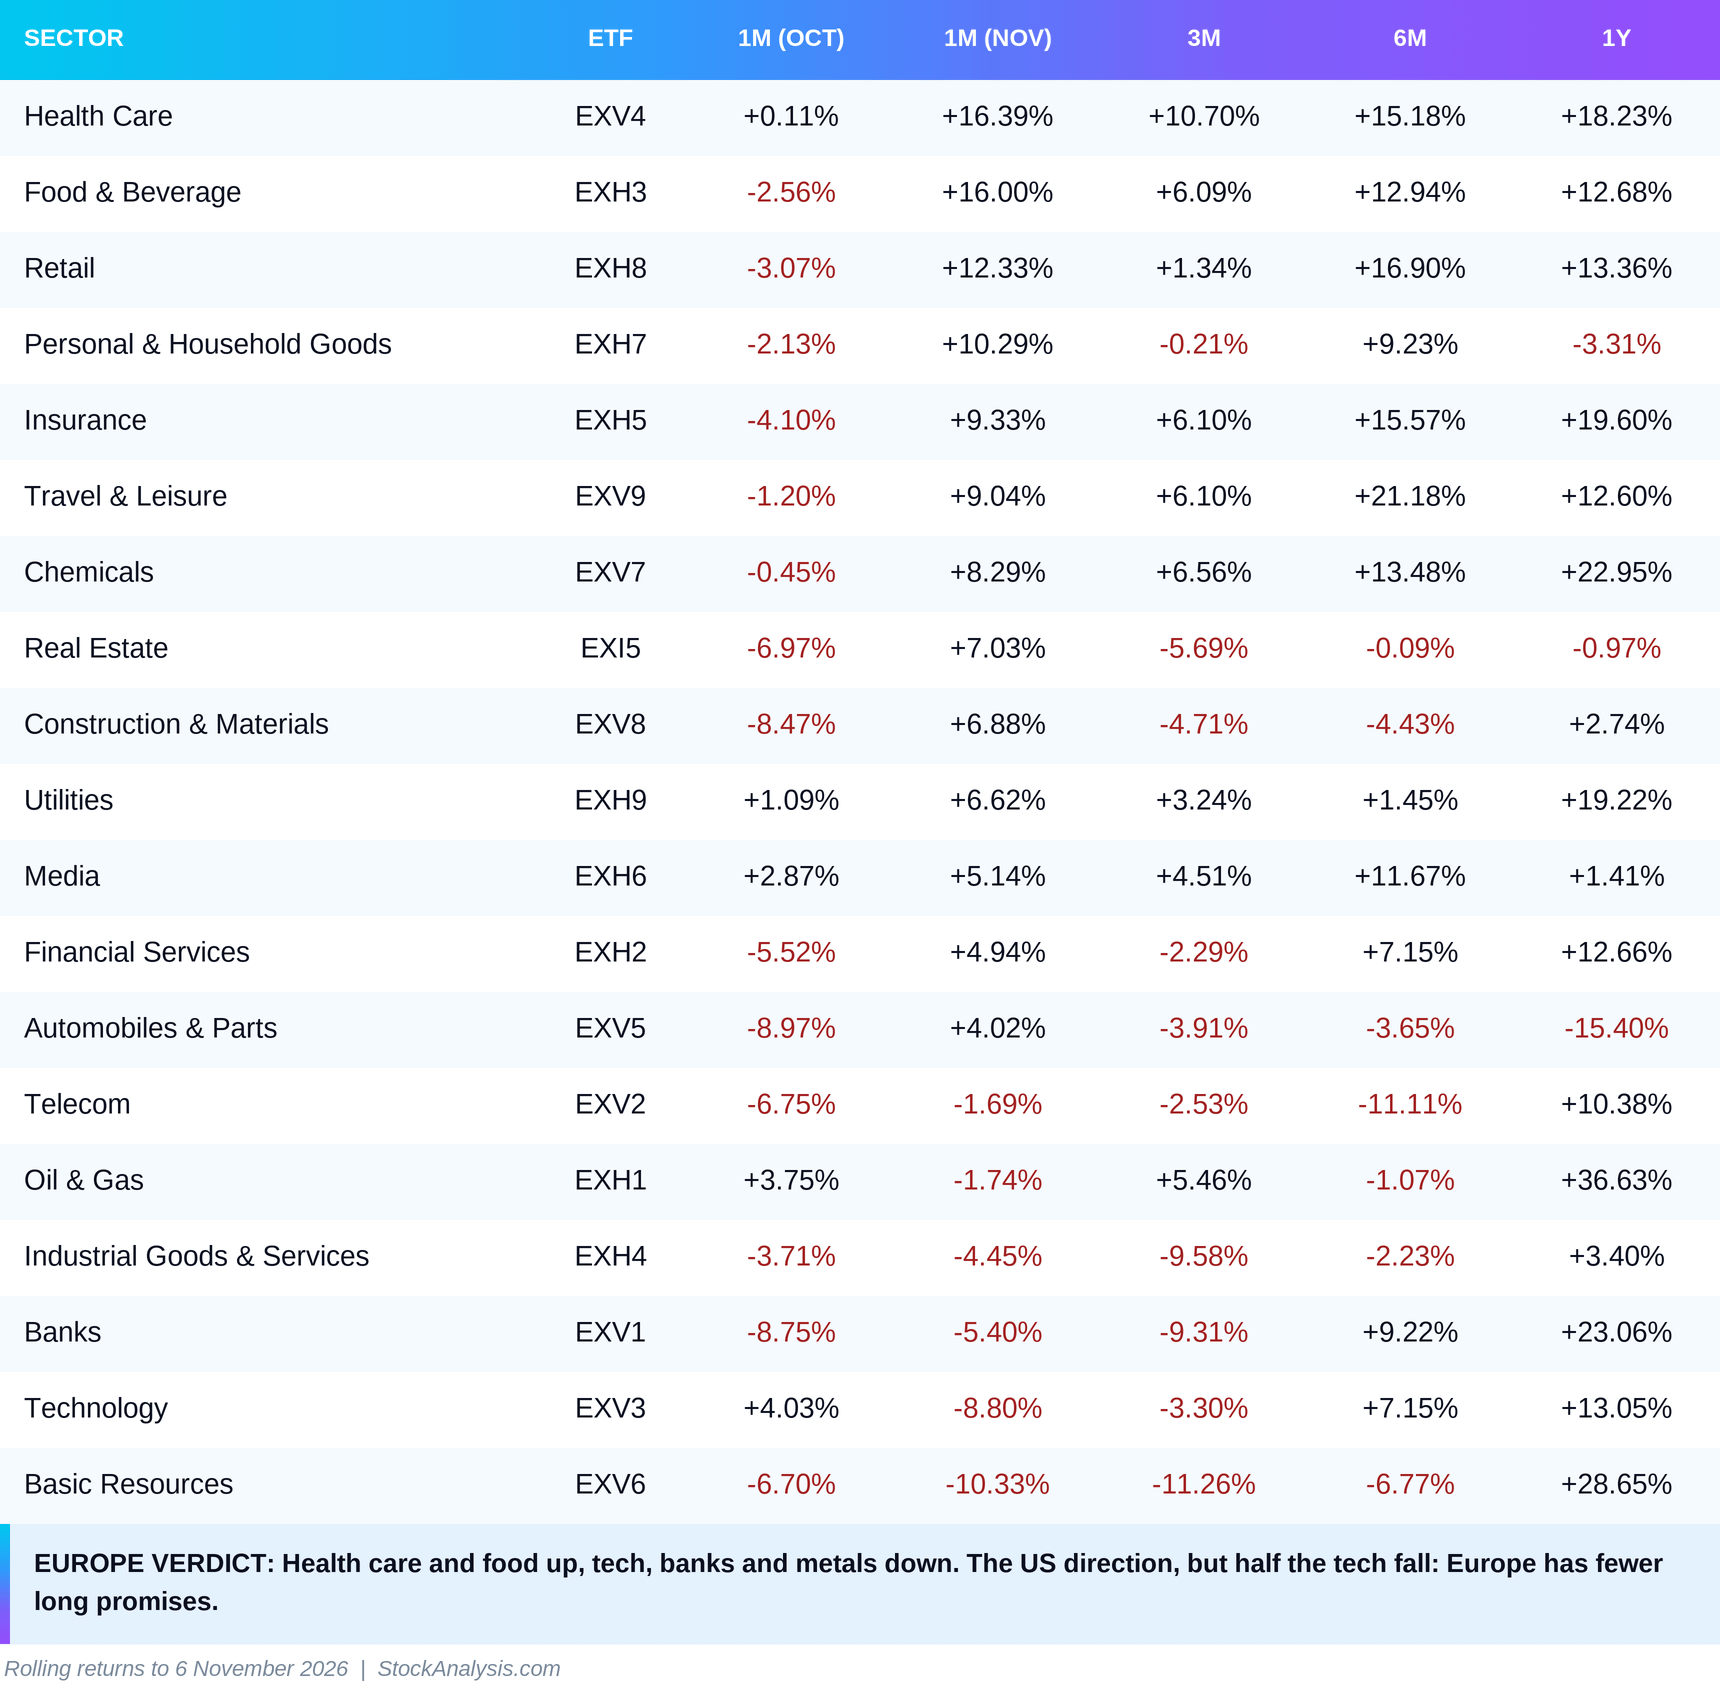
Europe repeats the US direction, but its technology falls less. EXV3 lost 8.80% after a 4.03% gain in October, while US technology lost 18.01%. At the core of the European fund are ASML, SAP and Infineon. ASML, which makes up about a tenth of the index, had already lost 11.52% in October. The European sector is exposed to artificial intelligence through chipmaking equipment, but it has no companies like Alphabet, Meta or CoreWeave that promise profits years from now and fund data centres with debt. Europe’s bond with no maturity is smaller.
Short duration gains more than in the United States. Health care gained 16.39% after practically nothing in October, and food and beverages 16.00%. Retail follows with 12.33% and personal and household goods with 10.29%.
Lower yields also lift the rate-sensitive sectors that were at the bottom last month. Real estate gained 7.03%, construction 6.88% and carmakers 4.02%. This is a rebound, not a reversal: all three are still negative over three months.
Banks are where Europe parts ways with the United States. EXV1 lost 5.40% after minus 8.75% in October, while US financials gained 6.09%. The three-month loss is 9.31%. In Europe the question is not the price of money but the quality of credit. According to the ECB bank lending survey, a net 9% of banks are tightening standards for companies, and net demand for mortgages is minus 27%. Lagarde points to a December hike as the baseline, which would make credit more expensive still. When banks themselves are tightening credit and demand for loans is falling, a lower long-term rate is not enough to restore confidence in them.
Basic resources are at the bottom with minus 10.33%, and minus 11.26% over three months. The sector depends on Chinese demand for metals, and China’s measures this month target the stock market, not industry. Oil and gas lost 1.74%, almost as much as US energy. Both follow the falling Brent price.
Asia: the longest bond is here
In Asia we use country funds rather than sector funds. Currencies, regulation and economic cycles are too different to be combined into one regional sector index.
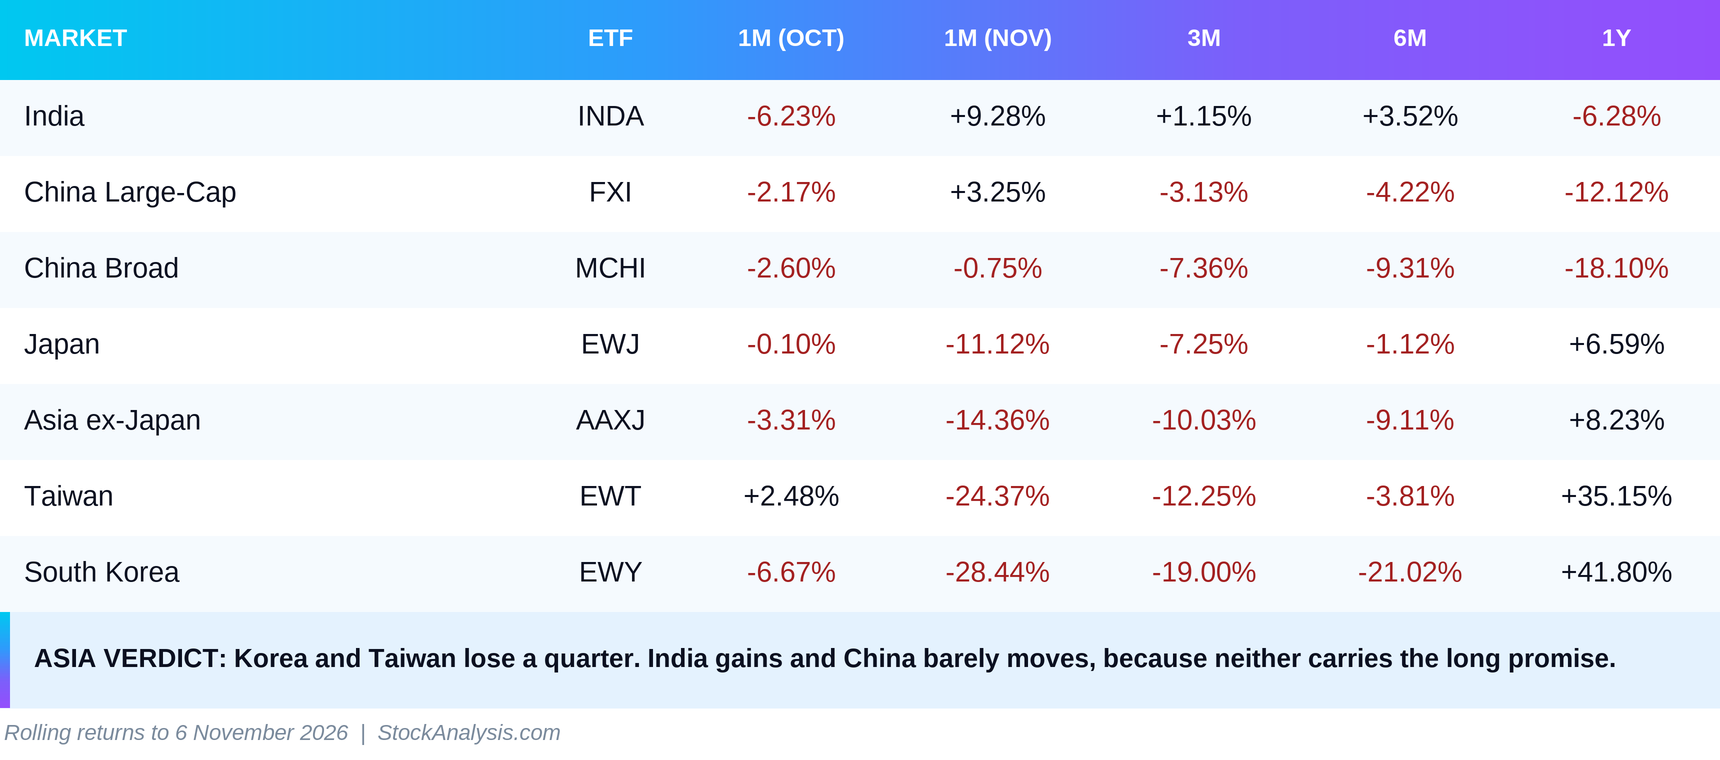
South Korea lost 28.44% in the month and Taiwan 24.37%. These are the two markets where artificial intelligence is most concentrated. More than 40% of EWY is SK Hynix and Samsung Electronics, and almost a quarter of EWT is TSMC, with much of its supply chain behind it. These two funds are the purest bet on the bond with no maturity on our entire map. The loss is mostly in the shares. KOSPI lost 16.19% in October. On 5 November it fell another 5%, with foreign investors net sellers of 3.39 trillion won in a single day. On 6 November the drop reached 8.8% and trading was briefly halted. The won weakened by only about 2% in the first week of November, from 1,334 to about 1,364 per dollar.
One-year returns remain high, 41.80% for Korea and 35.15% for Taiwan. The more concentrated a market is in one theme, the faster it unwinds when the theme is sold. That does not necessarily mean the theme is over. It means that is where the maturity of the promise weighs most.
Japan lost 11.12% in the month, after being practically flat in our previous issue. The Nikkei 225 fell 5.19% in calendar October and another 9.25% in the first week of November. The Japanese market is falling together with Asia’s technology names. The yen, however, did not strengthen even on the worst days. It ended the week at 158.43 per dollar, slightly weaker than it began, so there is no sign the carry trade is unwinding. The carry trade means borrowing cheaply in yen and investing the money in higher-yielding assets elsewhere. The Bank of Japan adds future pressure as well, since from January it will sell ETFs almost three times faster.
China barely took part in the selloff. FXI gained 3.25% and MCHI lost 0.75%. Between 2 and 4 November the People’s Bank of China took two steps for the stock market. Refinancing for share buybacks becomes permanent and its rate falls to 1%. It also launched a swap facility for brokers, funds and insurers. Separately, it raised reserve requirements on foreign currency deposits from 4% to 6%, which slows the yuan’s appreciation. Chinese shares were not part of the theme in October, so they have nothing to unwind now.
India is the strongest market in the region with 9.28%, after minus 6.23% in October. Last month we wrote that a strong dollar hits oil importers hardest. This month the mechanism works in reverse. Physical Brent fell 14.7% and the rupee strengthened from 96.78 to 94.94 per dollar. India has almost no companies in the artificial intelligence supply chain, so it has no long promise to reprice.
Latin America: politics instead of the dollar
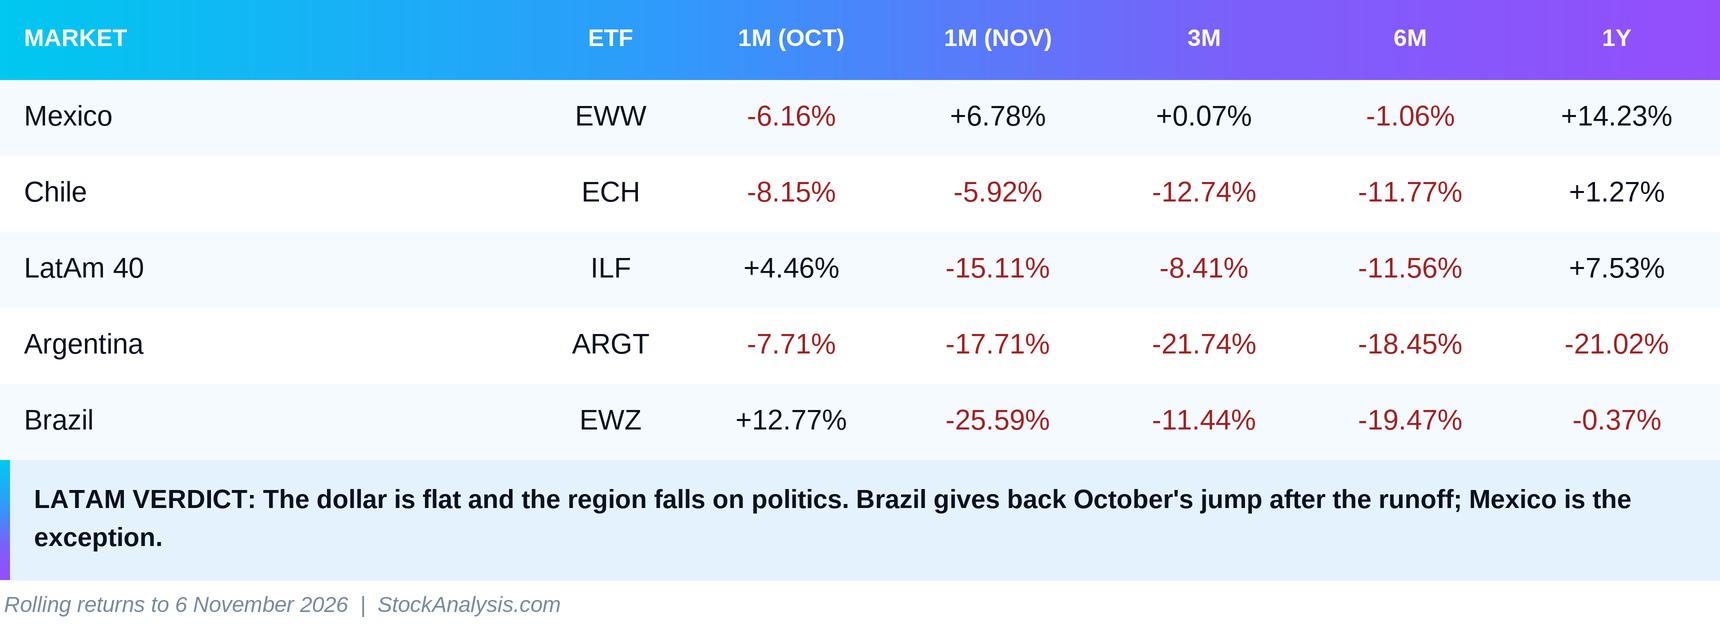
The dollar is usually the main variable for the region. A stronger dollar makes the commodities the region exports cheaper and makes its dollar debt more expensive to service. This month, however, the broad dollar stood still while the region lost 15.11%. The explanation is political.
Brazil lost 25.59% after a 12.77% gain in October. Last month we wrote that the market was pricing a possible change of course before the runoff, and that if the runoff reversed the result, the gain could disappear just as quickly. That is exactly what happened. According to official results from the Superior Electoral Court (TSE), Lula won the 25 October runoff with 51.79% of valid votes, against 48.21% for Flávio Bolsonaro. The next day the dollar rose 9.19% against the real, from 5.0377 to 5.5007 reais. On 6 November the rate was 5.5013, against 4.9892 on 9 October. The Selic policy rate remains 13.75%. A market that has paid in advance for one election result loses twice when the other one comes: once in the shares and again in the currency. EWZ is priced in dollars, so the weaker real deepens its loss.
The regional ILF lost 15.11%, mainly because of Brazil’s weight in it.
Argentina lost 17.71%, its second losing month in a row. It is down 21.74% over three months and 21.02% over a year. According to financial media, the Brazilian result was one of the reasons for the fall in Argentine shares at the end of October, and country risk reached 787 basis points on 30 October, the highest close of 2026. These figures do not come from a primary source.
Mexico is the exception, up 6.78% after minus 6.16% in October. The peso even weakened, from 17.96 per dollar on 6 October to 18.79 on 30 October, so local shares rose even more than the dollar fund shows. The gain came before the central bank’s decision. On 5 November the Banco de México unexpectedly cut its rate by 25 basis points to 6.25%. A surprise decision cannot have attracted capital in advance, but it confirms the direction: when the large central banks threaten hikes and the local one cuts, that market’s bond with a maturity gains. US tariffs on Mexico did not change after the elections. Chile lost 5.92% and is down 12.74% over three months. The fund remains an indirect bet on Chinese industrial demand through copper, in the same direction as European basic resources.
The regime: liquidity that is not growing
Central banks tighten, China is the exception
November’s rotation did not come out of nowhere. Our latest Global Liquidity Snapshot and Credit Pulse issues show how the strain has been building, and this month is the first in which the stock market paid for it.
In September the ECB, the Fed and the Bank of Japan raised rates within eight days. In October all three held, but at all three a hike stayed on the table. The Fed is not draining money from its balance sheet, but it is tightening through price: the rate is higher than in the summer, and two members already want another hike. Quantities are flat or draining. Net Fed Liquidity is $17.6 billion smaller for October, and the Treasury’s account of more than $1 trillion is pulling reserves out of the banks. Euro area excess liquidity shrank for a second month in a row, by about €33 billion each time. Japan’s monetary base is 13.6% smaller than a year earlier. Only the People’s Bank of China is adding money, and there it does not reach households. Liquidity is not contracting sharply. It has stopped growing, and its price has gone up.
Water flows from shares into bonds
When liquidity stands still, the market gets no new money. It can only move what it has: from one sector to another and from shares into bonds. November shows both. The first flow is outward. SPY lost 5.10% in the month while bond yields fell. Part of the money is leaving shares. The second flow is inside. The gap between the best and the worst US sector, XLP and XLK, is 29.2 percentage points, against 11.0 in October. The ranking flipped almost completely in a single month. Technology went from first place to last, consumer staples from the upper half to first. Brazil went from the strongest market in Latin America to the weakest. With liquidity standing still, every new position, in bonds or in short duration, is funded by selling a long promise.
One caveat. Credit Pulse notes that, on a comparable basis, net liquidity is slightly higher than in July. Liquidity is not falling dramatically. It is standing still while its price and conditions tighten. That is a narrower but more accurate version of the same thesis.
The rotation signal
The market has not given up on artificial intelligence. It has started to ask when it will be paid.
For the first time in a year the bond with a maturity is gaining again, and the VIX has not crossed 30. This is not a panic in which everything is sold. It is a repricing: the market compares the two bonds and asks for a higher premium on the one that does not say when it will pay.
The first theme is the repricing of long duration. XLK lost 18.01%, Korea 28.44%, Taiwan 24.37% and European technology 8.80%. The theme that led in October is at the bottom in every region at once. The four tests, earnings, debt, politics and borrowed money, all hit the same thing: the maturity of the promise. Forced selling only accelerated the fall. When a position is both the most profitable and the most distant, it is the first to be sold once the safe alternative starts paying again.
The second theme is the return of bonds and visible earnings. The US ten-year yield is down 45 basis points from its 5 October peak, and the Bund 24 from 9 October. Consumer staples, health care, real estate and utilities lead in the United States. Health care and food lead in Europe. Last month the rate-sensitive sectors paid for a yield above 5%. Now they are getting part of the loss back. On the RRG map the upper-left quadrant is filling with sectors whose earnings are visible today.
The third theme is politics instead of the dollar. The broad dollar moved 0.23%, while the largest move in Latin America was political: the Brazilian runoff and, according to media reports, its spillover into Argentina. In the United States the elections were one of the four tests for artificial intelligence. Last month the dollar regulated emerging markets. This month elections and the maturity of promises do.
The quiet signal is India. Last month it was among the weakest markets because it imports oil and pays in dollars. Now it is the strongest in Asia with 9.28%. The reason is simple: oil is getting cheaper, and India has almost nothing in artificial intelligence to reprice. When the market reprices long promises, the winner is the one who never made any.
The strongest argument against this picture is that the repricing may be temporary. Analysts quoted by Bloomberg describe the move as forced, not as a change in conviction about artificial intelligence. One-year returns for Korea, Taiwan and XLK remain positive, and the RRG map still shows technology as the sector with the highest relative strength. If forced selling ends, the rebound could be as fast as the fall. On 6 November the Nasdaq 100 was already up 1.35%.
The answer will come from two places. First, from the promise itself: CoreWeave reports results on 10 November and will show whether doubts about its debt spread to the large technology companies. Second, from the bond with a maturity: the central banks meet between 8 and 18 December. If all three raise rates, November’s lower yields will not hold, the safe bond will lose value again and the bond with no maturity will get a reprieve. Then we will know whether the market has repriced the maturity of artificial intelligence, or simply found a temporary alternative.
Data and sources
ETF performance: StockAnalysis, rolling returns to the close of 6 November 2026, as displayed by the source. EWY and EWT holdings as of 5 November 2026: StockAnalysis, EWY, StockAnalysis, EWT.
US ten-year yield: US Treasury, Daily Treasury Par Yield Curve Rates and FRED DGS10 for the history since 2024.
FOMC decision of 28 October 2026: Federal Reserve. Calendar: FOMC calendar.
Federal Reserve effective rate: FRED DFF.
Broad Dollar Index: FRED DTWEXBGS.
Won, rupee and peso exchange rates: FRED DEXKOUS, DEXINUS, DEXMXUS. Won on 5 and 6 November: Trading Economics.
Yen: Bank of Japan, USD/JPY at 17:00 Tokyo; Reuters, Dollar holds, yen gains as equity rout saps risk appetite, 6 November 2026.
VIX: Cboe, VIX History.
Nikkei 225: FRED NIKKEI225.
Nasdaq 100 and Meta, Alphabet and CoreWeave shares: Nasdaq, historical data.
CoreWeave third-quarter results date: CoreWeave Investor Relations.
Brent and WTI spot, EIA: FRED DCOILBRENTEU and FRED DCOILWTICO.
ECB decision of 29 October 2026: European Central Bank. Press conference: ECB.
Christine Lagarde, interview with Yomiuri Shimbun, 7 November 2026: ECB.
ECB bank lending survey, 27 October 2026: ECB.
Ten-year German government bond yield: Deutsche Bundesbank.
Bank of Japan decision of 30 October 2026: BOJ. Monetary base, October 2026: BOJ.
Japanese government bond yields: Japan Ministry of Finance, Interest Rate. November auction calendar: MOF.
People’s Bank of China measures of 3-4 November 2026: buyback refinancing, FX deposit reserve requirement, swap facility for brokers, funds and insurers (SFISF).
Selic and USD/BRL: Banco Central do Brasil, SGS 432 and SGS 1.
Banco de México decision of 5 November 2026: Banxico, Anuncio de Política Monetaria.
Brazil presidential runoff of 25 October 2026: Tribunal Superior Eleitoral, official results.
Sector Deep Dive on health care, July 2026: The Silver Wave; XLV beta of 0.57 from that analysis.
Markets and liquidity quantities in October (KOSPI, CSI 300, ASML, Net Fed Liquidity, excess liquidity): Global Liquidity Snapshot, November 2026.
Media sources for 5 and 6 November: Yahoo Finance, 5 November 2026; CNN, 5 November 2026; Reuters, Tech selloff wipes out hedge fund gains, prompting risk cuts and layoffs, 6 November 2026, with the Goldman Sachs estimates; Bloomberg, via Hedgeweek, 6 November 2026.
CoreWeave and the credit market: CNBC, opinion by Paul Meeks, 2 November 2026.
South Korea: Herald Corporation, 5 November 2026.
Argentina: Rio Times, 27 October and 30 October 2026.
Monthly RRG-style methodology: Liquidity Desk calculations from the final adjusted price in each month for SPY and the 11 US sector ETFs.
Liquidity Desk | liquiditydesk.org
The bond market may be signalling a shift in leadership. A 45 bp fall in the 10-year yield alongside an 18% decline in technology stocks raises a question: is this a rotation, or a broader growth concern?