

America Has Oil. Cheap Diesel Is Gone.
America has not run out of crude oil. WTI is at $100.30 a barrel, refineries are operating close to their physical limit, and measured distillate demand is lower than it was a year ago. Yet the average highway diesel price reached $6.285 a gallon in the week of September 14. This is the first move above $6 and the highest nominal reading in the EIA weekly series since 1994. The cause is downstream of the refinery. Distillate inventories are 13% below their seasonal norm, Russian exports are restricted, Ukrainian strikes are reducing Russian refining capacity, Hormuz remains unreliable, and US plants have little spare room to produce more fuel. The shock has arrived at the worst possible moment. The corn and soybean harvests are just beginning, and diesel powers the combine, the truck, and the refrigerated trailer. The August PPI already showed a 24.1% monthly jump in diesel. The September record has not yet entered the official inflation data.
Crude oil is the commodity. Diesel is the bill.
Energy: the shock is now downstream of the refinery
The US economy does not run on crude oil. It runs on gasoline, diesel, jet fuel, heating fuel, and chemical feedstocks. The distinction sounds obvious, but in September it explains the entire market.
WTI ended September 18 at $100.30 a barrel and Brent at $103.87. Over one month, the two benchmarks are up 18.85% and 13.37%, respectively. This is a new return to triple digits after the summer decline that pushed WTI below $70 in early July.
Finished fuels, however, are moving even more aggressively over a 12-month horizon. RBOB Gasoline, the US wholesale gasoline futures benchmark, is at $3.5276 a gallon and has risen 79.24% over the past year. NYMEX HO, the New York Harbor Ultra-Low Sulfur Diesel contract, is at $5.0578 a gallon. That is a 120.01% annual increase. The contract retains its historical Heating Oil name, but the product traded today is low-sulfur ULSD.
This is the difference between an oil shock and a distillate shock. WTI is up 60.74% over one year. ULSD is up 120.01%. If crude alone were driving the price, the two moves would be much closer. The gap shows that the market is paying a separate premium to turn a barrel of crude into usable fuel.
The EIA confirms the physical strain. In the week through September 11, US refineries processed 17.3 million barrels a day while operating at 96.8% of capacity. Distillate production was 5.2 million barrels a day. Inventories rose by 1.6 million barrels over the week but remained 13% below their five-year seasonal average. Gasoline inventories were 5% below normal.
This is the central paradox. Four-week distillate consumption is 3.3% lower than a year earlier. The price is not rising because Americans suddenly use much more diesel. It is rising because even weaker demand has not been enough to rebuild inventories while the system is already operating close to its limit.
The global market is intensifying the pressure. The war with Iran continues to disrupt normal flows through Hormuz. Ukrainian strikes on Russian refineries have led to domestic restrictions and a Russian diesel export ban. The US does not import Russian diesel directly, but the connection runs through the global market. When Russia removes fuel from international trade, buyers seek replacement cargoes, including from US refiners. US net distillate exports have been near or above their five-year high since February, keeping domestic inventories low. The Russian shock reaches America not through imports, but by pulling American diesel into the international market. China is also restricting fuel exports. On September 10, the US diesel crack spread, the difference between the value of diesel and crude oil, reached a record $112.17 a barrel, according to LSEG data cited by Reuters.
Local disruptions now carry more weight because the buffer is small. ExxonMobil’s 275,000-barrel-a-day refinery in Joliet, Illinois, was shut after a power outage. It was still offline on September 17, and on September 18 ExxonMobil said that the restart of individual units was under way. Gasoline prices in Chicago rose after the initial outage, and analysts warned of broader pressure across the Midwest. Joliet did not cause the national diesel record, which was reached before the outage. The incident temporarily removed capacity for about 11 million gallons of gasoline and diesel a day when the buffer was already inadequate. It shows how sensitive the system has become to every additional problem.
The July US edition set three conditions for a new energy impulse: WTI above $90, ULSD above $4, and CRB above 500 points. All three have been met. Scenario A was our base case in July, and it did more than materialise. It moved from geopolitical risk to a measurable shortage of finished fuel.
The US commodity dashboard
Prices and changes from Trading Economics at the end of the final trading session on September 18, 2026. These are indicative market series. The EIA weekly diesel price and official macroeconomic data are discussed separately.
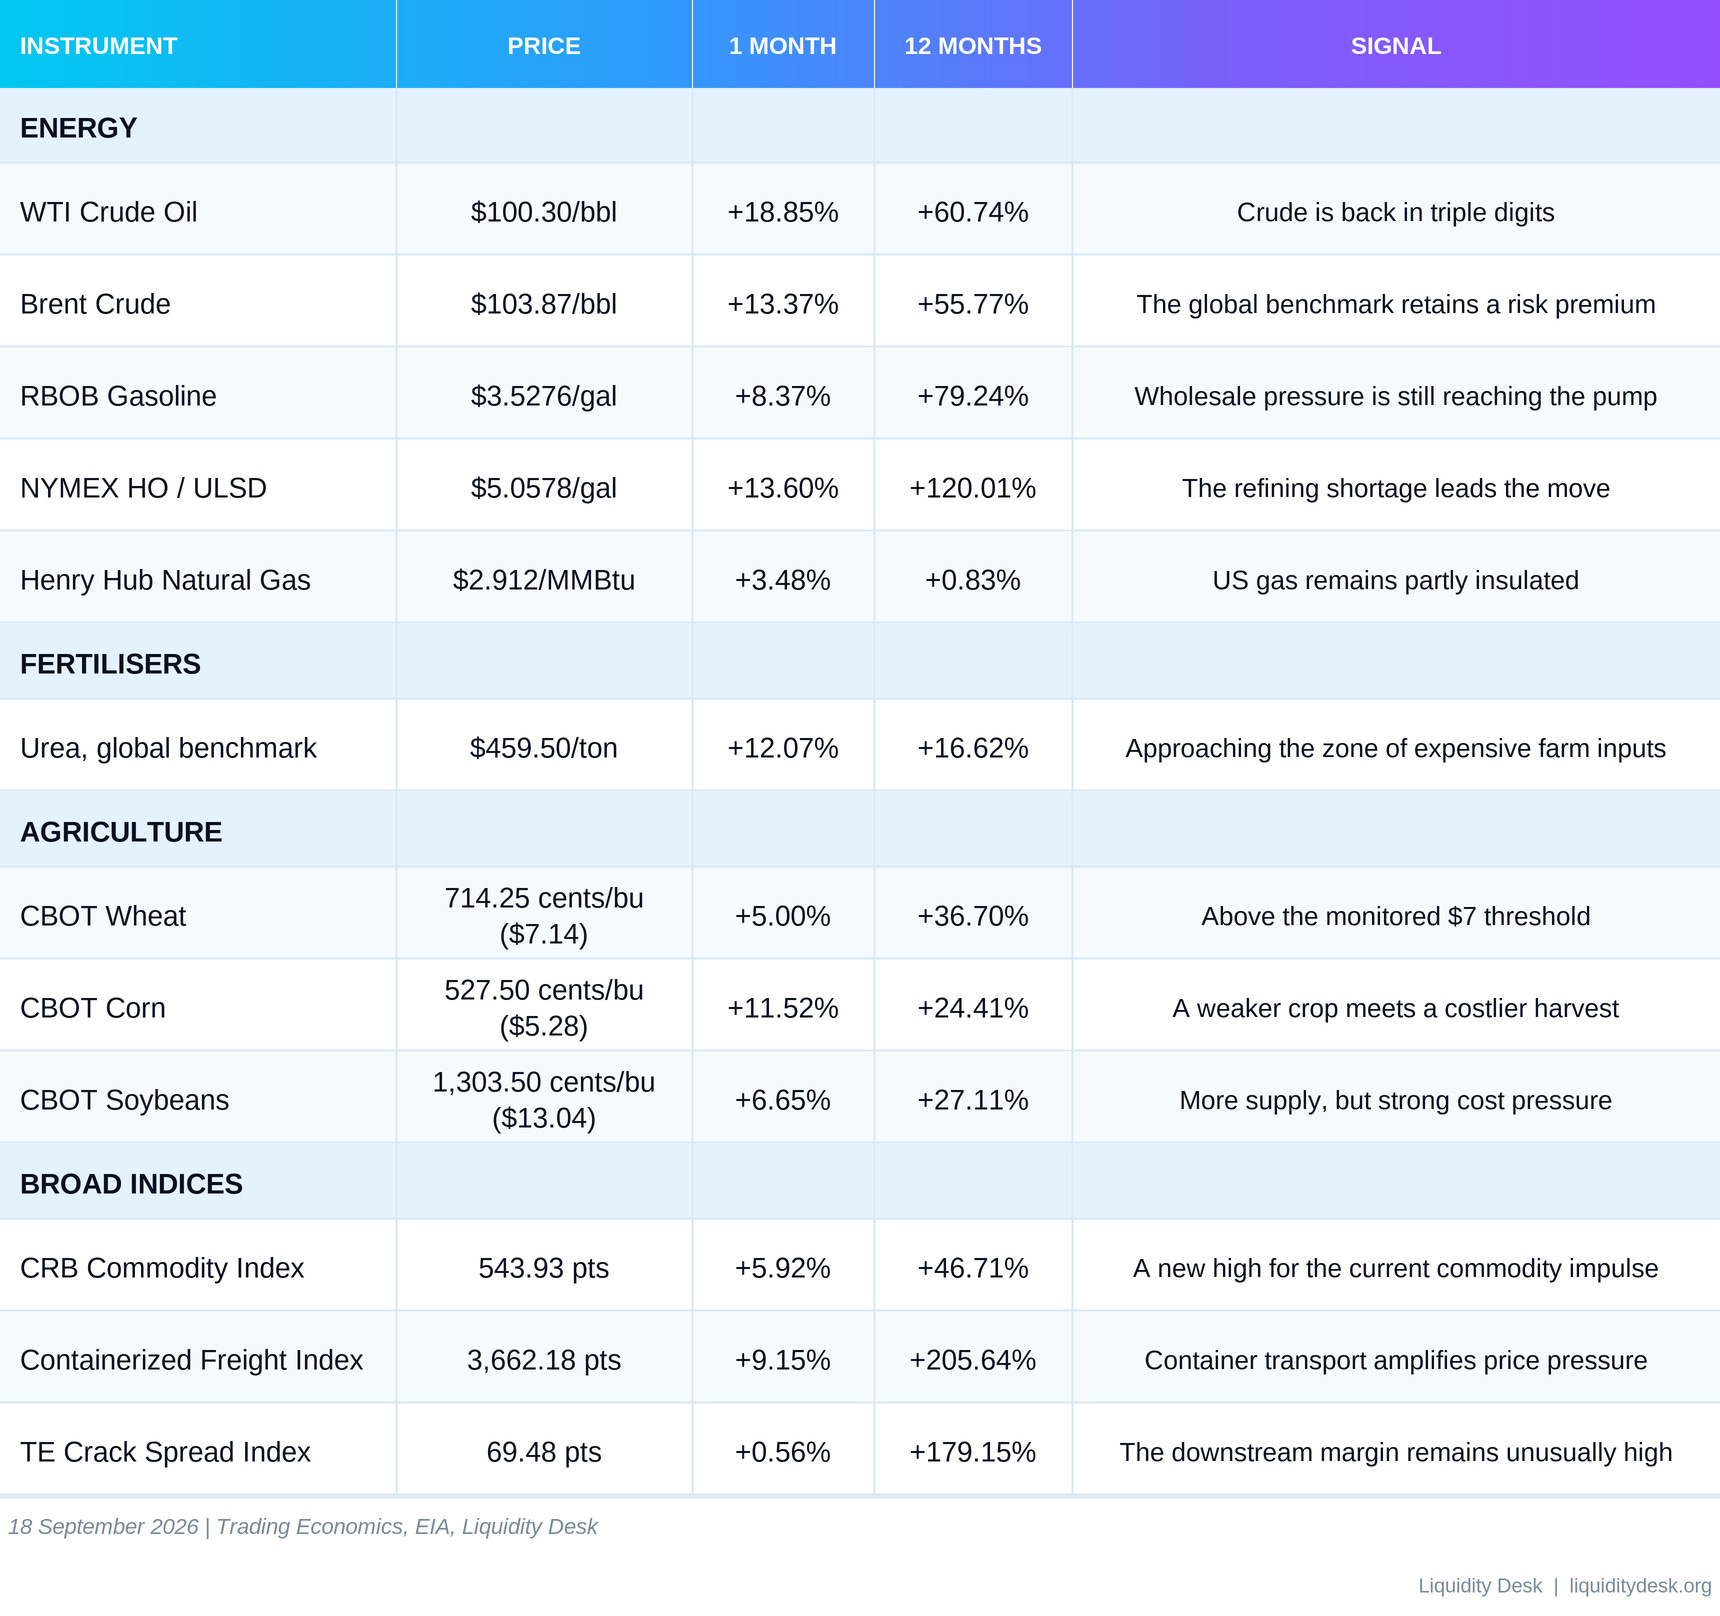
The dashboard shows not one rally but three connected strains. The first is crude oil above $100. The second is the shortage of finished fuels, with ULSD rising twice as fast as WTI over the past year. The third is agriculture, where corn, wheat, and soybeans are climbing just as the harvest begins to reach the market.
Not every commodity confirms the same inflation wave. Gold is down 2.97% over one month and silver 1.03%, while copper is up only 1.97%. Steel has gained 2.34%. This does not look like indiscriminate buying of every real asset. The move is concentrated in energy, refined products, transport, and parts of agriculture.
We show the Containerized Freight Index because it completes the diesel story. Diesel raises the cost of moving goods inside the US, while the container index captures pressure on the international transport of finished products. An imported product can therefore arrive at a US port at a higher cost and then face a more expensive truck journey inland. The index does not prove the diesel shock and it is not the Baltic Dry Index. The BDI tracks dry bulk cargoes such as grain, ore, and coal.
The transmission chain: from the barrel to the checkout
Crude oil to the pump
US drivers are already seeing part of the new move, but not the full September increase. RBOB at $3.5276 is a wholesale price. The pump price includes the crude feedstock, refining, blending, taxes, distribution, and the retail margin. Pass-through comes with a lag and does not follow the futures contract one for one.
The EIA weekly average for all grades of gasoline reached $4.455 a gallon in the week of September 14. The politically sensitive $4 threshold has already been crossed. That hurts households, but diesel remains the more important macroeconomic channel. A driver can postpone a trip. A combine cannot postpone ripe corn, and a refrigerated truck cannot leave milk in a parking lot.
ULSD to transport and producer prices
Diesel is a cost embedded in every stage of the physical economy. It powers trucks, locomotives, construction equipment, part of shipping, and backup generators. When its price doubles in one year, the effect does not remain inside the energy category.
The BLS can already see the first wave. In August, the producer price for diesel fuel jumped 24.1% in one month. Headline PPI rose 0.4% over the month and 5.4% over the year. Final-demand goods energy increased 4.2%, transportation and warehousing 2.3%, and truck transportation 2.0%.
That was before the EIA reported $6.285 a gallon. The August data contain the beginning of the move, not the September peak. If wholesale ULSD remains around $5, the September and October PPI reports will carry a stronger diesel imprint.
Pass-through to the end consumer does not occur at one speed. Large carriers use fuel surcharges and can update contracts relatively quickly. Some retailers absorb the cost temporarily. Others change prices immediately. Perishable food is most exposed because it moves frequently and in refrigerated trailers.
Diesel and urea to the harvest
In the spring, the main agricultural question was how much nitrogen would go into the soil. In the autumn, it is how much diesel the machine will burn to take the crop out of the field and deliver it to the silo.
Urea has returned to $459.50 a ton, up 12.07% over one month. It remains below the $480 to $500 zone that we monitor, but it is already close enough to bring the input-cost risk back into the next season. Henry Hub remains cheap relative to global gas markets, but urea is an internationally traded product and the US farmer does not automatically receive the full benefit of cheap domestic gas.
Diesel is the more immediate problem. Reuters describes one farm where a single combine uses about 300 gallons, and another producer who expects to spend as much as $1,500 a day to run just one machine. Calculations by a Purdue agricultural economist put the additional fuel cost from a year earlier at about $11 an acre for corn and $7 for soybeans.
The farmer does not have the same choice as an ordinary consumer. If the crop is ready, it must be harvested. That makes diesel demand less price-sensitive during the most strained weeks.
Harvest to food and interest rates
More expensive diesel does not mean that all food prices rise by the same amount. Fuel is only one part of the final price. Processing, labour, packaging, advertising, and retail margins carry more weight for packaged products. Transport matters more directly for fresh fruit, vegetables, meat, and dairy products.
Reuters reports that produce transport prices from parts of California are 40% to 120% above last year’s levels. Refrigerated trailer rates from the Yakima Valley have reached a four-year high. This is the point where the diesel record starts turning into food inflation, but with a lag.
The August CPI does not yet show the full effect. Food prices rose 2.7% over the year, while energy was up 16.3% and gasoline 27.4%. The diesel shock first appears in PPI, fuel surcharges, and farmers’ margins. It reaches the shelf later.
The harvest began in the most expensive diesel week
September usually brings seasonal downward pressure on grain prices. The new crop starts entering the market, storage fills, and uncertainty about yields declines. This year, corn has risen 11.52% over one month just as the harvest begins. Wheat has moved above $7 a bushel. Soybeans are also higher.
Corn has the strongest fundamental case. The USDA estimates the crop at 15.80 billion bushels with an average yield of 178.5 bushels an acre. Production is 7.2% below last year and the yield is 4.3% lower. The September forecast cuts US corn output by 5.4 million tonnes from August and is the main reason the global coarse-grain estimate was reduced.
Crop condition is also weaker. As of September 13, 57% of corn was rated good or excellent, down from 67% a year earlier. Only 8% had been harvested, slightly above the five-year average of 6%. Most of the harvest cost still lies ahead.
This makes corn at $5.28 a bushel more than an energy derivative. The price reflects a lower physical yield, a more expensive harvest, and higher transport costs at the same time. Ethanol is down 0.74% over one month, according to Trading Economics, while corn is up 11.52%. The biofuel channel is not the main driver of the current move.
Soybeans offer the strongest counterargument to the thesis of a broad shortage. The USDA raised its average yield forecast to 52.8 bushels an acre and expects production of 4.535 billion bushels, 6.4% above last year. Ending stocks are projected at 310 million bushels. As of September 13, 6% of the crop had been harvested, twice the five-year average for that date.
More expensive diesel therefore does not mean that physical soybeans will be scarce. It means that a larger crop can be produced at a weaker margin. The distinction matters. The futures price and the producer’s financial position can move in different directions.
Wheat remains a separate story. US planted area is the smallest in the USDA series dating back to 1919, while exports are forecast at a three-year low. Global trade is also under pressure from problems in the Black Sea. The break above $7 confirmed the signal from the July edition that grain has its own reason to remain expensive, regardless of WTI’s daily move.
The three crops are therefore saying different things. Corn points to weaker supply and higher costs. Soybeans point to good supply but a squeezed producer. Wheat points to a long-term constraint in acreage and trade flows. Their common denominator is not scarcity. Their common denominator is diesel.
CRB above 540: a broad move, but not everything is rising
The CRB Index reached 543.93 points, up 5.92% over one month and 46.71% over one year. That is above the 500 threshold monitored in July and above the previous peak of about 516 points from the most intense phase of the Hormuz shock.
The index is not a pure oil measure. Energy carries roughly 39% of its weight, agriculture 41%, and metals account for the rest. The current break therefore carries more information than a standalone WTI spike. Energy and grain are moving at the same time.
Yet this is not a fully synchronised rally. Precious metals are correcting over the month. Copper and steel are rising moderately. Lithium is down 11.44% and cobalt hydroxide 19.80%. This weakens the argument that the market is simply trading a general debasement of the dollar or uncontrolled financial liquidity.
A more precise description is a concentrated shock to physical supply chains. Oil is rising because of geopolitical risk. Diesel adds a refining premium. Container freight reflects the higher cost of moving finished goods. Corn carries a lower production forecast. Wheat carries constrained acreage and problems in global trade.
The historical parallel with 2008 remains incomplete. The broad commodity peak then was followed by a credit collapse and a demand crash. Today, the US economy is still growing, unemployment is 4.1%, and the Fed has even raised interest rates. A sharp correction is possible, but it requires either a physical recovery in fuel supplies or a sufficiently strong contraction in demand. A higher interest rate alone does not produce diesel.
The Fed raised rates after diesel raised the bill
On September 16, the Federal Reserve raised the target range by 25 basis points to 3.75% to 4.00%. The decision was unanimous. The official explanation is straightforward: economic activity remains solid, the labour market is resilient, and inflation is too high.
The decision confirms the conclusion from our second-quarter US analysis. We placed the economy in the quadrant where growth is strengthening and inflation is accelerating, creating a bias towards tightening. On July 29, the Fed was still holding rates steady even though three members voted for an increase. By September 16, the bias had become action.
The August CPI supports that caution. Headline inflation is 3.4% over the year and 0.4% over the month. The core index excluding food and energy is 2.4% annually and 0.3% monthly. Gasoline rose 3.9% in August and 27.4% over the year. The energy component is up 16.3%.
PPI is the more important signal for the coming months. Headline producer prices are 5.4% above last year’s level. Diesel jumped 24.1% in one month, truck transportation 2.0%, and transportation and warehousing 2.3%. The shock is already embedded in business costs before it has appeared fully in the consumer basket.
The Fed’s preferred PCE measure was 3.7% in July and core PCE 3.3%. The central bank’s new projections put PCE inflation at 3.7% in 2026, core inflation at 3.4%, and the median appropriate policy rate at 4.1% at year-end. This implies one more small increase or at least an extended hold near the current level.
The classic supply-shock trap returns here. A higher interest rate can cool consumption and investment. It cannot open Hormuz, rebuild a Russian refinery, or refill US distillate tanks. If it is high enough, it can reduce diesel demand through a weaker economy. The price is less production, less transport, and more pressure on farmers and independent carriers.
The White House sees the same constraint. Reuters reports that the administration is considering the use of the Defense Production Act to expand refining capacity. Refiners themselves prefer improvements and expansions at existing plants because a new refinery would cost more and take years. That may improve the system’s resilience. It cannot lower prices before the end of the current harvest or before the November midterm elections.
The Fed and the White House are therefore working with different tools on the same problem. One can suppress demand. The other can finance future capacity. Neither can produce a spare gallon this week.
What we are watching over the next 30 days
The current market no longer needs a new geopolitical shock to remain expensive. Existing constraints only need to persist while refineries enter seasonal maintenance and the harvest raises domestic demand. A one-day fall in WTI is not enough for normalisation. The physical distillate balance must improve.
Confirmation signals: the distillate shock persists
The EIA average remains above $6 for four consecutive weeks. This would show that the record is not a one-off price peak but a new fuel-surcharge regime.
NYMEX HO / ULSD remains above $5 through mid-October. This threshold would sustain pressure on PPI, freight transport, and farm margins.
Distillate inventories remain at least 10% below their five-year average at the end of September. Refinery maintenance would then begin without an adequate buffer.
Corn remains above $5.25 a bushel until harvest passes 25%. Physical supply normally pushes prices lower. Holding above this threshold would confirm that the weaker yield and cost shock are stronger than seasonal pressure.
The next PPI report shows another monthly increase of more than 1% in truck transportation. That would be direct evidence that September diesel is passing beyond the energy category.
Signals of controlled normalisation
NYMEX HO / ULSD falls below $4.25 and the EIA weekly price below $5.50. The combination matters. A lower futures price without relief at the pump does not reduce current bills.
The distillate inventory deficit relative to the five-year average narrows below 5%. This would indicate that production and imports are finally outpacing demand.
The Joliet refinery returns to sustained operation and no new large unplanned outages occur. One plant does not solve the global problem, but its recovery reduces regional risk for the Midwest.
There is a measurable recovery in fuel flows from Russia and through Hormuz. A political announcement without physical barrels is not enough.
The CRB Index moves back below 500 and corn below $4.75. That would mean the correction has broadened and is no longer limited to crude oil.
Scenario framework
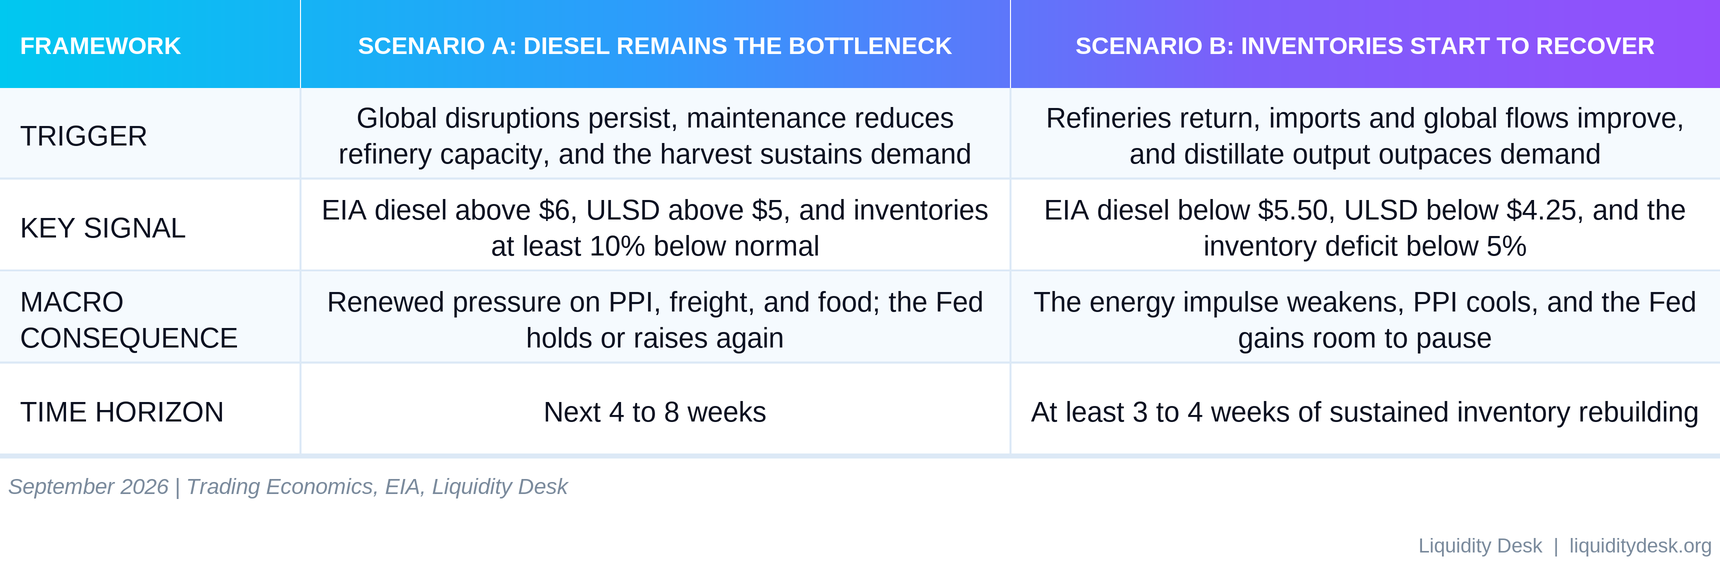
Scenario A remains our base case, but this does not mean an uninterrupted rise in price. WTI can move sharply in either direction on every headline from Iran, Russia, or Ukraine. The diesel balance changes more slowly. Inventories are low, refineries are operating close to their limit, and seasonal maintenance lies ahead.
The strongest counterargument should not be ignored. The current $6.285 is a nominal record, not an inflation-adjusted one. In 2026 dollars, the 2022 peak around $5.82 would be approximately $6.56, while the 2008 peak around $4.74 would be close to $7.20. Measured distillate consumption is also lower and the soybean crop is larger. If physical flows recover, the price can fall quickly.
The problem is timing. The farmer pays for fuel now. The carrier pays for fuel now. The inflation data will show it later.
Oil can fall on one headline. The harvest cannot wait for the next one.
Sources
Trading Economics, Commodities: market prices and monthly changes as of September 18, 2026; annual changes come from the screenshots supplied by the author.
U.S. Energy Information Administration, Weekly Retail Gasoline and Diesel Prices: the $6.285 highway diesel price for the week of September 14 and the series history since 1994.
U.S. Energy Information Administration, Weekly U.S. All Grades All Formulations Retail Gasoline Prices: the $4.455 gasoline price for the week of September 14, 2026.
U.S. Energy Information Administration, Weekly Petroleum Status Report: refinery inputs, capacity utilisation, production, inventories, imports, and consumption for the week through September 11, 2026.
U.S. Energy Information Administration, What goes into diesel prices?: the international shortage, US net distillate exports, and the connection to low domestic inventories.
The White House, Executive Order 14384: the continuing US ban on imports of Russian oil and petroleum products.
Associated Press, U.S. diesel prices soar past $6: comparison with the inflation-adjusted peaks in 2008 and 2022.
Reuters, U.S. diesel passes $6 for the first time: global drivers of the shortage, US inventories, and the crack spread, September 10, 2026.
Reuters, record diesel squeezes farmers and food transport: combine fuel use, the additional cost per acre, and food transport, September 18, 2026.
Reuters, Joliet refinery remains offline: the refinery’s capacity and status on September 17, 2026.
Reuters, Joliet refinery unit restart is ongoing: the restart of individual units on September 18, 2026.
CBS News Chicago, gas prices rise after Joliet refinery outage: the regional price effect after the shutdown.
Reuters, White House weighs use of the Defense Production Act: measures under consideration to expand refining capacity, September 11, 2026.
U.S. Bureau of Labor Statistics, CPI August 2026: headline and core inflation, energy, gasoline, and food.
U.S. Bureau of Labor Statistics, Employment Situation: the August 2026 unemployment rate.
U.S. Bureau of Labor Statistics, PPI August 2026: headline PPI, diesel, energy, transportation, and truck transportation.
U.S. Bureau of Economic Analysis, Personal Income and Outlays, July 2026: PCE and core PCE.
FTSE Russell, CoreCommodity CRB Index Methodology: composition and weights in the CRB Index.
Federal Reserve, FOMC statement, September 16, 2026 and Summary of Economic Projections: the rate decision and the inflation and policy projections.
USDA NASS, September Crop Production briefing: corn and soybean acreage, yields, and production.
USDA NASS, Crop Progress: harvest progress and crop condition as of September 13, 2026.
USDA ERS, Corn and Other Feed Grains Outlook: the September change in the US corn forecast.
USDA ERS, Soybeans and Oil Crops Outlook: soybean production, yield, ending stocks, and seasonal price.
USDA ERS, Wheat Outlook: wheat acreage, exports, and global trade.
This publication is for informational and educational purposes only. It does not constitute investment advice, a recommendation, or a solicitation to buy or sell any financial instrument. Past performance is not indicative of future results. Every investor should conduct independent research and assess their personal tolerance for risk.
Liquidity Desk | liquiditydesk.org