Sector Rotation | June 2026

June 2026 | Liquidity Desk
Narrative Bridge
In May, markets moved along two parallel tracks. The first was technological: the US-China trade truce opened space for AI capital expenditure, and the sector moved sharply higher. The second was geopolitical: tensions around the Strait of Hormuz pushed oil prices up and drove the energy sector in different directions depending on the region.
In June, neither story disappeared they simply rearranged. Technology remains the leading force, but no longer uniformly across regions. The European Tech ETF (EXV3) is up more than 10% in a single month, while US XLK is up a modest 1.5%. The gap is not coincidental. It reflects where each market started: US Tech had already run far ahead, European Tech was catching up from behind.
Geopolitical tensions around the Middle East have not gone away, but markets are repricing them. US Energy (XLE +5.7%) remains strong, while European Oil & Gas (EXH1 -2.0%) tells a different story one shaped by currency headwinds and a different regulatory environment. The dollar strengthened roughly 1.7% over the month, adding further pressure on emerging markets, particularly in Latin America.
The rotation visible in June is a story about differentiation: not all markets respond the same way to the same global signals. Who is catching up, who has overrun, and who is moving to an entirely different logic that is what this analysis examines in detail.
Macro Context
Rate Environment
The US Federal Reserve holds its effective rate at 3.62%, after a series of cuts from its 2024 peak. Yet the yield on the 10-year US Treasury is moving in the opposite direction: it currently sits at 4.54%, up 0.11% in the past month alone. This divergence between the short-term policy rate and long-term market yields is an important signal the market is betting that inflation and geopolitical pressures will keep borrowing costs elevated for longer, regardless of what the Fed does at the short end.
In Europe, the European Central Bank is expected to raise rates by 0.25 percentage points on Thursday, from 2.15% to 2.40%. Eurozone inflation has reached its highest level in over two and a half years, fuelled by the energy price shock following the Hormuz disruption. The German 10-year Bund yield sits at 3.05%, near an 18-month high, and is up more than 0.5 percentage points over the past year.
The Bank of Japan holds its short-term policy rate unchanged at 0.75% since January. Taken in isolation, Japan looks far behind the other central banks. But that picture is incomplete. The yield on 30-year Japanese Government Bonds (JGBs) is around 3.8%, and the 10-year sits at 2.67%. This is a steeply steepened yield curve: the short end pinned at 0.75% by policy, the long end moving freely higher under the pressure of inflation, fiscal concerns, and expectations of further monetary normalisation. For context: two years ago, the 30-year JGB was below 2%. In the past year alone, the long end has risen by more than one full percentage point one of the sharpest moves in the developed world. The next BOJ meeting is on June 16, with markets pricing in a hike to 1.00% and additional increases expected before year-end. Japan is quietly but irreversibly exiting the era of zero interest rates.
The Broad Dollar
The dollar strengthened approximately 1.7% over the past month, measured by the Federal Reserve's Broad Dollar Index (DTWEXBGS), which covers around 26 of the United States' key trading partners. The index currently stands at 120.08, up from 118.10 a month ago.
Dollar strength is a double-edged sword. For US companies with international revenues, it compresses earnings when foreign profits are translated back into dollars. For emerging markets whose debt is denominated in dollars, it means higher servicing costs in local currency terms. Latin America is feeling this directly, which explains much of the selling pressure visible across the region this month.
Risk Appetite
The VIX Index which measures expected volatility in the US equity market and serves as a gauge of investor fear currently stands at 20.77. For context: readings below 20 generally signal calm, above 20 indicate elevated nervousness, and above 30 are associated with active panic. The current level sits precisely at that boundary, and is up more than 17% compared to a year ago. The spike this week from around 17 to above 20 coincides with an escalation in Middle East tensions and stronger-than-expected US employment data, which pushes back the prospect of further Fed rate cuts.
United States Sector Rotation
Looking at the ranking of US sectors over the past month, the first thing you will notice is that the leader is unusual. Health Care (XLV) sits at the top with +7.2% for the month. Not technology. Not energy. Health care.
This is not coincidental, and it is not merely a matter of short-term market logic. The demographic picture across the developed world is unambiguous: ageing populations in the United States, Europe, and Japan mean structurally growing demand for healthcare services, pharmaceuticals, and medical infrastructure over the coming decades. This is one of the few sectors where long-term demand growth is largely predetermined, regardless of the economic cycle. With VIX above 20 and 10-year yields moving higher, this combination of structural growth and relative resilience in an uncertain environment attracts capital. XLV is not a purely defensive sector: it combines stable revenues with an ongoing innovation cycle in biotechnology and medical devices.
Energy (XLE) maintains its strength at +5.7% for the month. Geopolitical tension around the Strait of Hormuz continues to sustain a risk premium in oil prices, and US energy companies benefit directly. Notably, this stands in sharp contrast to European Oil & Gas (EXH1, -2.0%): the same global oil price environment, but a different outcome because currency movements, regulatory frameworks, and the composition of the two ETFs differ substantially.
Financials (XLF) is up 2.4% and holding steady. Banks benefit from a steeper yield curve: they borrow cheaply at the short end and lend at higher rates on the long end. The current shape of the curve is a favourable environment for bank margins.
Technology (XLK) is up just 1.5% for the month, despite a 3-month return of +27.5%. This is not a reversal it is a cooling after an exceptionally strong rally. The sector is not falling; capital is simply looking elsewhere, temporarily.
In negative territory are Consumer Discretionary (XLY, -5.0%) and Communication Services (XLC, -4.3%). Consumer Discretionary is sensitive to both interest rates and inflation simultaneously: more expensive credit compresses household spending, while energy price uncertainty adds further pressure. XLC suffers from a specific mix: advertising budgets are cyclical, and streaming businesses are valued at a higher discount rate in a higher-rate environment.
Materials (XLB, -3.1%) and Industrials (XLI, -1.1%) are under pressure, reflecting weaker global manufacturing data and a strengthening dollar that makes US exports more expensive.
US Sector Performance Monthly Comparison
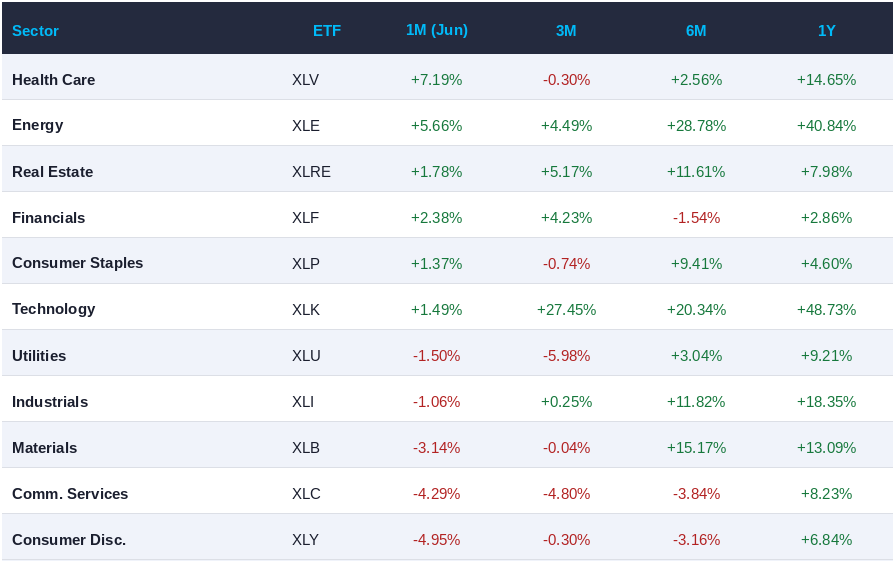
Summary: Rotation from growth to quality. Health Care and Energy lead; Tech cools after a strong Q1; cyclical sectors under pressure from rates and the dollar.
Europe Sector Rotation
The European picture in June has one dominant signal: technology is catching up, and it is doing so at a pace that cannot be ignored. EXV3, the iShares ETF tracking European technology companies in the STOXX 600, is up more than 10% in a single month. This is not merely a leadership position in the ranking it is a category of its own. The next sector sits roughly seven percentage points behind.
How to explain this? European Tech started from a significantly lower base than its US counterpart. While XLK accumulated 27.5% in the past quarter, EXV3 over the same period returned 23.7% from a much lower starting point. Investors who missed the US technology rally, or who are looking for a lower-valuation entry into the same AI theme, find European Tech a relatively more attractive proposition. Companies like ASML, SAP, and Infineon are the core of EXV3, and each is directly tied to the global semiconductor and AI capital expenditure cycle.
Travel & Leisure (EXV9, +5.0%) is the second leader for the month. European tourism remains structurally robust: the summer season approaches, bookings are at record levels, and the sector benefits from the combination of a relatively weaker euro which makes Europe more attractive to inbound tourists and resilient domestic consumption.
Retail (EXH8, +6.5%) is the surprise of the month. With rising rates and an imminent ECB hike, the consumer sector would normally be under pressure. Here, however, the composition of the ETF likely plays a role: it skews toward specialised and luxury retailers rather than mass-market names.
Banks (EXV1, +1.0%) show modest gains for the month, but context matters: the 3-month return is +10.2% and the 1-year return is +29.4%. European banks are among the structural winners of the higher-rate environment in the eurozone. Thursday's anticipated ECB hike adds further support to their net interest margins.
In negative territory, Automobiles (EXV5, -2.3%) and Basic Resources (EXV6, -1.7%) stand out. The automotive sector continues to suffer from a combination of competition from Chinese electric vehicle manufacturers, a slow EV transition domestically, and a cyclical softening in demand. Basic Resources pulls back after a strong 6-month rally (+31.2%), which is unsurprising: after a period of outperformance, the sector rests even without a fundamental shift.
Oil & Gas (EXH1, -2.0%) is perhaps the most telling contrast in the entire analysis. At a time when geopolitical tension sends US XLE up 5.7%, the European oil and gas ETF is in negative territory. The reasons are several: dollar strength compresses the revenues of European companies whose output is sold in dollars but whose costs are in euros; regulatory and tax pressure in Europe is heavier; and the current ECB policy stance is less supportive for capital-intensive sectors.
European Sector Performance Selected
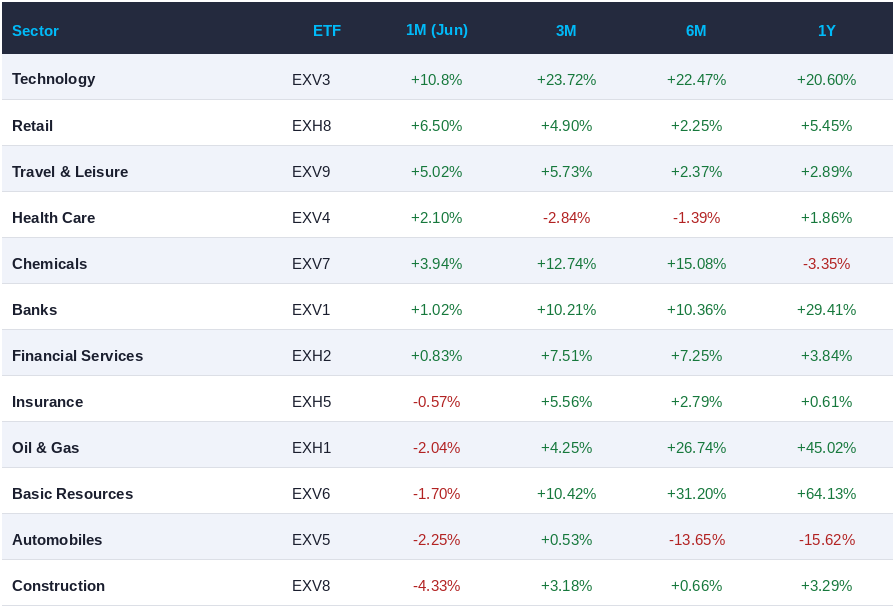
Summary: European Tech is the story of June. Beneath the surface: banks continue their structural cycle, tourism holds, while autos and commodities remain under pressure.
Asia Country Rotation
In Asia, sector-level analysis gives way to country-level analysis. The reason is structural: Asian markets differ sufficiently from one another in regulatory environment, currency dynamics, and economic cycle that a country ETF tells more than any sector indicator. An investor in EWY (South Korea) and an investor in FXI (China) are living in entirely different realities, even if both are nominally "invested in Asia."
Taiwan (EWT, +3.2%) and South Korea (EWY, -4.4%) are the two semiconductor markets in the group, but with different outcomes for the month. EWT holds positive ground while EWY pulls back. The difference is not fundamental but technical: EWY has accumulated +35.8% in just the past quarter and +90.3% over six months one of the strongest moves across the entire ETF universe in this analysis. At that pace, a -4.4% pullback in a single month is more likely a healthy pause than a signal of reversal. Both markets remain structurally tied to the global AI and semiconductor cycle: TSMC dominates EWT, Samsung and SK Hynix dominate EWY.
China is split across two ETFs with different scopes but a single message: FXI, which tracks large-cap Chinese equities, is -6.3% for the month; MCHI, the broader China market, is -6.8%. The 6-month performance of both sits around -10% to -11%. This is not a short-term correction it is continued, sustained weakness. Domestic demand in China remains subdued, deflationary pressure has not been fully resolved, and geopolitical tensions around Taiwan add a risk premium that investors find difficult to price. Dollar strength adds further pressure on the yuan and increases the cost of dollar-denominated debt service.
India (INDA, -4.2%) is the negative surprise. Unlike China, where weakness has clear fundamental explanations, the Indian market pulls back despite a relatively solid macro picture. The 1-year performance is -13.6% significant for a market that a year ago was the favoured alternative to China for many international investors. Likely contributing factors include elevated valuations after the previous period of enthusiasm, a weaker rupee against a strengthening dollar, and partial capital outflows from emerging markets broadly.
Japan (EWJ, -2.7%) gives back modest ground for the month. The context from the Macro Context section is critical here: while the BOJ policy rate sits at 0.75%, 30-year JGB yields are around 3.8%. This steep curve signals that the market is running ahead of the central bank in expecting normalisation. Higher long-term rates in Japan reduce the incentive for the carry trade the practice of borrowing cheaply in yen and investing The partial unwinding of these positions puts pressure on Japanese equities.
Asia Country ETF Performance
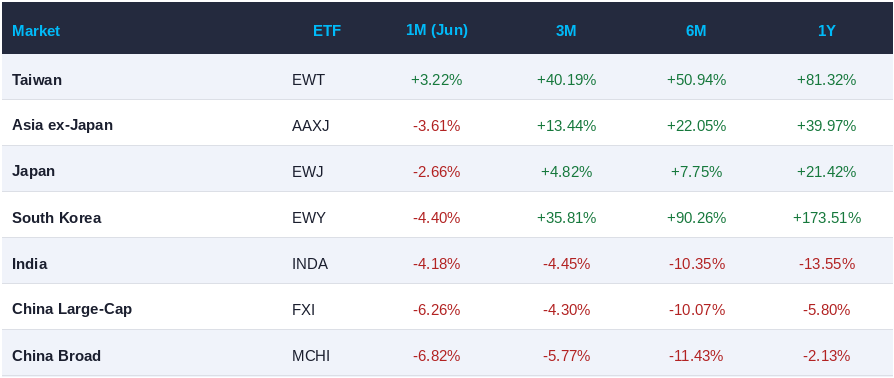
Summary: Semiconductor markets retain structural strength despite short-term fluctuations. China remains under sustained pressure. India disappoints. Japan adapts to a new rate reality.
Latin America Country Rotation
Latin America is the weakest region in June without exception. Four of five ETFs are in negative territory for the month, and the broad regional index ILF is down 8.7%. To understand why, the starting point is not the local markets it is the dollar.
The roughly 1.7% strengthening of the broad dollar index over the month is a direct hit to Latin American assets through two channels. First, most of the commodities these economies depend on are priced in dollars: when the dollar rises, commodity revenues in local currency terms shrink relative to expectations. Second, a significant portion of corporate and sovereign debt in the region is dollar-denominated: a stronger dollar means more expensive debt service in local currency.
Brazil (EWZ, -13.5%) is the worst-performing market across the entire universe this month. This is an exceptionally sharp move even for a volatile emerging market. On top of the structural dollar headwind, specific domestic factors compound the pressure: Brazil's fiscal position remains vulnerable, real interest rates are high, and periodic political uncertainty around budget discipline continues to unsettle international investors. When global risk appetite declines, Brazil is typically among the first markets from which capital exits.
Mexico (EWW, -6.2%) faces an additional specific risk: proximity to the US economy, which is normally an advantage, in the current environment also carries direct exposure to Washington's trade policy. Uncertainty around tariffs and the future of the USMCA trade agreement adds a risk premium that weighs on valuations.
Chile (ECH, -6.0%) is tied to the copper cycle. With a strengthening dollar and signs of softening Chinese demand, copper is under pressure and that flows directly into Chilean revenues and market valuations.
Argentina (ARGT, +3.3%) is the sole green patch in the region and deserves separate attention. The Milei reform programme continues to attract capital despite and perhaps because of the broader regional weakness. Investors positioned in the Argentina story are doing so on a specific thesis: fiscal consolidation, relaxation of currency controls, and structural economic transformation. That thesis does not depend on the direction of the dollar or general EM sentiment, which explains why Argentina is moving to a different rhythm from its neighbours.
Latin America Country ETF Performance
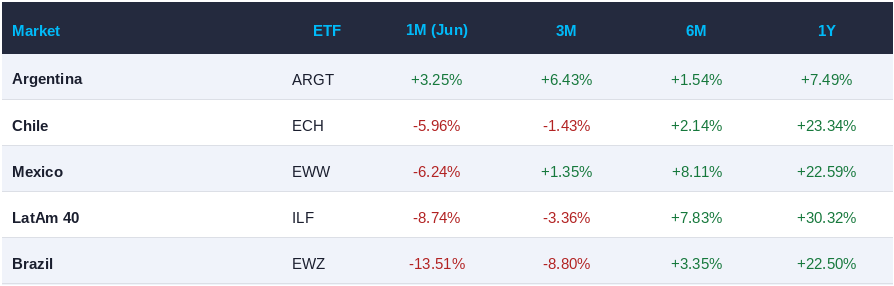
Summary: LatAm under systemic dollar pressure. Brazil most affected by the combination of global and local risks. Argentina stands apart with a reform story that temporarily insulates it from regional trends.
Rotation Signal & Conclusion
When we place all four regions side by side, one pattern comes into focus: capital is moving toward quality and selective growth, and away from broad bets on cyclicality and emerging markets.
This is not panic. A VIX at 20.77 sits at the edge of nervousness but does not signal active distribution. It is more accurately described as a repositioning: investors are not leaving markets, they are choosing more carefully which ones to stay in.
Three themes dominate the June rotation.
The first is technology as a global theme with regional differentiation. Across the US, Europe, and Asia, the technology sector and its adjacent markets are among the leaders over longer time horizons. But on a monthly basis, the differences are instructive: European Tech (EXV3, +10.8%) is catching up aggressively; the Taiwan market (EWT, +3.2%) holds steady; and US XLK (+1.5%) pauses after an exceptional quarter. The thesis around the AI capital expenditure cycle and semiconductor demand remains intact, but the market is now more selective about the precise point of entry.
The second theme is the geopolitical risk premium in energy but only in specific places. US Energy (XLE, +5.7%) continues to benefit from the Hormuz context. European Oil & Gas (EXH1, -2.0%) does not. This divergence suggests that investors are not buying oil as a global macro theme they are buying specifically US exposure to it, with lower regulatory and currency overhead.
The third theme is the dollar as the regulator of global flows. The 1.7% monthly strengthening is sufficient to explain much of the LatAm weakness, the pressure on the Chinese yuan, and the correction in India. If the dollar continues to strengthen on the back of higher US rates and geopolitical uncertainty, emerging markets will continue to face structural headwinds.
Outside these three themes, Health Care sends a quieter but important signal. When Health Care leads the US ranking in an environment of elevated volatility, the market is telling you it prefers predictability over aggressive growth. Combined with its demographic inevitability, the sector deserves a permanent allocation regardless of where we are in the economic cycle.
The June conclusion is this: global rotation is not unidirectional it is multi-layered. Technology remains the structural theme but is increasingly being traded on a region-by-region basis. Quality and predictability are becoming more valued as uncertainty rises. The dollar is the key variable for emerging markets. And Argentina continues to remind us that sometimes the best story in the room is the one nobody expected.
Member discussion