Liquidity Snapshot | April 2026

Four central banks. One trap. The wound at Hormuz.
On April 29, 2026, Jerome Powell held his final press conference as Chair of the Federal Reserve. The following day, Christine Lagarde stepped before the cameras after the ECB's rate decision. Both said essentially the same thing: we do not know where this is going, and we cannot move.
This is not an ordinary pause in monetary policy. The Federal Reserve is more divided than at any point since 1992: one member voted to cut rates, while three others refused to support even a hint of future cuts in the official statement. Four dissenters, but in two opposite directions simultaneously. The ECB voted unanimously to hold, but a debate on raising rates was conducted openly at the meeting. The Bank of Japan held at 0.75%, with three board members voting to hike. The People's Bank of China has done nothing for months, despite every economic indicator making the case for stimulus.
Four of the most powerful central banks in the world are frozen at the same time. The reason is the same across all four: the war in the Middle East and the disruption to the Strait of Hormuz have trapped the global economy in a configuration where inflation is rising but growth is slowing. Central banks can still move, but every direction now carries a cost. Cutting risks validating the energy shock and reopening the inflation problem. Hiking risks breaking growth that is already fragile. Waiting is not a sign of confidence; it is the least dangerous option available.
In this edition of the Global Liquidity Snapshot, we look behind the official statements. We examine what is actually happening to liquidity across the four largest economies in the world, where the money is coming from, whether it is reaching the real economy, and what all of it means for the next 30 to 60 days.
Block 1: Central Banks
The Federal Reserve (United States)
Net Fed Liquidity stands at $5.710 trillion as of April 30, 2026. The number alone does not tell the full story. What matters more is how it got there.
The Federal Reserve officially ended its quantitative tightening program in December 2025, having reduced its balance sheet from a peak of $8.9 trillion in 2022 to approximately $6.7 trillion. Since December 2025, the Fed has shifted to a regime of reserve management purchases, buying T-Bills to maintain adequate reserves in the system. Technically the balance sheet is expanding slightly, but the scale is incomparable to the QE of 2020 to 2022. This is a neutral position, not a stimulative one.
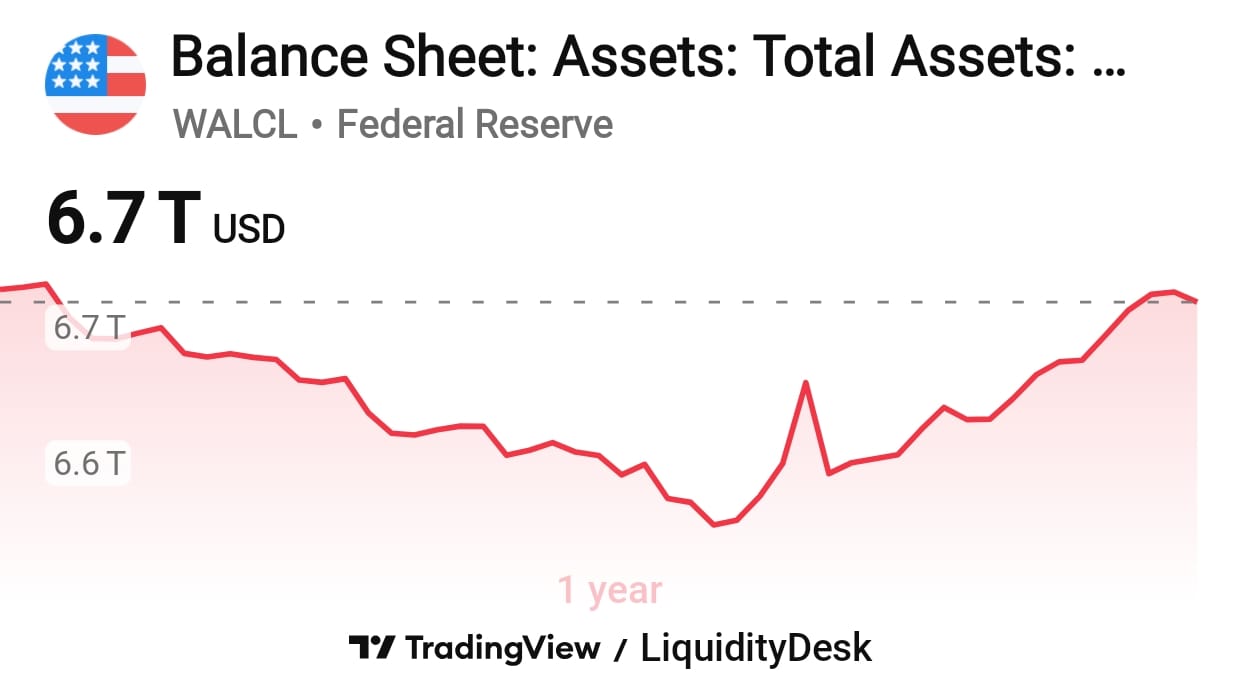
The system is tightening not because of the Fed itself, but because of the Treasury. The government's account at the Federal Reserve, known as the Treasury General Account or TGA, stands at $982 billion. When the government collects taxes and does not spend, those funds leave the banking system and sit locked in that account. This is exactly what happened in late April: over two weeks the TGA rose by more than $250 billion, draining directly from bank reserves and pulling Net Fed Liquidity down from $5.954 trillion on April 15 to $5.701 trillion on April 22. The partial recovery to $5.710 trillion on April 30 suggests the tax season pressure has slightly eased, but the structural tightening remains.
The other buffer, the Fed's overnight reverse repo facility, is effectively exhausted. A year ago it held $250.6 billion. As of April 30 it holds $8.3 billion, up from $0.747 billion the previous day, a typical month-end spike as money market funds park excess cash overnight before the calendar turn. Outside of these brief technical movements, RRP balances have hovered near zero for months. The cushion that banks used to park excess liquidity no longer exists.
On an annual basis, Net Fed Liquidity is $160 billion below where it stood a year ago. From the historical peak of $7.137 trillion reached in September 2021, the system has shed $1.427 trillion, a decline of 20%. The system is tighter than the official rate policy suggests.
The European Central Bank (Eurozone)
The ECB held rates unchanged on April 30: deposit facility rate at 2.00%, main refinancing rate at 2.15%. The decision was unanimous, but Lagarde confirmed that a debate on raising rates was conducted openly at the meeting.
The Eurosystem balance sheet stands at €6.216 trillion, reduced by €2.562 trillion or 29.2% from the October 2022 peak of €8.778 trillion. Normalization continues methodically at approximately €59 billion per month. At this pace the system reaches pre-pandemic levels in approximately 11 months.
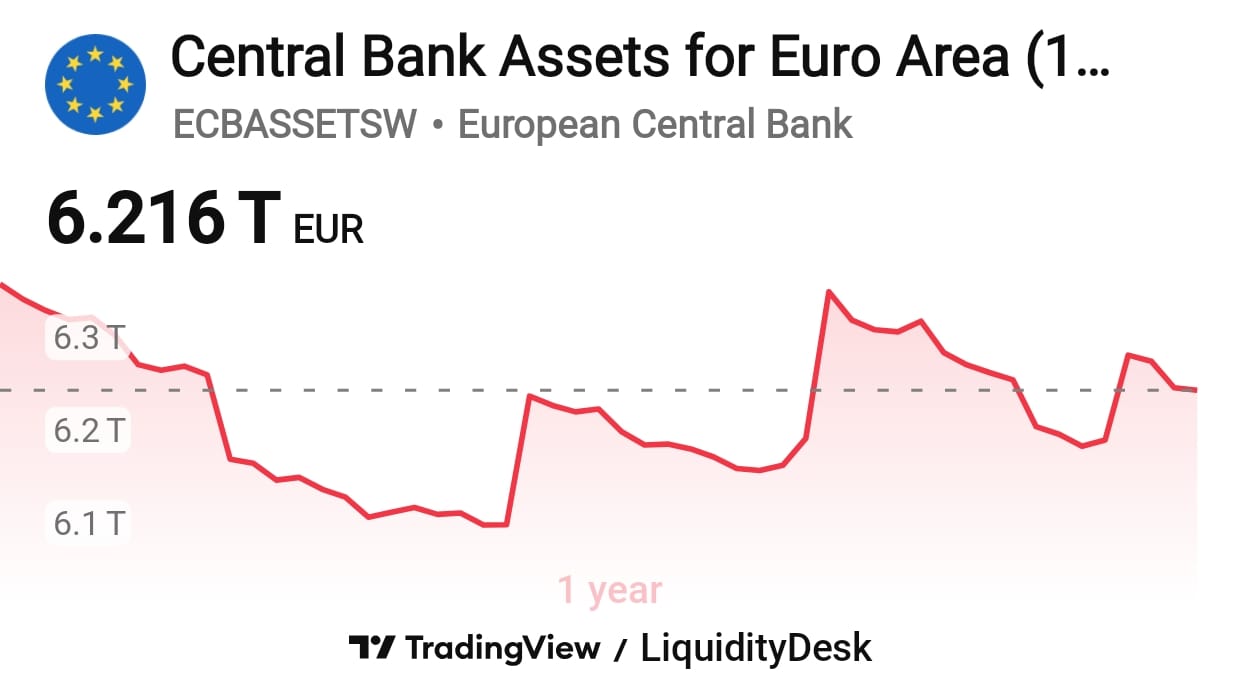
Excess liquidity in the system, the funds banks hold at the ECB above required reserves, stands at €2.316 trillion. It has been reduced by 51.2% from the peak of €4.748 trillion, but remains €616 billion above the pre-pandemic baseline of approximately €1.700 trillion. This is precisely what Lagarde means when she says the system still has an abundance of liquidity: normalization is real, but the system is not dry.
Bank of Japan (Japan)
The BOJ held its policy rate at 0.75% at the April 28 meeting, but the vote was 6 to 3, with three members pushing for a hike. Official policy is quantitative tightening, with JGB purchases declining by approximately ¥200 billion per quarter from April 2026.
The BOJ balance sheet stands at ¥662 trillion as of end of March 2026, reduced from the August 2024 peak of ¥765 trillion. QT is real on paper, but execution is inconsistent: month to month the balance sheet fluctuates as the BOJ conducts stabilization operations in the JGB market.
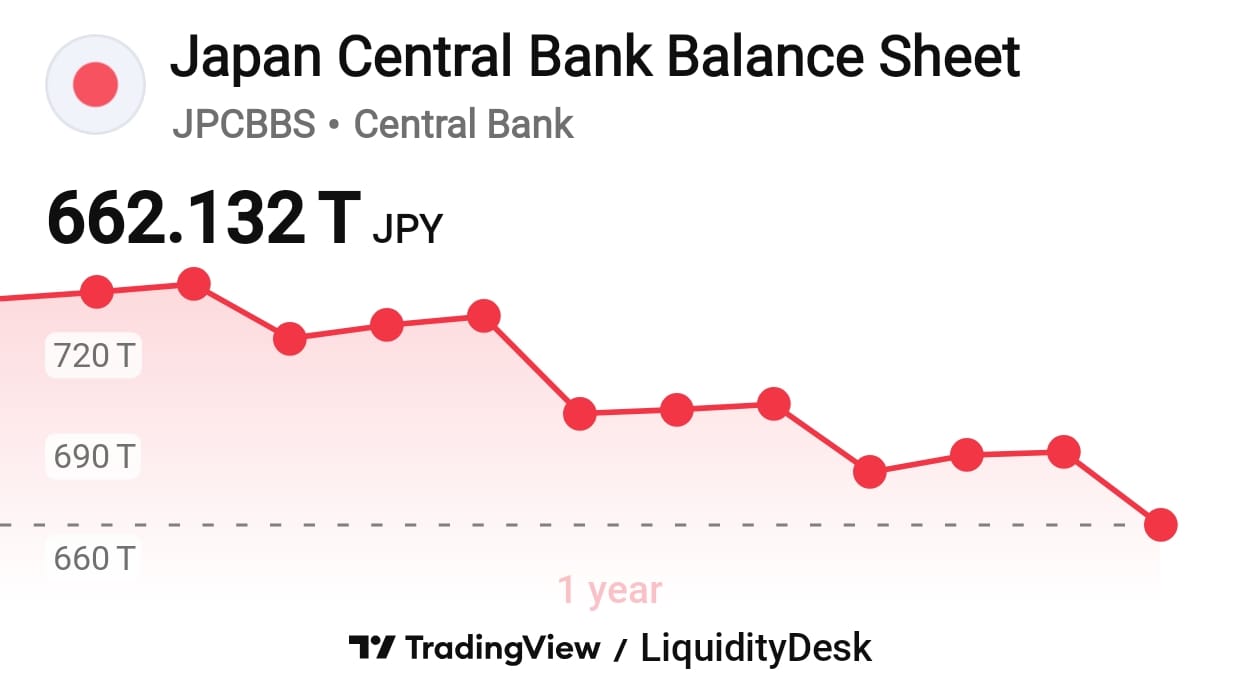
Bank reserves held at the BOJ, the measure of current liquidity in the system, stand at ¥469 trillion as of end of April 2026. The monetary base is falling 11.6% year on year, a genuine tightening signal.
The critical nuance: the BOJ is not only a central bank. It is the anchor of the global carry trade. At a policy rate of 0.75%, investors continue to borrow in yen and invest in higher-yielding assets elsewhere. Estimates of the size of these positions run around $500 billion. Any further BOJ rate hike carries the risk of triggering an unwinding of those positions, producing global volatility disproportionate to the size of the Japanese economy itself.
The People's Bank of China (PBOC)
The PBOC held its one-year Loan Prime Rate at 3.00% at the April 20 meeting. The decision was expected, but the macro context makes clear: this pause is not confidence. It is an institution waiting for the moment of maximum impact before acting.
The PBOC balance sheet stands at approximately CNY 49.14 trillion as of February 2026, down from CNY 49.99 trillion in January. This means the headline balance sheet is not expanding aggressively at the moment. The easing signal comes instead from the policy mix: the reserve requirement ratio for large banks remains at 7.50%, the seven-day reverse repo rate stands at 1.40%, and targeted liquidity injections continue through reverse repo operations. In other words, China is not delivering broad balance-sheet expansion in the Western QE sense. It is using targeted liquidity management to keep the banking system liquid while avoiding a disorderly weakening of the currency or an uncontrolled credit impulse.
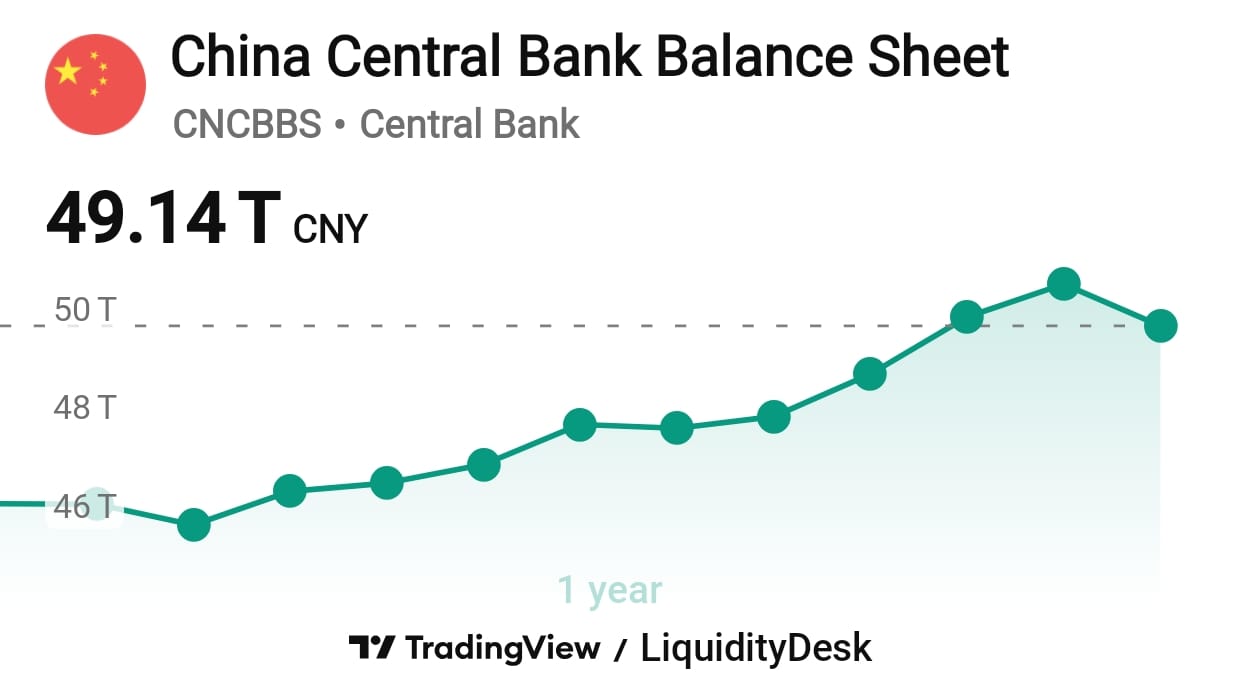
The PBOC is still the only one of the four central banks operating with an easing bias, but it is a specific kind of easing: slow, targeted, and domestically contained. Capital controls mean this liquidity remains largely inside the Chinese system and does not spill directly into global markets. Its influence reaches the outside world through indirect channels: commodity demand, trade flows, and emerging market financing.
Synthesis: who is adding, who is withdrawing
Block 2: Private Credit
United States
Bank credit in the United States is growing steadily. Total bank credit stands at $19.48 trillion as of mid-April 2026, up 6.7% year on year. Commercial and industrial loans, the credit extended to businesses for operations and investment, stand at $2.83 trillion, up 5.7% year on year. Consumer spending is growing 5.3% year on year, and personal income recovered to plus 0.6% in March after registering zero in February.
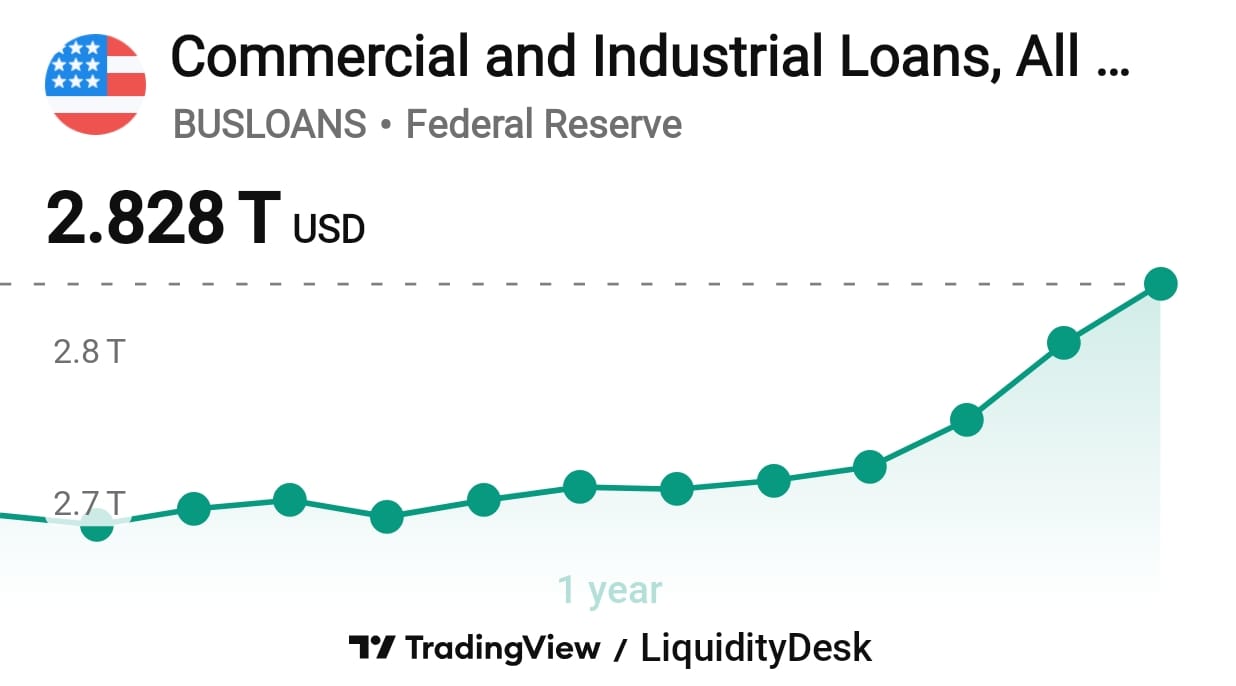
The picture is clear: the transmission mechanism in the United States is working. The central bank set the conditions, banks are lending, and money is reaching the real economy. The acceleration in C&I loans is particularly significant because it reflects corporate investment and working capital demand. When businesses borrow, they typically do so because they see demand ahead of them.
Eurozone
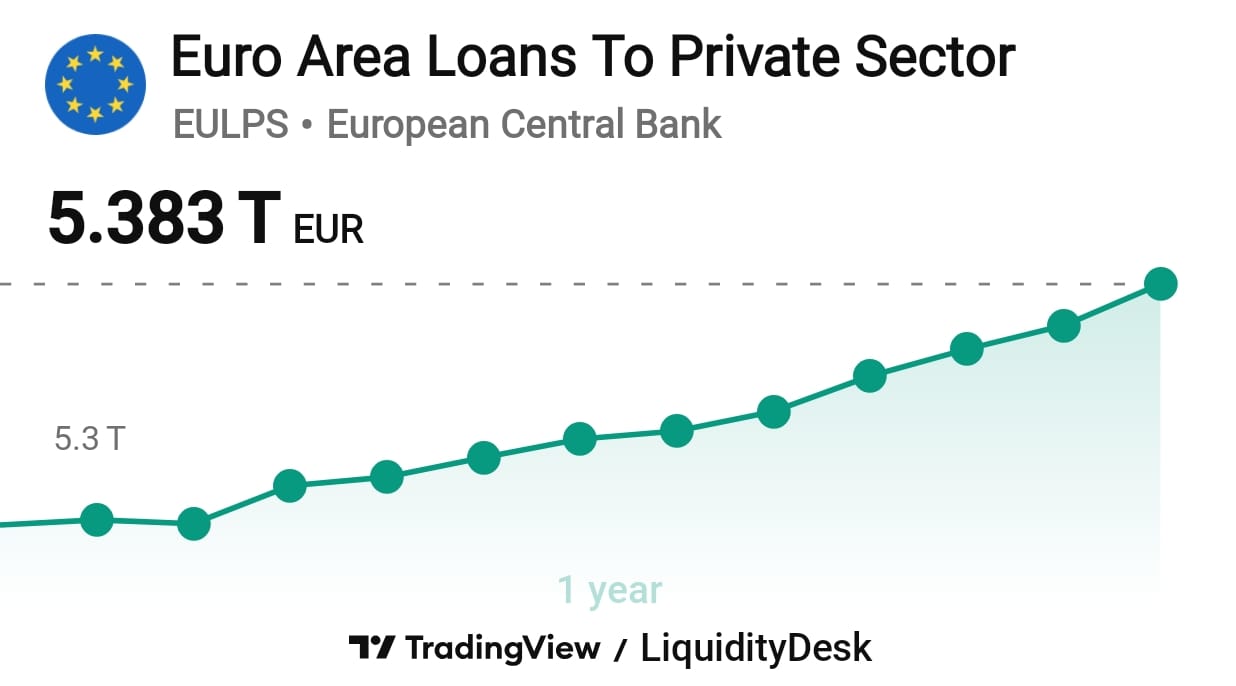
In the Eurozone the picture is more subdued. Credit to non-financial corporations is growing at 3.2% year on year as of April 2026, while credit to households stands at 3.0% year on year, stable.
The ECB's Bank Lending Survey for Q1 2026 shows a net tightening of credit standards for corporate loans of 10%, exceeding the 6% tightening anticipated in the previous survey round and marking the most pronounced tightening since Q3 2023. Demand for new loans has also weakened, with banks citing geopolitical tensions and energy developments as key factors behind the tightening pressure. For consumer credit, the tightening was sharper, with a net 15% of banks reporting stricter criteria. Looking ahead to Q2 2026, banks expect a more marked tightening of credit standards across all loan categories.
The tension is clear: credit volumes are still growing, but the conditions under which that credit is extended are tightening. Today's GDP print of 0.1% quarter on quarter adds important context. At that level of growth, the deterioration in lending conditions visible in the survey data may begin to show up in the volume numbers in the months ahead.
China
China is the most complex case in this block. Outstanding loan growth is running at 5.7% year on year, which looks solid on the surface. But the composition is weaker than the headline suggests. Loans to households stand at approximately CNY 83.57 trillion, while loans to banks stand at approximately CNY 277.92 trillion. The banking system is liquid, but the demand side remains uneven.
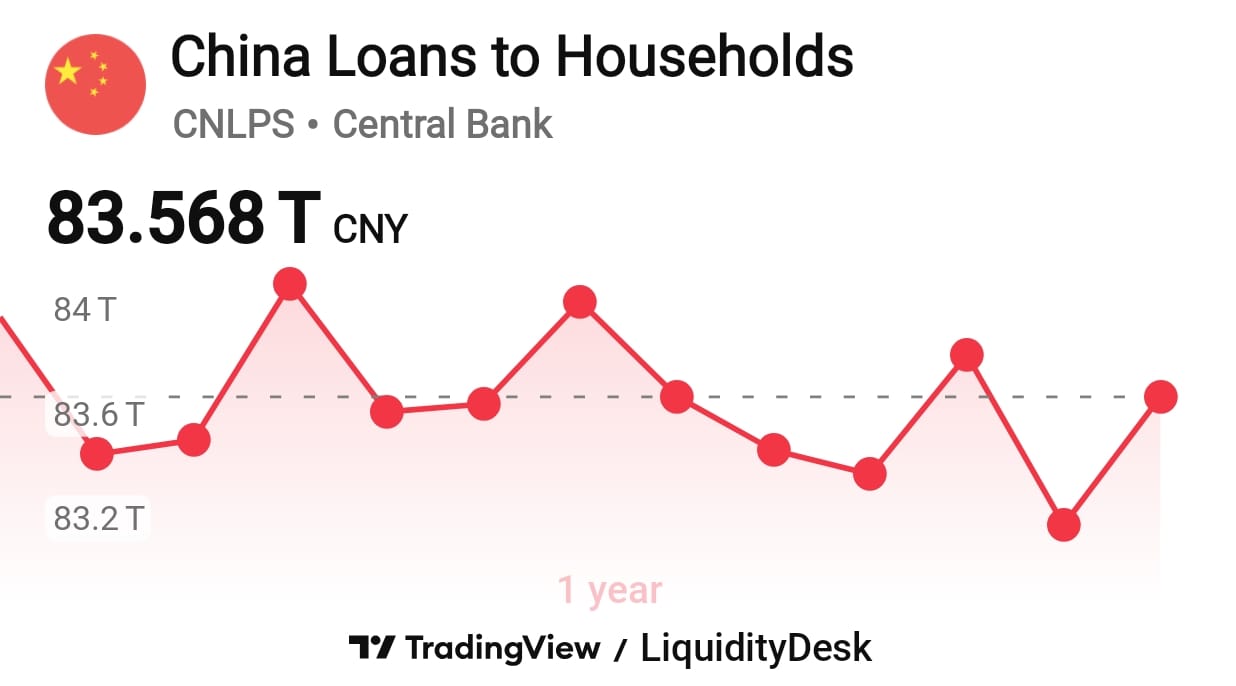
Total Social Financing for March 2026 came in at CNY 5.23 trillion, below the median market forecast of CNY 5.4 trillion. New yuan loans fell to CNY 3.363 trillion, also below expectations. The message is not that China lacks liquidity. The message is that liquidity is not being absorbed cleanly by households and the private economy.
Why? Mortgage demand remains weak because of the ongoing property market crisis. Consumer credit is suppressed by weak purchasing power outside the major cities. Government bond issuance has also slowed compared with earlier bursts of fiscal support. Banks have the liquidity and the administrative capacity to lend. The problem is on the other side of the table: demand is insufficient.
This is precisely the gap China has been trying to close for years. The supply side is strong, with Q1 2026 GDP at 5.0% and industrial production up 5.7% year on year. But the consumer is not spending, with retail sales growing only 1.7% year on year against expectations of 2.3%.
Japan
Japanese bank lending is growing at 4.8% year on year as of March 2026, the strongest pace since April 2021 and above market expectations of 4.4%. Loans to the private sector stand at ¥587.705 trillion.
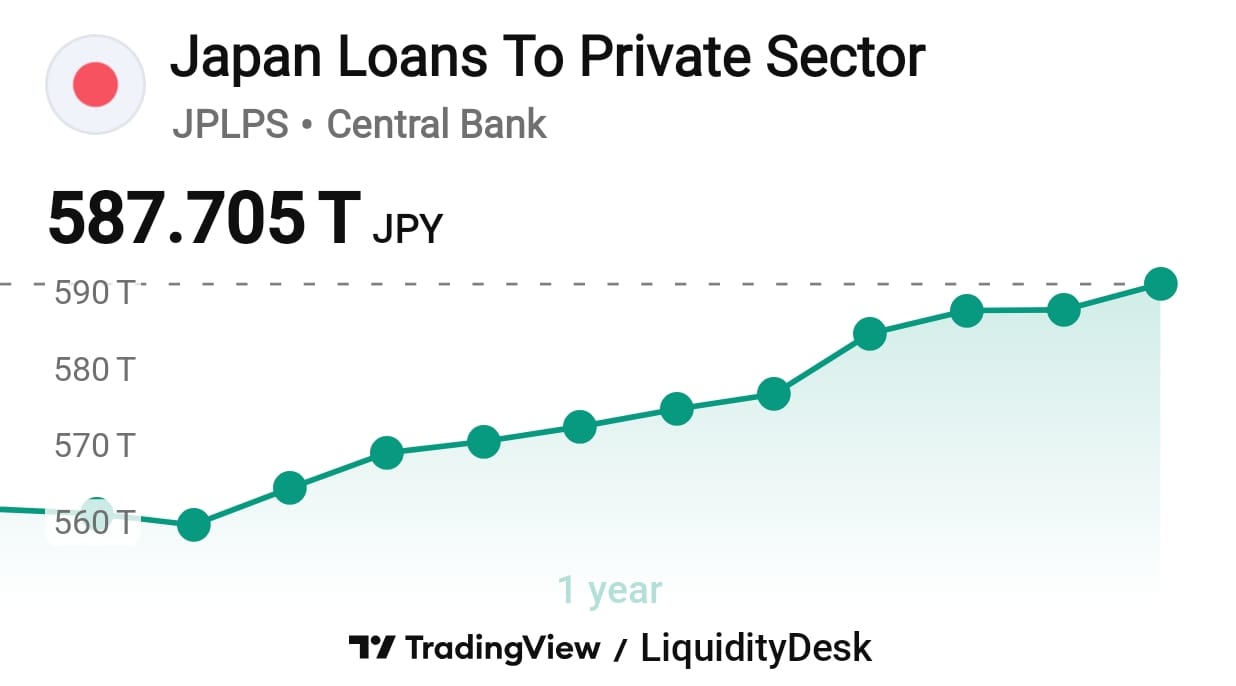
Growth is driven by large banks, which are expanding at 6.3%, while smaller regional and shinkin banks are growing at only 1.4%. This means credit is reaching the corporate sector but less so small businesses and households outside the major metropolitan areas.
Notably, Japanese bank lending is growing faster in relative terms than American bank lending, despite the BOJ's official tightening stance. Banks are lending because corporate Japan is investing, partly driven by the reshoring of manufacturing back to the domestic economy.
Synthesis: is the transmission mechanism working
The overall conclusion: private credit is functioning across all four economies, but with different intensity and through different channels. The United States and Japan show the strongest credit activity. Europe is functional but restrained. China has the liquidity and the banking capacity, but not enough demand on the other side of the table to absorb it.
Block 3: M2
M2 is the broad measure of money supply. It includes currency in circulation, bank deposits, and short-term savings. If Block 1 shows what central banks are injecting, and Block 2 shows what commercial banks are adding through lending, then M2 is the result of both. It is the aggregate of the liquidity that is actually circulating in the economy.
United States
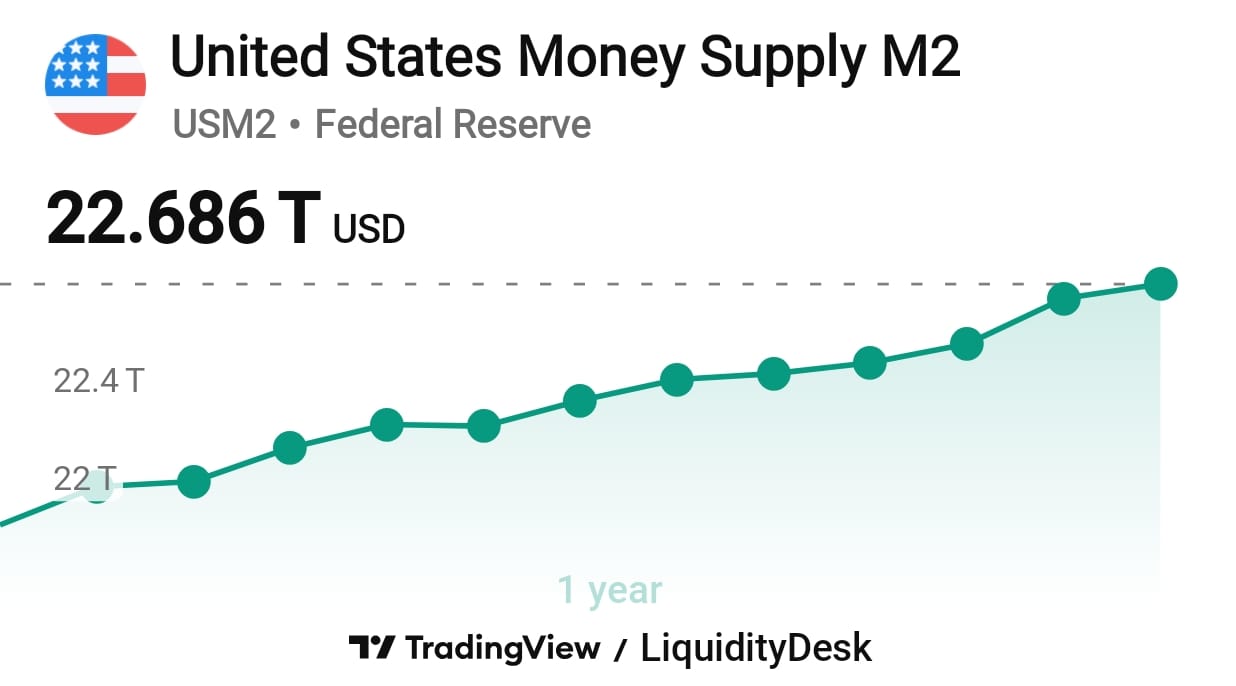
M2 in the United States stands at $22.686 trillion as of March 2026, a new record. Year on year growth is approximately 4.5%, steady and consistent. The context matters: between April 2022 and October 2023, M2 fell for the first time in decades, compressed by the simultaneous tightening of the Fed and the contraction in bank lending. Now M2 has not only recovered but surpassed its previous peak. The driver is not the Fed, whose balance sheet is now in neutral, but the government's fiscal deficit and bank lending. When the government spends more than it collects in taxes, the gap is financed through Treasury issuance. The issuance phase can temporarily withdraw liquidity from the banking system as investors and money funds pay for those securities, especially when the Treasury General Account is being rebuilt. The liquidity effect reverses when the Treasury spends those balances back into the economy: government payments become deposits in the private sector. Separately, bank lending expands M2 because new loans create new deposits. The fiscal deficit creates the foundation by adding net financial assets to the private sector; private credit determines how strongly that foundation is multiplied through the banking system.
Eurozone
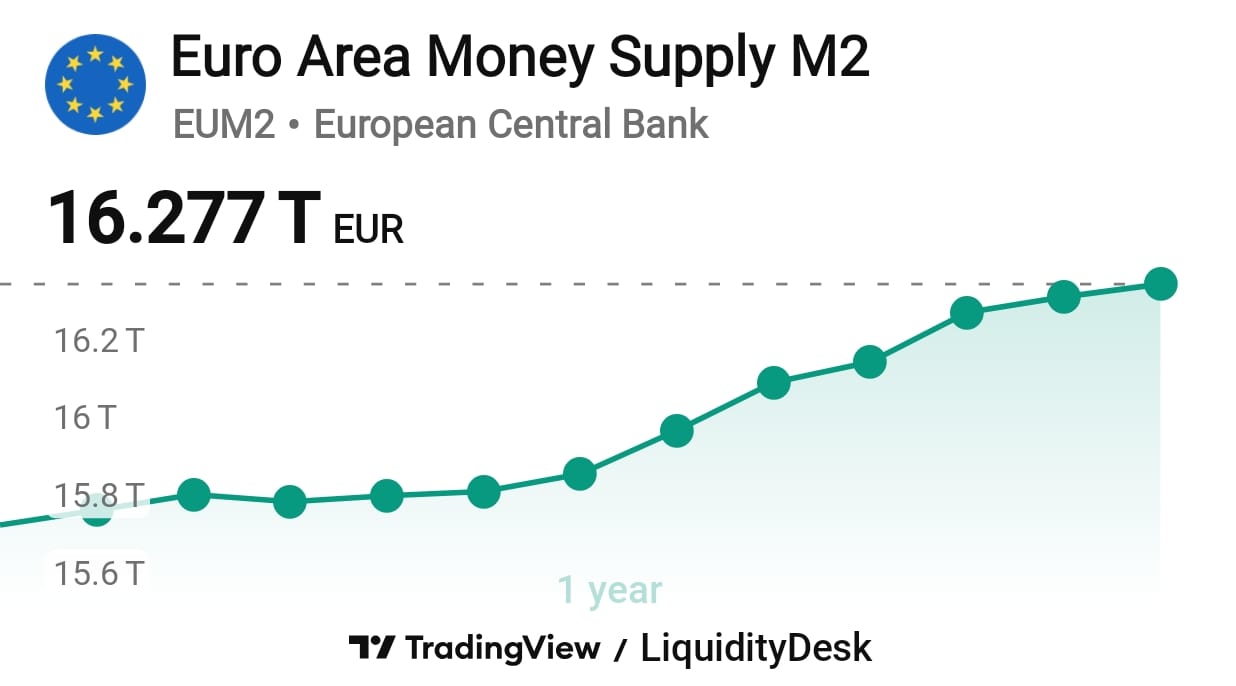
M2 in the Eurozone stands at €16.277 trillion as of March 2026, also a new record. M3, the broader measure the ECB monitors officially, is growing at 3.2% year on year, a slight acceleration from 3.0% in February. This is a moderate, healthy pace. With the ECB balance sheet contracting at approximately €59 billion per month, M2 continues to grow because bank lending compensates. The credit flows to households and corporations examined in Block 2 are sufficient to keep money supply expanding despite central bank normalization.
China
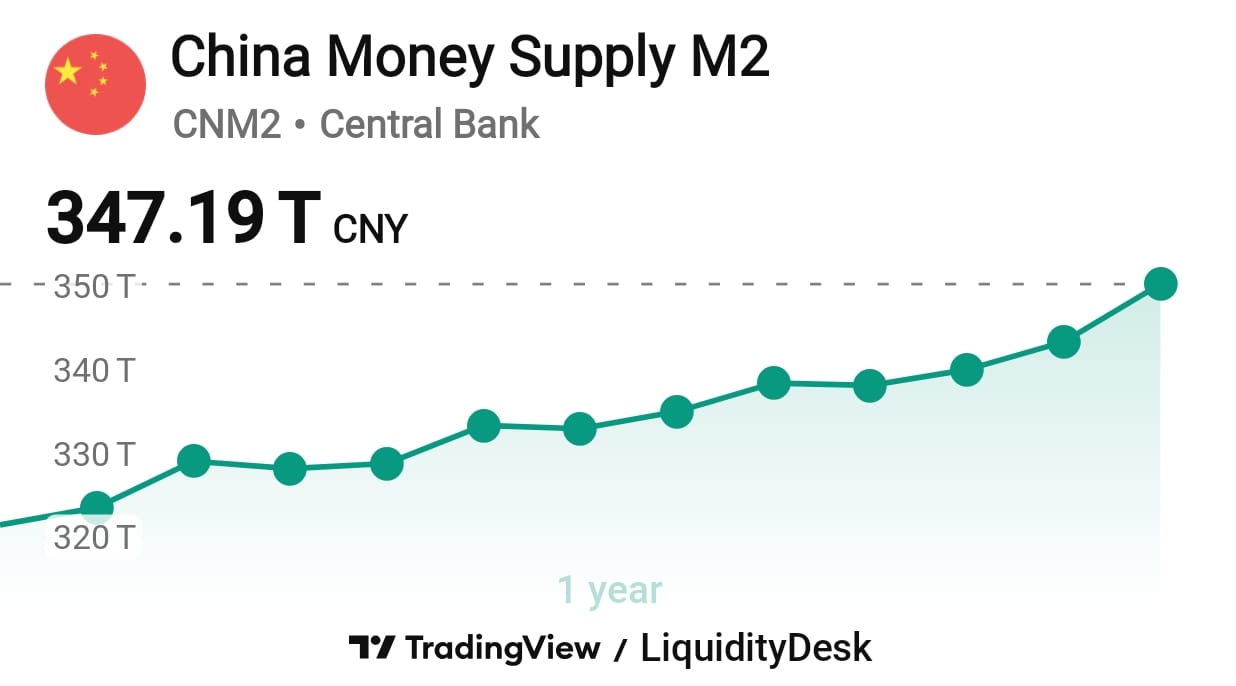
M2 in China stands at CNY 347.19 trillion as of March 2026, a new record, growing at 8.5% year on year. This is a slight deceleration from 9.0% in February but remains well above historical norms. The number is striking in the context of everything else: weak consumer demand, credit below expectations, an ongoing property crisis. How does M2 grow this fast when credit demand is this soft?
The dynamic is similar to the US but with a key difference. The Chinese government issues bonds, banks buy them, and the PBOC provides reserves through reverse repo operations and reserve requirement reductions. This initially withdraws liquidity, but the PBOC's subsequent injections recycle it back into the banking system. The critical difference from the US is what happens next: in China, that liquidity circulates inside the banking system without being fully transmitted into the real economy as consumption. Capital controls keep it contained. This is why China can simultaneously report 8.5% M2 growth and 1.7% retail sales growth.
Japan
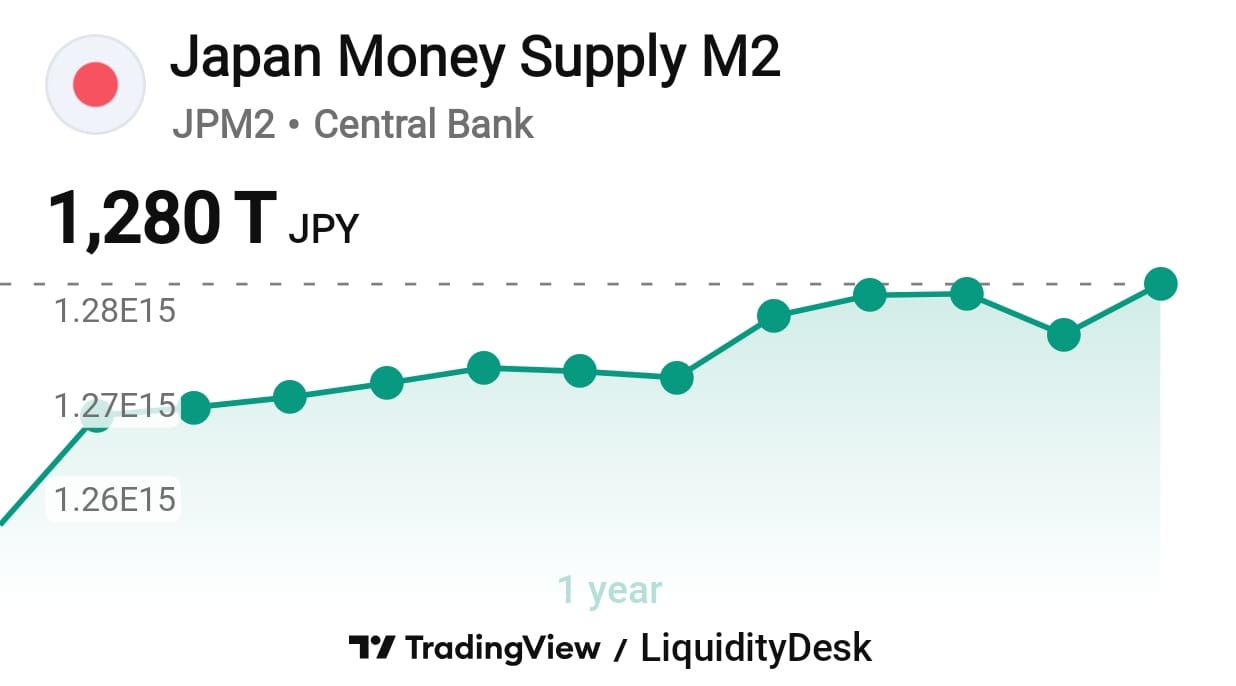
M2 in Japan stands at ¥1.280 quadrillion as of March 2026, a new record, with year on year growth accelerating to 2.0% in March from 1.7% in February. The contrast with the monetary base is instructive: M2 is growing and accelerating while the monetary base is falling 11.6% year on year. This means that bank lending, growing at 4.8% year on year as examined in Block 2, is fully offsetting the contraction from the BOJ's quantitative tightening and then some. The Japanese banking system is multiplying liquidity despite the official tightening stance.
Synthesis: is global money supply accelerating or decelerating
Global money supply is growing everywhere simultaneously. This is supportive of risk assets in aggregate. But the quality of that growth differs: US and European M2 are expanding because their economies are functioning, China's is expanding through structural mechanisms despite weak real demand, and Japan's is accelerating despite official tightening because the banking sector is more than compensating. Not all M2 growth is equal.
Block 4: Spreads and Market Conditions
Spreads measure the difference in yield between different types of debt instruments. When spreads are tight, markets are calm and credit is accessible. When they widen, markets are signaling stress: investors demand greater compensation for risk, credit becomes more expensive, and financial conditions tighten. Spreads are the system's thermometer. They show whether markets are confirming or contradicting what we see in Blocks 1, 2, and 3.
United States
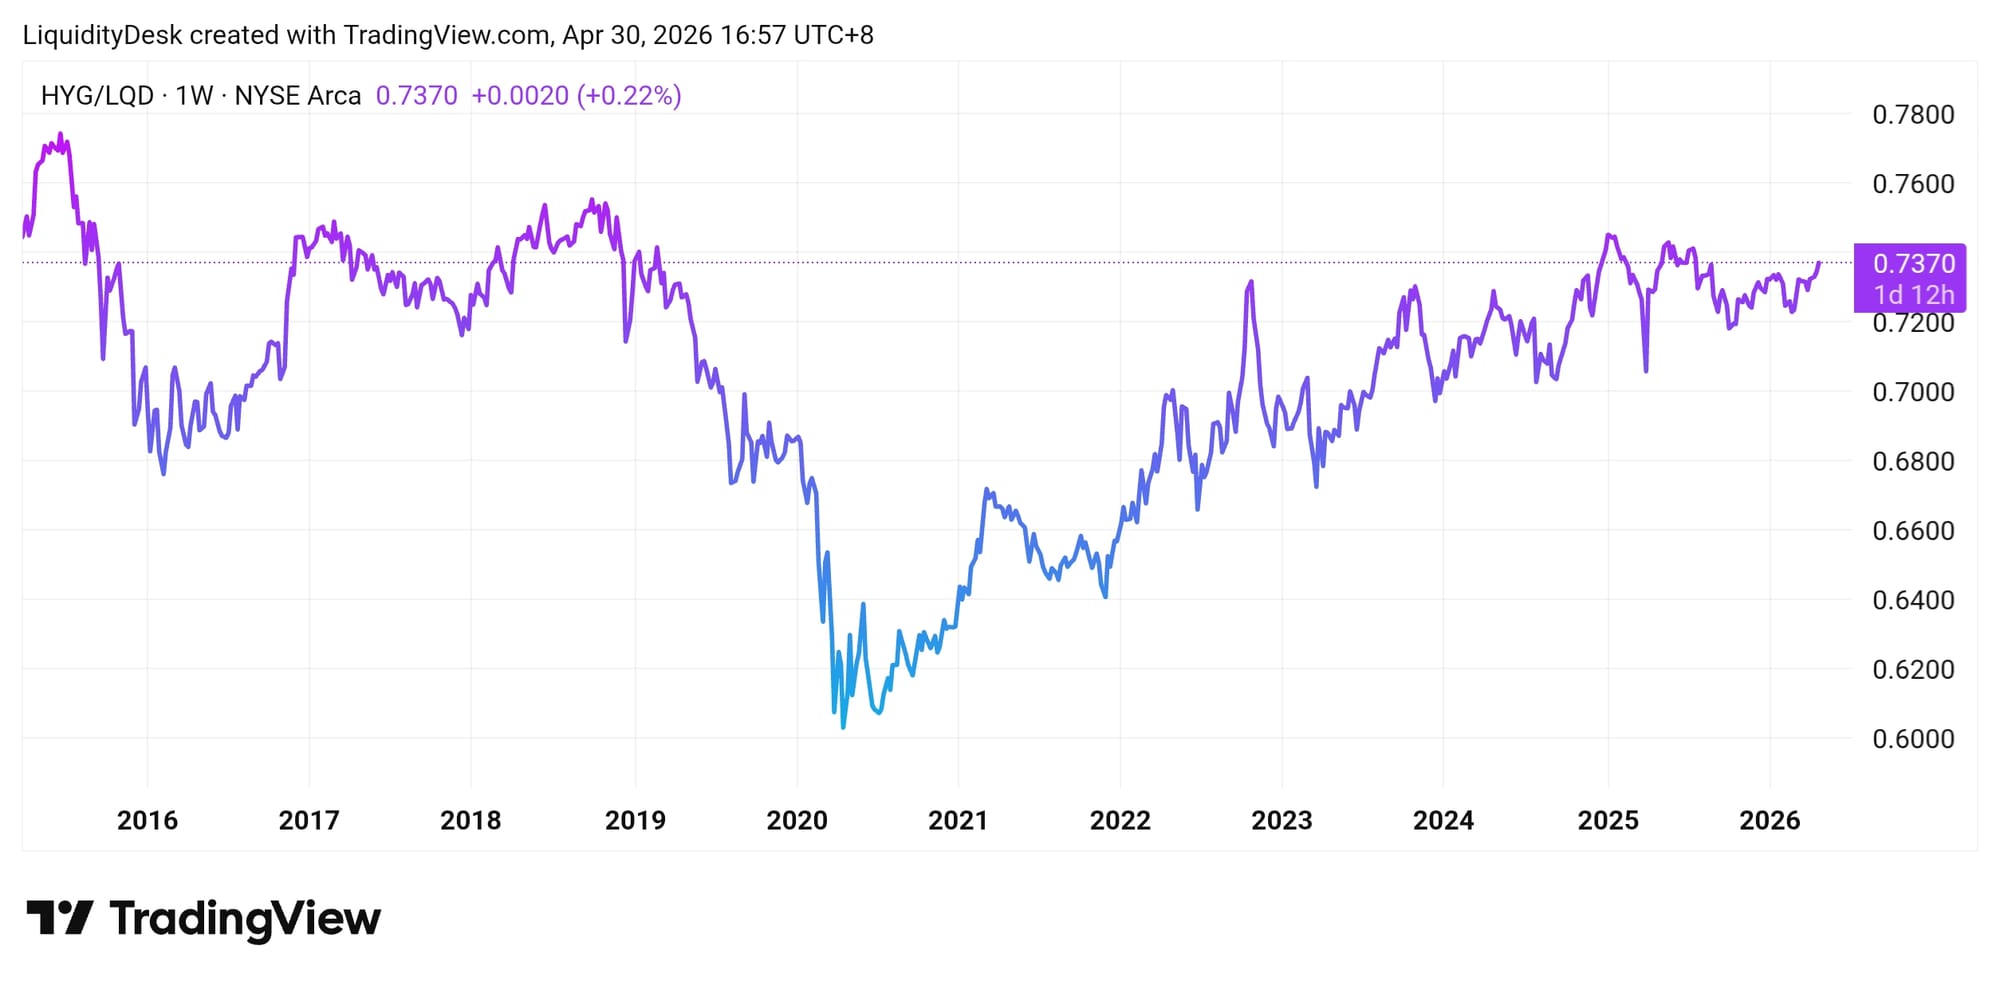
The HYG/LQD ratio compares the price of high-yield bonds against investment-grade bonds and measures appetite for credit risk. It currently stands at 0.7370, close to its historical average and far from panic territory. The March 2020 low was 0.61. The October 2022 low was 0.64. At 0.7370, markets are not pricing credit stress.
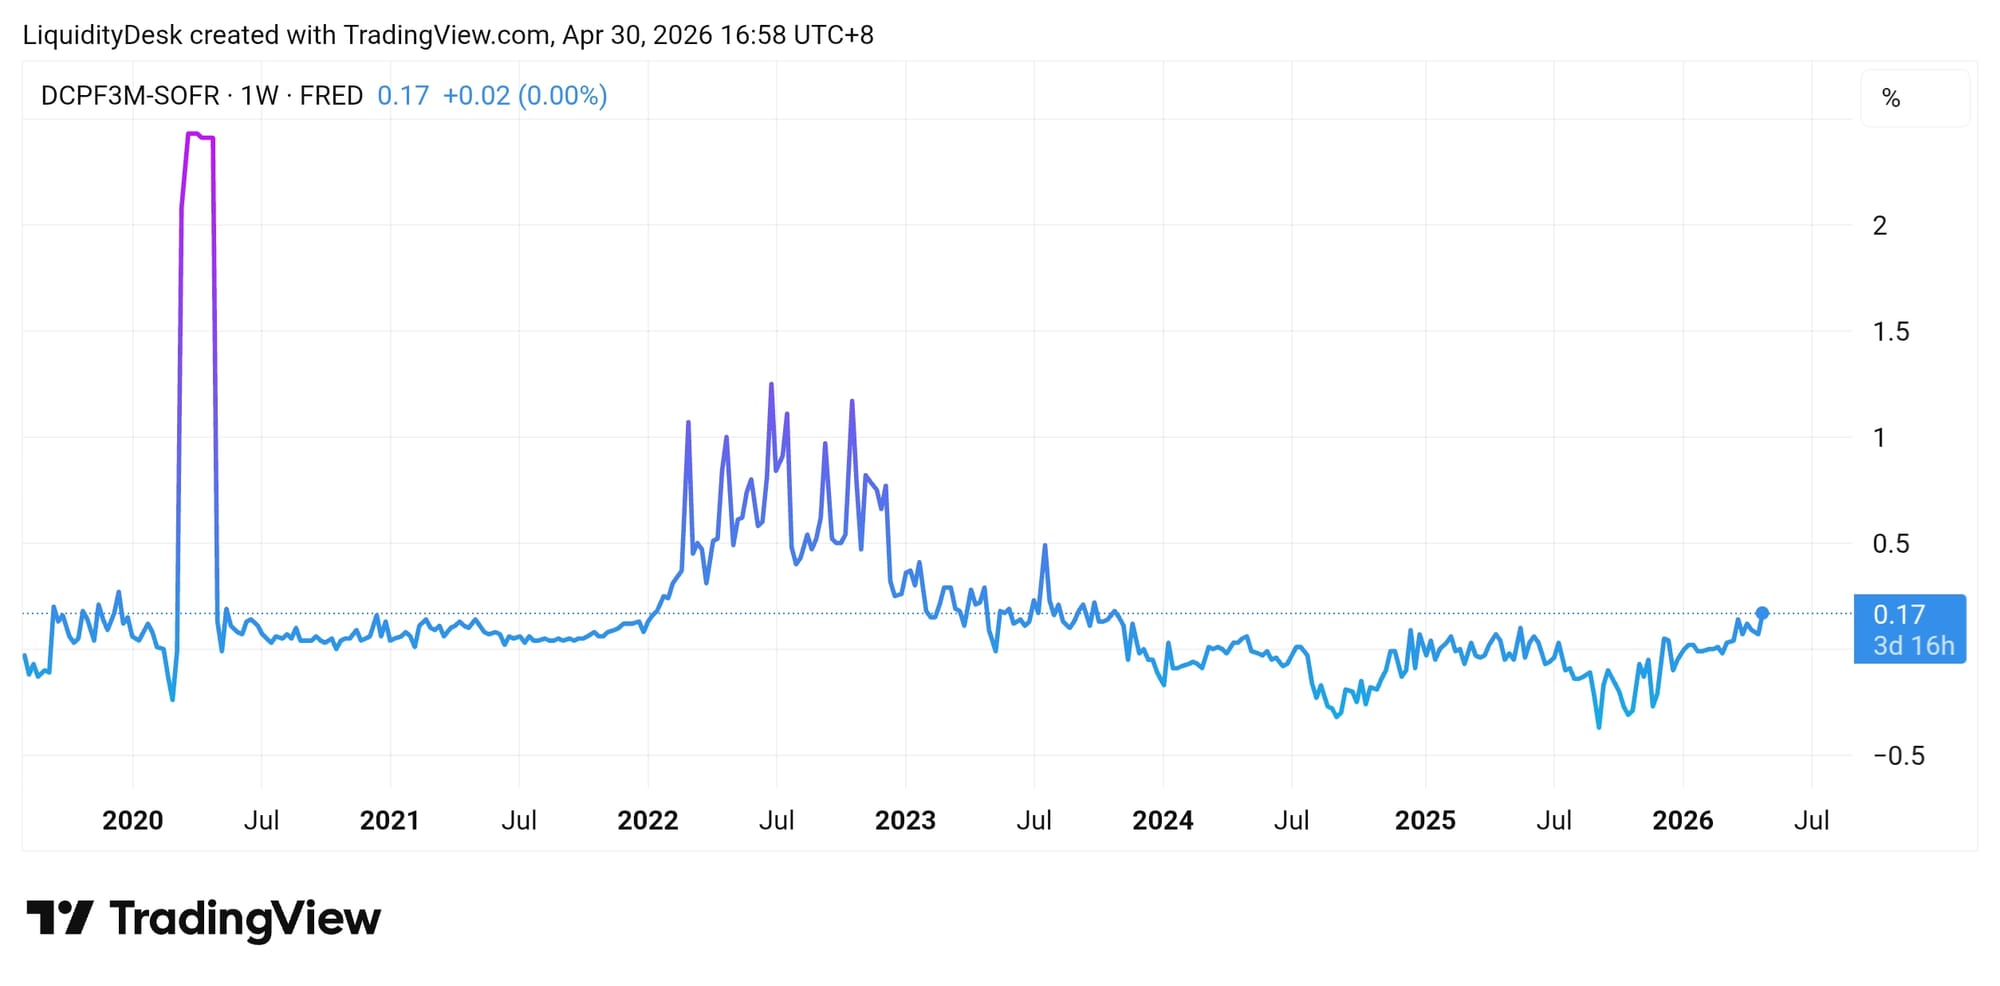
The DCPF3M-SOFR spread, the difference between the rate on commercial paper and the SOFR reference rate, stands at 0.17%. This measures stress in short-term dollar funding. For context: during the banking crisis of March 2023 this spread spiked above 1.3%. At 0.17% the financial system is experiencing no tension in access to dollars.
The US Treasury curve is normal and upward sloping: the 3-month yield is 3.68%, the 2-year is 3.93%, the 10-year is 4.41%, and the 30-year is 4.99%. The spread between the 2-year and 10-year is plus 48 basis points. A normal curve means the market expects the Fed to cut rates in the future without signaling a near-term recession.
Eurozone
EURIBOR 3M, the rate at which European banks lend to each other for three months, stands at 2.17% as of April 27. The ECB deposit facility rate is 2.00%. The gap of approximately 17 basis points is identical to the American DCPF3M-SOFR spread and carries the same message: no funding stress in the European banking system. The €2.316 trillion in excess liquidity still sitting in the system is the primary reason for this calm. Lagarde said it directly today: the system still has an abundance of liquidity.
Important context from today's data: Eurozone headline inflation came in at 3.0% year on year in April against GDP growth of only 0.1% quarter on quarter. The concern here is not liquidity. It is stagflation. Spreads are calm, but the real economy is barely growing.
China
The Chinese interbank rate SHIBOR stands at 1.42%, against a PBOC reverse repo rate of 1.40%. The spread is practically zero, reflecting the abundance of liquidity in the Chinese banking system maintained through reverse repo operations and reserve requirements at 7.50%. The PBOC has recently injected CNY 126.2 billion through reverse repo operations. The system is flooded with liquidity.
But again: liquidity in the banking system and liquidity in the real economy are different things in China. TSF below expectations and weak retail sales show that calm interbank spreads are not translating into a real credit impulse reaching households and businesses.
Japan
The BOJ policy rate is 0.75% and the deposit rate is 0.32%. Bank lending is growing at 4.8% year on year and the Japanese government bond market is functioning normally following the end of Yield Curve Control. BOJ purchases of government bonds stand at ¥27.440 trillion, declining methodically.
The specific Japanese risk does not lie in spreads. It lies in carry trade dynamics. At a policy rate of 0.75%, yen-denominated positions remain attractive for financing. But three BOJ board members voted for a hike at the last meeting. If the BOJ raises rates toward 1.0% or beyond in the coming months, the unwinding of carry positions would generate global volatility entirely disconnected from local spread levels.
Synthesis: are financial conditions tightening or easing
Market indicators are remarkably calm given the level of uncertainty surrounding them. None of the classic signals of financial stress are activated. This can mean one of two things: either markets are correctly pricing the genuine resilience of the system, or they are lagging behind the data and a correction is ahead. The Fed decision, inflation prints, and the trajectory of the Middle East situation over the next 30 to 60 days will provide the answer.
Block 5: Synthesis and Outlook
The liquidity matrix
Transmission weight: how much of this liquidity reaches the world
Not all liquidity is equal in its global impact. The four economies examined in this report influence the rest of the world through fundamentally different channels, and understanding those differences is more important than adding up the numbers.
The dollar is the world's reserve currency. When Net Fed Liquidity moves, the entire world feels it: commodity prices, emerging market financing conditions, global risk assets. The current structural drain through the TGA, with NFL sitting $1.427 trillion below its historical peak, is a global phenomenon, not just an American one. Every dollar locked in the government's account at the Fed is a dollar not circulating in the global financial system. Relief will come when the TGA begins to draw down in May and June as tax season closes. If the debt ceiling delays that drawdown, the tightening continues. An important structural note: the Fed officially ended QT in December 2025 and has shifted to a neutral stance with minor reserve management purchases. The active withdrawal of liquidity has stopped, but active addition has not begun.
The euro is a regional force. The ECB's influence is concentrated in Europe and partially in Central and Eastern Europe and Africa. The global effect of ECB normalization is real but disproportionately smaller than the American channel. What matters for the global picture is not the size of the ECB balance sheet in isolation but European growth: at 0.1% quarter on quarter, Europe is not a driver of global demand.
The Bank of Japan exerts global influence not through direct capital flows but through the yen and the carry trade mechanism. Estimates of active carry positions run around $500 billion. Every BOJ rate hike carries the risk of triggering an unwinding of those positions, which historically produces sharp global volatility disconnected from the fundamentals of specific markets. Three BOJ board members are already voting for a hike. June is the next decision point.
Chinese liquidity is a closed system. Capital controls mean that 8.5% M2 growth and PBOC reverse repo injections do not spill directly into global markets. The influence reaches the outside world through three indirect channels: commodity demand, which moves prices for oil, copper, and iron ore globally; trade flows, where Chinese exports suppress manufactured goods prices everywhere; and emerging market financing through Belt and Road mechanisms. With domestic consumption weak and retail sales growing at only 1.7% year on year, the first and most important channel is operating below its potential.
Who is driving liquidity right now
With central banks in neutral to tightening positions everywhere except China, the primary driver of global liquidity at this moment is private credit. American banks are lending at 6.7% year on year, Japanese banks at 4.8%, European banks at a more moderate 3.2%. These flows explain why M2 is at record levels everywhere despite official tightening from central banks. This is a critical distinction: the marginal liquidity impulse outside China is not coming primarily from central bank decisions. It is coming from decisions made by commercial banks and their clients. Private credit is procyclical: it expands when the economy is healthy and contracts sharply when conditions deteriorate. With rising geopolitical uncertainty, stagflationary pressure, and frozen central banks, this is where the system's vulnerability lies. If private credit turns, there is no central bank buffer ready to compensate quickly.
Where the global liquidity cycle stands
The global liquidity cycle is in the middle to late stage of the current tightening cycle, with an important asymmetry across economies. Europe remains in central-bank tightening mode. The United States is different: the Fed has shifted to neutral after ending QT, but Treasury operations are still draining liquidity through the TGA. In both economies, private credit and M2 are compensating and keeping conditions functional. China is easing, but the effect is contained domestically. Japan is officially tightening but practically inconsistent.
The overall weighted picture: global broad money is expanding, but not through a clean central-bank reflation cycle. The system is liquid, but it is not receiving a clear policy tailwind. Spreads are calm, M2 is growing everywhere, and credit is functioning. But central banks are constrained, the geopolitical shock has not resolved, and structural tightening pressures are accumulating quietly beneath the surface.
Implications for assets
Equities are in a delicate position. Liquidity is sufficient to support valuations but not sufficient to stretch them meaningfully higher. Calm spreads and functioning credit are positives. But Core PCE at 3.2% and a Fed trapped between opposing factions means the rate tailwind from 2024 is not returning soon. The technology sector, sensitive to the discount rate, remains under structural pressure.
Bonds reflect the trap precisely. The normal curve with a 10-year yield at 4.41% shows that markets expect future cuts but are in no hurry. The 10-year German Bund yield near a 15-year high of approximately 3.05% is the European equivalent of the same message.
Gold is in an environment that has historically favored it: geopolitical uncertainty, central banks trapped, real rates below inflation in parts of the world, and sustained structural demand from emerging market central banks.
Commodities depend heavily on the Strait of Hormuz. With the conflict ongoing, Brent above $111 reflects a geopolitical risk premium as much as a demand signal. A resolution would compress oil sharply and simultaneously remove the primary inflation argument against rate cuts at every major central bank.
Emerging markets face a dual dependency: on the dollar and on Chinese demand. With NFL structurally tight and Chinese consumption weak, structural conditions for EM are not favorable despite calm spreads.
Key risks for the next 30 to 60 days
The Strait of Hormuz remains the central question. Powell said it directly on April 29: energy prices have not yet reached their peak. Lagarde repeated the same from Frankfurt on April 30. A prolonged conflict keeps every central bank frozen and maintains inflation structurally elevated. A resolution would unlock the potential for simultaneous rate cuts across multiple jurisdictions.
The TGA dynamic in the United States is the second most important near-term factor. Tax season closes in May and June, and the TGA should begin drawing down from $982 billion. Every dollar the government spends adds liquidity to the system. If the debt ceiling constrains government spending, that relief is delayed.
The BOJ June meeting is the third risk. With three members voting for a hike at the last meeting and the inflation forecast raised to 2.8%, June is a live decision point. A Japanese rate hike in the current environment of global uncertainty would trigger carry trade unwinding with unpredictable global consequences.
The leadership transition at the Fed on May 15 carries institutional uncertainty. Kevin Warsh takes the chairmanship of the most divided FOMC since 1992, in an environment of stagflationary pressure and an active geopolitical conflict. Markets do not know how the new leadership will balance the competing factions within the committee.
Closing
The Strait of Hormuz is an open wound in the body of the global economy. A wound that has not ruptured completely, but is not healing. Oil flows, but at a price and under constant risk. Insurance costs rise, shipping routes lengthen, refineries operate under pressure. The local inflammation is already a fact. The question is whether it stays local. If the conflict extends through the summer, the transmission channels, energy, fertilizers, transport, food, will carry the infection into the entire body. And the central banks, frozen in their own trap, have no instrument to stop it.
Liquidity Desk | liquiditydesk.org | liquiditydesk.substack.com
Data sources: Federal Reserve, ECB, Bank of Japan, People's Bank of China, FRED (WALCL, WTREGEN, RRPONTSYD, TOTBKCR, BUSLOANS), ECB Data Portal, Trading Economics, Baha Breaking News.
For informational and analytical purposes only. Not financial advice.
Member discussion