Three Markets, Three Different Stories.
One of Them is Probably Wrong.
A Liquidity Desk Analysis | May 2026
Crude oil is up nearly 80% this year. The S&P 500 just hit a new all-time high. And the yield on the 30-year US government bond (the benchmark for the true long-term cost of borrowing in the world's largest economy) is sitting at 5.12%, near its highest level in decades.
Three of the most important prices in global finance. Three completely different signals.
Oil is saying: inflation is not gone. Stocks are saying: everything is fine, the economy is strong, earnings are solid. Bonds are saying: borrowing money for a long time is expensive, and that is not changing soon.
These three stories can coexist for a while. But history shows they rarely coexist for long.
One of these three markets is probably mispricing reality. The question is which one.
What Each Market is Actually Saying
Oil at $109: Inflation Has Not Been Solved
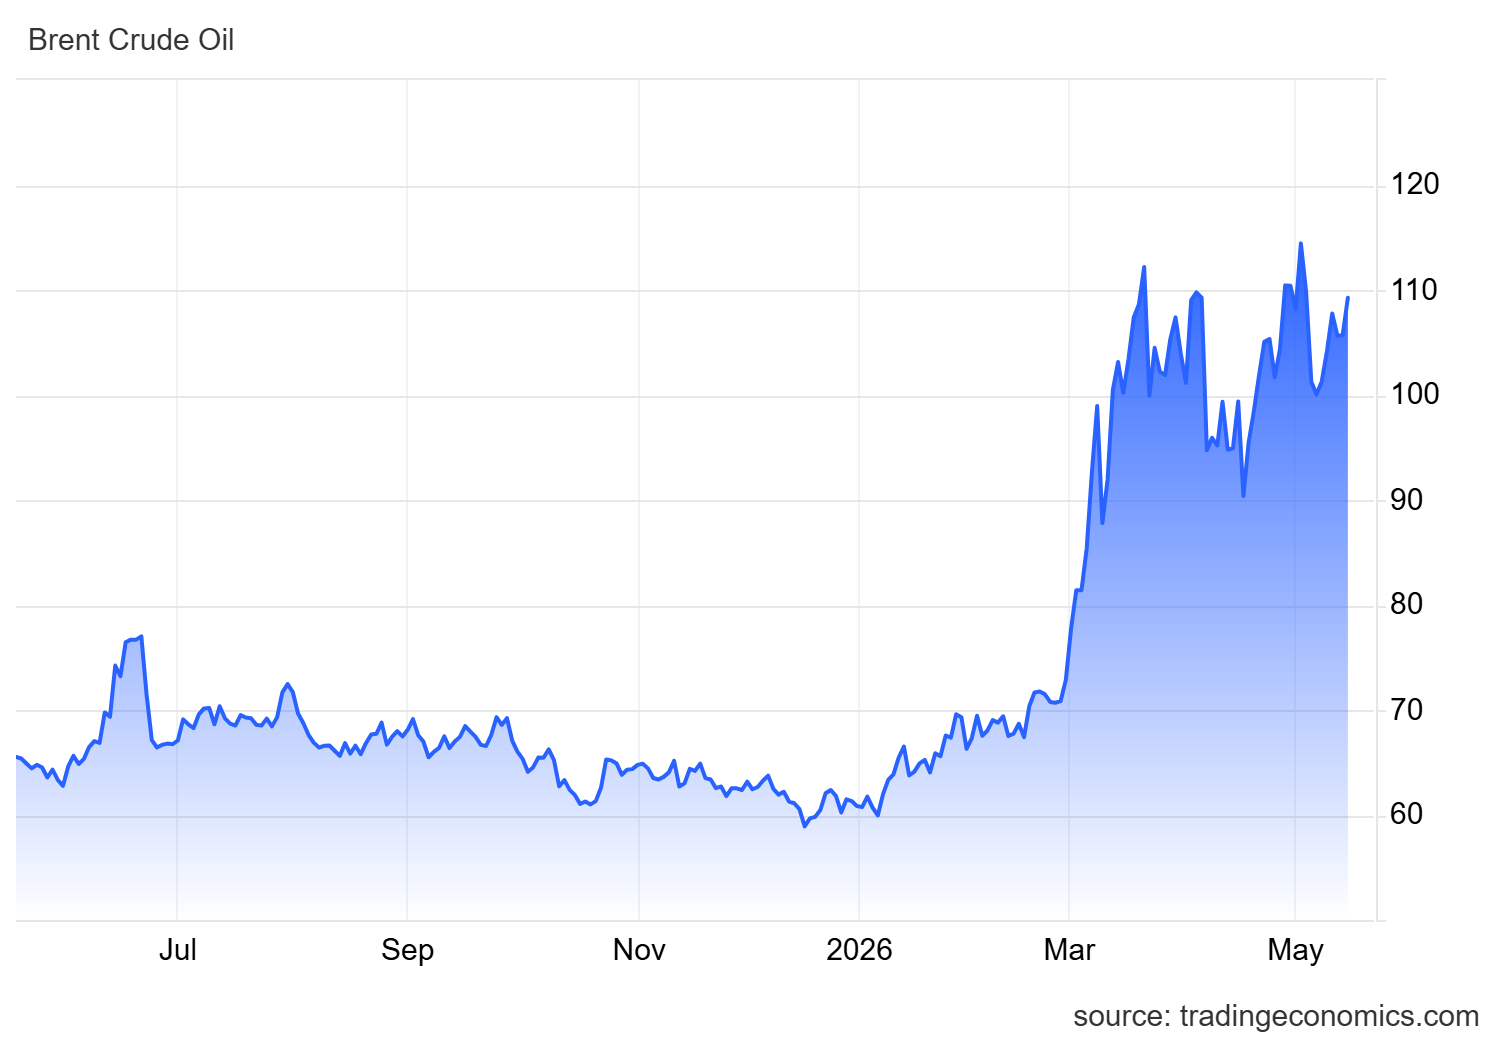
Brent up nearly 80% year-to-date is not a commodity story. It is a monetary policy story. The Hormuz disruption has taken a structural supply constraint and compounded it with a geopolitical premium that is not going away on a quarter's notice. Oil feeds into PPI, then CPI, then inflation expectations. Once expectations start drifting, the Fed loses the luxury of patience.
What oil is pricing: inflation has not been solved. It has been deferred.
S&P 500 at 7,408: The Soft Landing Is Intact
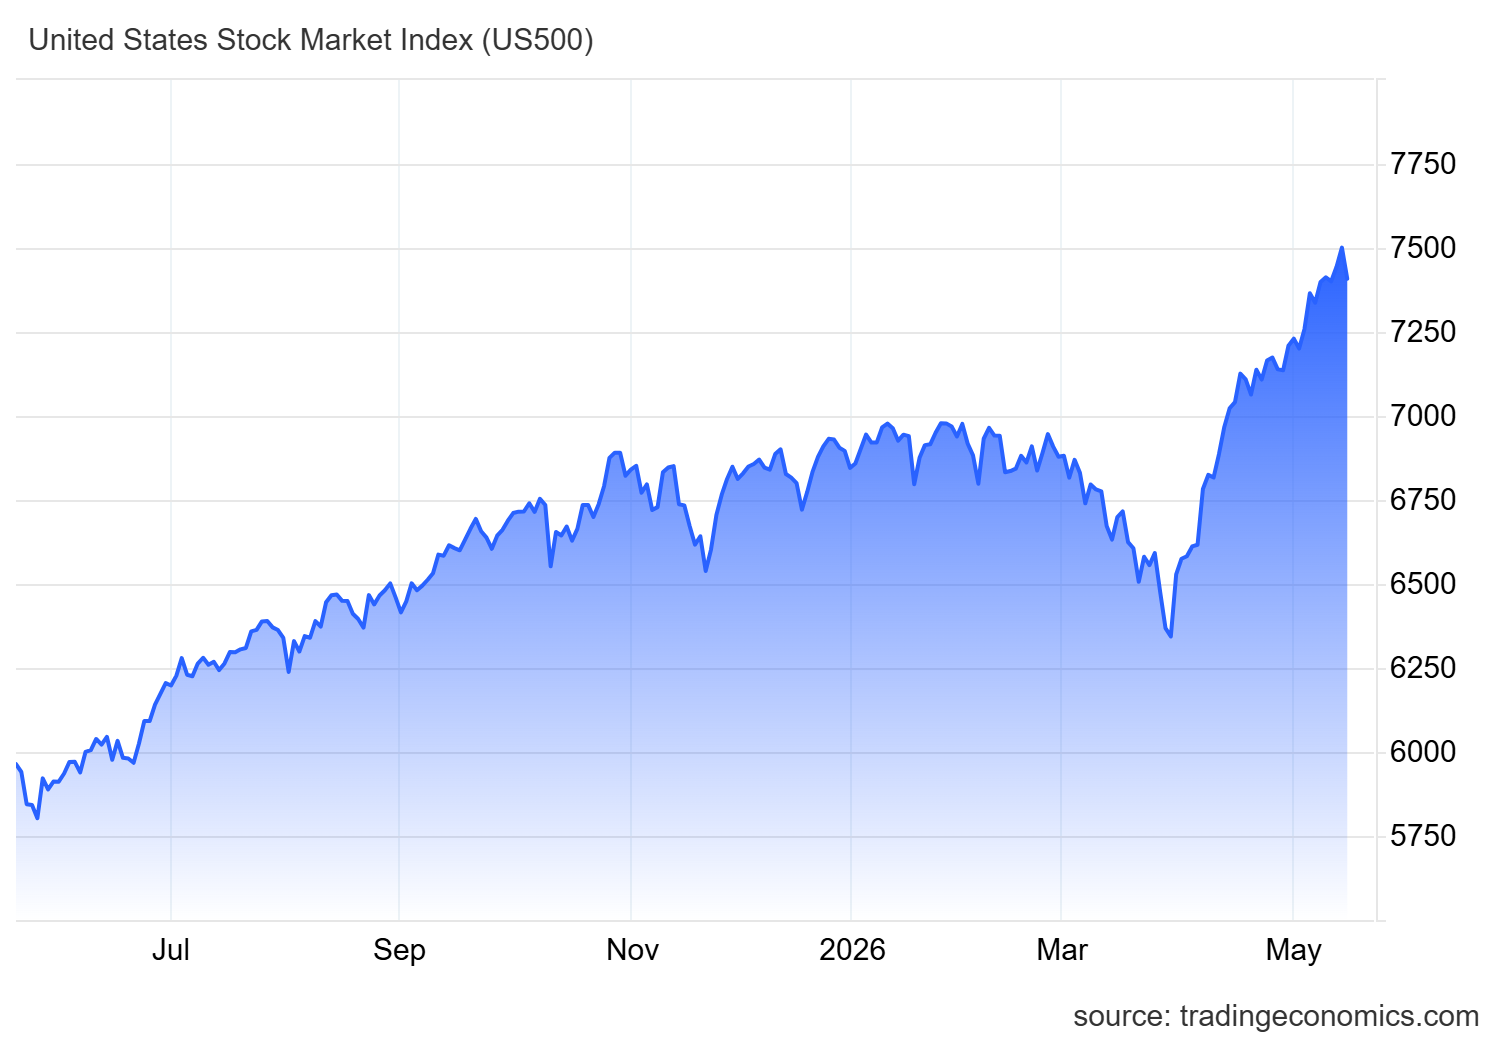
Equities at all-time highs reflect a specific macro consensus: the Fed threaded the needle, earnings growth continues, and the energy shock is a headwind rather than a regime change. The AI productivity narrative provides fundamental cover for elevated multiples. The market is not ignoring the risks. It is pricing them as manageable.
What equities are pricing: the cycle extends, corporate margins hold, and the next Fed move is a cut, not a hike.
30-Year Yield at 5.12%: The Term Premium Has Returned
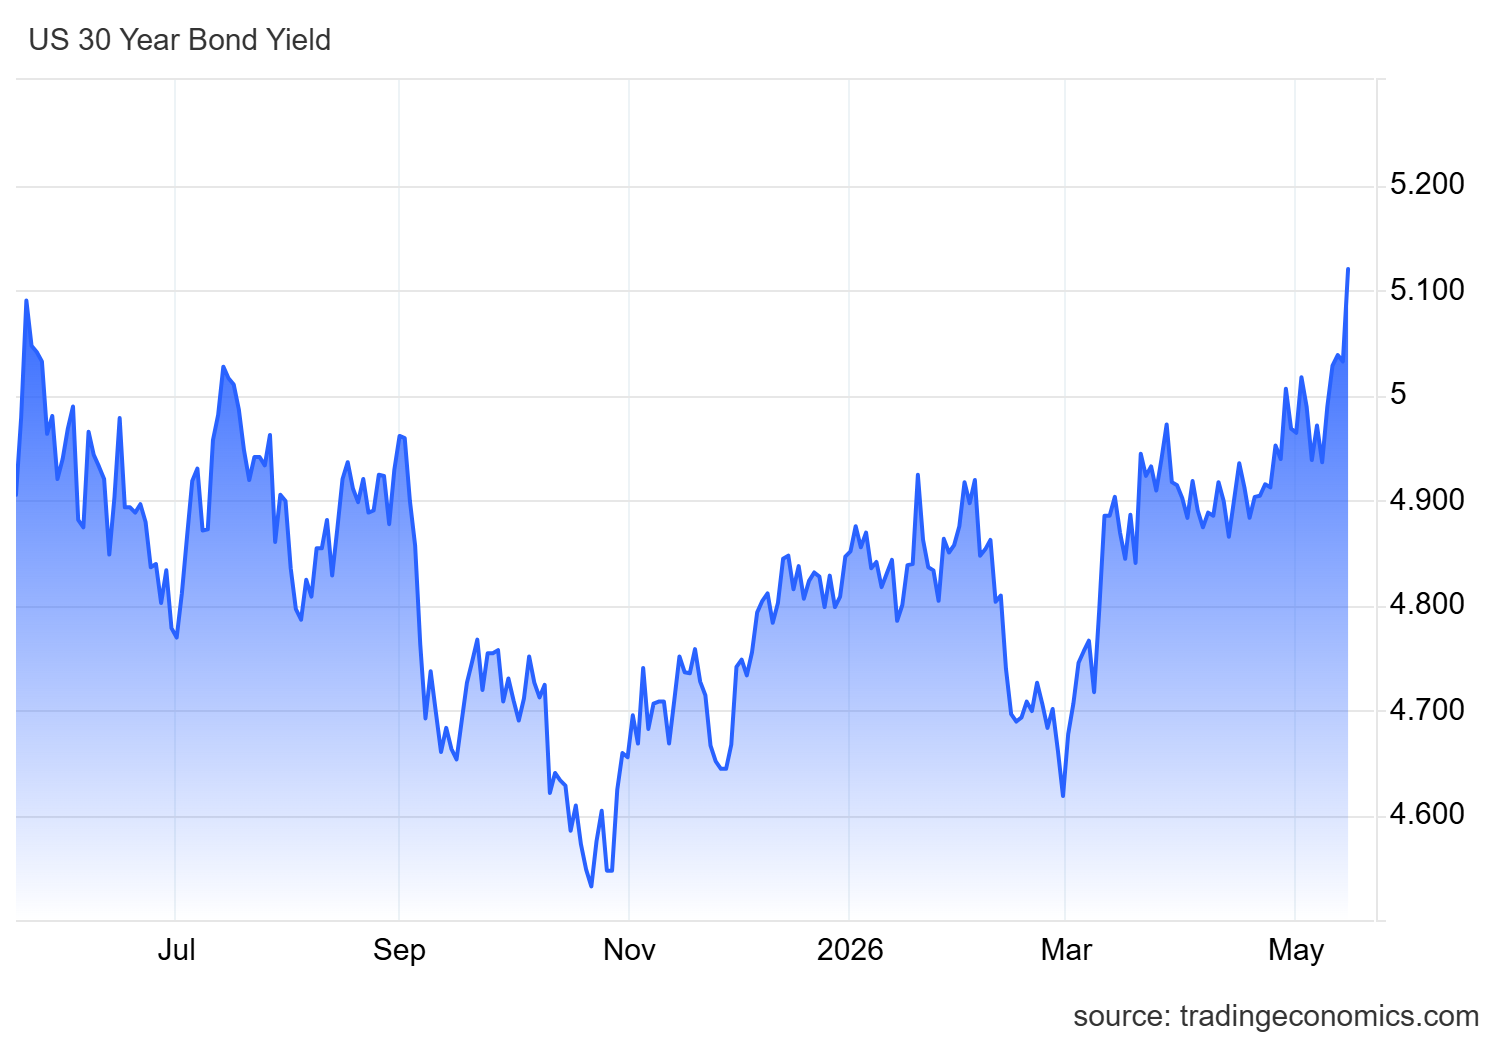
The 30-year yield is not just a rate. It is the market's aggregate judgment on inflation, fiscal trajectory, and monetary credibility over the next three decades. At 5.12%, and rising through 2026, it is signaling that bond investors are demanding meaningful compensation for duration risk. Mortgage rates, corporate credit spreads, and the discount rates used to justify equity valuations all flow directly from this number.
What bonds are pricing: the cost of capital has structurally repriced, and the Fed's room to reverse that is more limited than equities are assuming.
Why This Conflict Matters
The reason this three-way disagreement is worth paying attention to is simple: each of these markets responds to the same underlying reality. If inflation is genuinely rising again because of oil, that reality will eventually force itself on stocks. If stocks are right about a soft landing, bond yields should eventually fall. If bonds are right about higher-for-longer rates, stocks are probably priced too optimistically.
This is not an academic debate. It is a disagreement about what kind of economic regime we are living in. And the historical record suggests these disagreements get resolved, and not always gently.
Lesson One: The 1970s
The 1970s are the clearest historical example of what happens when an oil shock turns into a sustained inflation regime.
In 1973, OPEC cut off oil supplies to the West. Oil prices quadrupled almost overnight. Stocks initially did not fully price in what this meant for corporate profit margins, consumer spending, and the cost of money. Then came a severe bear market.
The second oil shock in 1979 made the picture even clearer. Inflation was no longer a temporary problem. The Federal Reserve was forced to raise interest rates to levels that seem almost unimaginable today. Borrowing costs went above 20%. The economy went into recession. Stock valuations had to be completely reset.
The lesson from the 1970s is not that oil shocks always end in catastrophe. The lesson is that when an oil shock is large enough and sustained enough to change how people and businesses think about future prices, the stock market cannot simply ignore it indefinitely.
▸ The parallel: If today's oil surge, driven partly by the Hormuz disruption, proves persistent rather than temporary, the 1970s suggest stocks are underestimating the risk.
Lesson Two: 1999 to 2000
The late 1990s were a time of extraordinary optimism in financial markets. The internet was transforming the economy. Technology companies were being valued on the assumption that they would eventually generate enormous profits, even if those profits were years or decades away.
To understand why this matters, you need to understand one concept: the discount rate. When investors try to value a company, they are essentially asking: what are the future profits of this business worth today? The answer depends critically on interest rates. When rates are low, future profits are worth a lot in today's terms. When rates are high, those same future profits are worth much less today.
In 1999, the Federal Reserve began raising interest rates. Oil had recovered strongly after a period of weakness. Long-term bond yields were rising. The Fed was responding to a strong economy and an equity market it had helped inflate through years of accommodative policy following the 1997 Asian crisis and the 1998 LTCM rescue.
But the market was already loaded. Valuations were at historic extremes. Companies without any profits were trading at billions of dollars because the story was big enough. The internet revolution. A new economic era. Future cash flows that would justify any price.
When rates rose, the math changed. The same story, told at a higher discount rate, was worth less. Not because the story was false (the internet did transform the economy), but because the price being paid for that story had assumed the Fed's easy money posture would continue indefinitely.
The Fed lit the fire. Raising rates just removed the oxygen keeping it contained.
Between early 2000 and late 2002, the S&P 500 fell by nearly 50%. The Nasdaq fell by almost 80%. The economy did not immediately collapse. There was no banking crisis. The first blow came purely from valuations adjusting to a new reality: expensive money makes expensive stocks hard to justify.
▸ The parallel: Today's market is once again pricing in a world of sustained AI-driven productivity growth. Long-duration technology and growth stocks (companies whose value depends heavily on profits expected far in the future) are most exposed if bond yields stay elevated. The story does not have to be wrong for the price to be too high.
Lesson Three: 2007 to 2008
The 2007 to 2008 crisis was different from 1999 in an important way. In 1999, the problem was primarily a valuation bubble. In 2007, the problem was structural: the entire financial system had been built on the foundation of cheap money the Fed had provided after the dot-com crash.
After cutting rates to 1% in 2003 and holding them low through 2004, the Fed created conditions in which leverage was not just accessible but rational. Banks lent aggressively, bundled mortgage debt into securities, and distributed it globally as supposedly safe assets. The system had an internal logic: as long as the cost of money stayed low, the architecture held.
When the Fed raised rates from 1% in 2004 to 5.25% in 2006 and held them there, it was tightening the conditions it had itself created. The adjustable-rate mortgage market cracked first, then mortgage-backed securities, then the banks holding them, then the global financial system. The Fed's prior accommodation had built the leverage; its subsequent tightening made the bill come due.
▸ The parallel: Today the Fed's post-COVID easing inflated a similar architecture: corporate debt at historically low rates, private credit markets built on cheap leverage, commercial real estate refinanced at 2020-2021 spreads. Higher-for-longer is now stress-testing all of it. The question is not whether weaknesses exist. The question is where they surface first.
The Fed as Architect of the Cycle
Each of these episodes follows the same structure. The Fed eases aggressively in response to a crisis or a slowdown. That easing creates the conditions for the next excess. When the excess becomes a problem, the Fed tightens. The tightening reveals what the cheap money had been financing.
In 1998 to 1999, post-LTCM accommodation fueled the final leg of the dot-com bubble. In 2002 to 2005, post-dot-com rate cuts built the mortgage complex. In 2020 to 2021, emergency pandemic easing inflated almost every asset class simultaneously. In each case the Fed was not a passive observer. It was the entity setting the price of money that made the excess possible.
Milton Friedman spent decades arguing that the Federal Reserve was the central actor in every major monetary dislocation. At his 90th birthday conference in 2002, Ben Bernanke, then a Fed governor, closed his remarks with a direct acknowledgment: "Regarding the Great Depression. You're right, we did it. We're very sorry. But thanks to you, we won't do it again." The tradition of central bank self-examination since then has not always been so candid, but the mechanism is the same.
This matters for reading the current moment. The Fed is not a neutral force that simply responds to events. It sets the price of money, and in doing so it shapes what gets built on top of that price. Today the question is what was built on top of zero rates, and how much of it survives 5%.
Right now the Fed is in observation mode. But the 30-year yield at 5.12% means financial conditions are tightening regardless. The bond market is not waiting for a policy decision. It is already repricing the cost of capital across every maturity that matters.
The tightening is already underway. The Fed just has not officially started it yet.
What Each Historical Scenario Looks Like Today
The 1999 Scenario
Stocks remain at elevated valuations. The market continues to believe in the AI productivity story. Oil and inflation do not cool down. Bond yields stay high. The Fed, worried about its credibility, decides it cannot risk allowing inflation to re-accelerate and begins to tighten again.
The first blow would not necessarily come through a banking crisis or an immediate recession. It would come through what happened in 2000: multiple compression. The same companies, the same earnings, the same stories, but valued at less because the cost of money is higher.
The most exposed would be long-duration equities: technology companies, AI beneficiaries, high-growth businesses whose value depends heavily on profits expected far in the future. Good stories, but priced for a world of cheap capital that no longer exists.
The 2007 Scenario
Here the focus shifts from equity valuations to balance sheets. The Fed holds rates higher for longer. Refinancing pressure builds across the economy. Credit spreads (the extra interest rate that risky borrowers must pay above the government rate) begin to widen, signaling that lenders are becoming nervous.
Commercial real estate, private credit markets, weaker corporate borrowers, regional banks, or consumer credit begin showing stress. The problem is not simply that stocks are expensive. The problem is that someone, somewhere, financed long-term assets assuming cheap capital would continue. When that assumption breaks, the damage spreads.
A valuation problem can produce a painful bear market. A funding problem can rewrite the rules of the entire financial system.
Why Today's Moment is Unusually Delicate
The current market is pricing in a very narrow range of outcomes. For everything to work out as stocks currently suggest, you need most of the following to be true simultaneously:
✓ Economic growth remains solid.
✓ Inflation does not re-accelerate.
✓ The oil shock proves temporary, not structural.
✓ The Fed has room to cut rates if needed.
✓ Long-term bond yields eventually come down.
✓ Corporate earnings hold up.
✓ Credit markets do not crack.
None of these individually is impossible. But needing all of them simultaneously is a very narrow path.
And the more dangerous dynamic is this: the Fed does not even need to move. With 30-year yields at 5.12% and rising, and the 10-year at 4.6%, financial conditions are tightening through the bond market itself. The term premium has repriced. Every mortgage, every corporate refinancing, every leveraged buyout is now being written at a higher base rate than the one that justified yesterday's asset prices. That math is already in motion.
In other words: the tightening is already happening. Quietly. Through the bond market.
Friday, May 16: The Bond Market Reprices
What happened in the US bond market on Friday was not a retail panic or a reaction to a single data point. It was institutional repositioning with a specific embedded logic: if you expect the next Treasury auction to clear at a higher yield than today's, the rational move is to sell now. Every basis point the market moves before the auction validates that decision. This is how bond selloffs become self-reinforcing. The sellers are not reacting to fear. They are front-running arithmetic.
The inflation data gave them the trigger. April wholesale inflation came in at its fastest pace since 2022. Consumer prices posted their largest monthly increase since 2023. Retail sales slowed. The transmission chain from the Hormuz disruption is no longer theoretical. Energy costs are now moving through PPI into CPI, and the Fed, having spent the better part of two years trying to convince markets that its credibility on inflation is intact, is now facing a situation where the bond market is openly pricing a rate hike it did not ask for and may not want.
A week earlier, markets were pricing a 37% chance of a Fed rate hike by year-end. By Friday, that number had moved to 60%, according to CME FedWatch and Reuters.
But to read this as only an American story is to miss the more important point. The 30-year yield is repricing across every major economy simultaneously. The UK is at 5.82%. Australia is above 5.50%. Japan's 30-year government bond, which would have been at essentially zero just a few years ago, is now at 4.00%, its highest level since 1999, having moved more than 100 basis points in a single year. Germany is at 3.68%. France at 4.65%, uncomfortably close to Italy at 4.75%, a spread compression that historically signals markets becoming less patient with fiscal credibility inside the eurozone.
This global synchronization matters because it removes the escape route. When only US yields are elevated, capital can rotate. When every major sovereign bond market is repricing simultaneously, the question is no longer where to hide. It is what the new equilibrium cost of capital looks like, and whether the asset prices built on the old one can survive the transition.
Japan deserves particular attention. Japanese institutional investors, pension funds and life insurers, have been among the largest structural buyers of US Treasuries and European long-duration paper for years, precisely because domestic yields offered nothing. At 4% on a 30-year JGB, that calculus is changing. Repatriation flows are not a one-day event, but the incentive structure has shifted, and when it fully materializes it adds selling pressure to the very markets that are already under stress.
The yield on the 30-year US bond jumped nearly 11 basis points in the session to 5.121%. The 10-year surged nearly 14 basis points to 4.595%. Even the 2-year rose 9 basis points to 4.079%. Across the entire curve, in a single day, on top of a global move that has been building for months.
Kevin Warsh was confirmed as Federal Reserve Chair on Wednesday, May 14. His first full week in the role opened with a bond market that had already made up its mind. The market is not testing whether Warsh will be hawkish. It is pricing the possibility that he will have no choice.
One fixed income strategist quoted on Friday put it plainly: yields across the curve are now in control of monetary policy. The Fed does not need to act. The bond market is doing the work.
The Fed does not control any of this. It can set the overnight rate. It cannot set the price the global bond market demands to hold sovereign debt for three decades.
Conclusion
Friday gave us a partial answer.
The bond market did not wait for a recession, a credit accident, or a Fed announcement. It repriced because the people managing the largest pools of capital in the world looked at the same three charts, ran the same arithmetic, and concluded that the era of cheap money is not returning on any timeline that matters for current valuations.
Stocks have not moved to reflect that. Oil has not retreated. The divergence is still open.
History does not repeat precisely. But the structure of what we are watching, an asset class built on a specific cost-of-capital assumption, operating in an environment where that assumption is being openly challenged by every other major market, has resolved the same way across 1973, 2000, and 2008. Not always immediately. Not always dramatically at first. But always in the same direction.
The question is no longer really which market is wrong. The question is how long equities can hold a consensus that the bond market, the oil market, and now the global sovereign debt complex have already abandoned.
Liquidity Desk
This article is for informational and educational purposes only. Nothing here constitutes financial advice or a recommendation to buy or sell any security. Always do your own research.
Member discussion