Commodity Snapshot | May 2026

1. The American Energy Position
Europe entered the Hormuz shock as a vulnerable importer. The United States entered it as something more complex and more contradictory: simultaneously a belligerent power, the world's largest oil producer, and a society in which the price of gasoline functions as a direct political thermometer.
This triple role creates a dynamic that has no equivalent in the European analysis from April. In Europe, governments watched the shock transmit through the economy and asked how to soften its impact. In America, the government is simultaneously the cause of the shock, the instrument of its management, and the political victim of its consequences.
WTI crude oil stands at $102.41 at the time of writing, up 60.88% over the past twelve months. Brent is at $108.02, up 62.21%. These numbers look familiar after the European analysis. The difference lies in what they mean for the two continents. In Europe, oil is an import paid in dollars, and the price increase directly worsens the trade balance and compresses household incomes. In the United States, higher oil prices are simultaneously a cost for consumers and a revenue stream for the production sector. Texas and North Dakota profit from the same price that hurts drivers in Ohio.
The consumer signal is clear and politically painful. Gasoline at the pump is $3.70 per gallon, up nearly 71% over the past year. Diesel exceeds $4 per gallon nationally. Historically, $4 gasoline is the threshold at which American voters stop thinking about geopolitics and start thinking about the economy. Analyst Jorge Montepeque of Onyx Capital Group put it directly: "Gasoline over $4 is a political killer."
This is where the Strategic Petroleum Reserve enters the picture. The SPR stood at 392,700 thousand barrels as of May 1, down roughly 20 million barrels over eight weeks of releases in response to the crisis. The reserve sits at 54% of its maximum capacity and approximately 182 million barrels below the long-term historical average. The Biden administration drew down a large portion of the reserve in 2022 following the Russian invasion of Ukraine. It was never fully replenished. The United States is entering the most severe energy shock since 1973 with a buffer significantly smaller than in any previous crisis.
Domestic production exists as a partial offset, but has physical limits. US crude oil production stands at 13,626 thousand barrels per day. The shale industry can increase output at $90 WTI, but not instantaneously: the typical lead time from drilling decision to first delivery is three to six months. The market is losing roughly 100 million barrels per week due to the Hormuz blockade, according to Saudi Aramco CEO Amin Nasser. American production growth cannot compensate for that gap in the short term.
One number in the dashboard stands sharply apart from everything else: Henry Hub natural gas is at $2.84, down 22.24% over the past year. In Europe, TTF is up 92%. Henry Hub is a structurally isolated domestic market: American shale gas cannot easily leave the country without LNG terminals, and existing terminals are operating near full capacity. American households are paying far more for gasoline and diesel, but their gas bills have not risen. Exactly the opposite of Europe.
The April CPI, released today, confirmed this asymmetry with data: energy inflation jumped to 17.90% year-on-year, while the overall headline came in at 3.80%. Energy is the driver, not the broad economy.
2. The US Commodity Dashboard
The table below covers the key instruments for US commodity analysis, measured over a twelve-month period. All data as of May 12, 2026.
Three things stand out immediately from this dashboard. The first is the divergence within the energy sector: Heating Oil +91%, RBOB Gasoline +71%, WTI +61%, but Henry Hub natural gas -22%. Liquid fuels are globally linked to Brent and track the Hormuz shock directly. Henry Hub is a structurally closed domestic market. CPI Transportation rose to 291.75 from 283.43, confirming that the diesel channel is already visible in official data.
The second is the Urea signal. Fertilizers are up only 14.30% over the year, which looks modest against the energy backdrop. But behind that annual figure is an important shift: Urea peaked near $750 per ton in March and has since fallen roughly 27% to $547.50. In a single month the decline was 21.93%, breaking through the $580 level identified in the March European analysis as a warning signal for demand destruction.
The third is CBOT Wheat at $667, up 21.75%. American wheat has responded faster than European wheat did in March. The USDA revised its 2026-2027 wheat production estimate downward by 424 million bushels, and only 28% of winter wheat in the Great Plains is rated good or excellent, the weakest reading since 2022.
3. The Transmission Chain
In the March European analysis, the central question was: when will the energy shock transmit into food prices? In the American context the question is different. The transmission is already happening, but the mechanisms are different, the political sensitivity is higher, and there is one channel that Europe does not have at all: biofuels.
Channel 1: WTI / Gasoline - Consumer Confidence - Political Ceiling
Gasoline at the American pump is not merely fuel. It is a daily psychological indicator of household economic health. The European driver has grown accustomed to $7 to $8 per gallon because the tax component has historically absorbed volatility and kept prices stably high. The American driver is accustomed to $2.50 to $3.50 as a normal range. Any move above $4 registers as a crisis.
RBOB Gasoline is at $3.71 per gallon, up 71% over the past year. Unlike Europe, where the tax buffer absorbs roughly 45% of wholesale movements, the US federal fuel tax is only $0.184 per gallon, fixed in 1993 and never indexed to inflation. Almost the entire wholesale movement passes directly into the retail price. When RBOB moves by $1.50, the consumer feels nearly the full $1.50 at the pump.
Channel 2: Heating Oil / Diesel - Logistics - Broad Inflation
Heating Oil at $4.17 per gallon, up 91% over the past year, is perhaps the most underappreciated inflationary channel at the moment. Approximately 70% of all goods in the United States are transported by truck. Every truck runs on diesel. When diesel rises 90%, transportation costs for everything from groceries to building materials to medical supplies increase directly.
The lag from wholesale movement to retail manifestation is six to ten weeks. Heating Oil spiked sharply in March. June and July will be the months in which this inflation enters CPI data fully. The April CPI shows the process has already begun: Services Inflation accelerated to 3.40% from 3.10%, and Core CPI MoM jumped to 0.40% from 0.20%, beating consensus. The transportation component is one of the key drivers of this acceleration. Baltic Dry Index at 3,063 points, up 139.30% over the year, confirms that the transport channel is fully active globally, not just domestically.
Channel 3: Natural Gas / Urea - US Agriculture - CBOT Grains
Henry Hub is at $2.84, down 22% over the year. In theory, American fertilizer producers carry lower production costs than their European competitors. In practice, Urea is a global market: Urea produced with cheap American gas is sold at world prices, because the alternative is export. The American farmer pays world market prices, not production cost.
Urea is at $547.50, down 22% in a single month from a peak of roughly $750 in March. Historically, Urea does not fall because production grows. It falls because demand contracts. Farmers reduce fertilizer application rates when margins are compressed by energy costs. Less fertilizer means lower yields on a three to six month lag.
CBOT Wheat is already reflecting this. Corn at $465.73, up only 5.20%, appears to be lagging, but a specifically American buffer is at work: the EPA finalized record Renewable Fuel Standard mandates for 2026-2027, maintaining a 15 billion gallon ethanol obligation. Approximately 40% of American corn goes to ethanol production. When gasoline is expensive, biofuels become relatively more competitive, supporting corn demand from the biofuel sector and preventing a sharper price decline. Soybeans follow the same logic through biodiesel mandates.
The biofuel channel is a structurally American phenomenon. It directly links the oil price to corn and soybean prices in a way that does not exist in the European analysis. When oil is expensive, biofuel mandates are easier to fulfill, demand for grain from energy producers stays firm, and the agricultural market receives a floor it would not otherwise have.
4. The Political Ceiling
There is something structurally unique about the American oil market right now that does not exist anywhere else in the world. The largest military power on the planet, which launched the war that caused the shock, is simultaneously obliged to manage the price of fuel for its voters. This contradiction cannot be resolved. It can only be managed, and the way it is managed distorts market signals in ways every investor needs to understand.
The pattern is documented and repeatable. Trump intensifies military rhetoric on weekends, when markets are closed. When WTI approaches $95 to $100 during the trading week and retail gasoline approaches $4 per gallon in key electoral states, de-escalatory signals appear: hints at negotiations, reports of Iranian willingness for peace, statements about the ceasefire being on "massive life support." The market moves lower. Political pressure eases. Then the cycle repeats.
This is not conspiracy. It is a rational political response to a real problem. But for market participants it creates a specific environment: the spot price reflects not only fundamentals but also political noise. The true market expectations for future oil prices are better read from the forward curve than from daily spot movements. In early May, WTI for June 2026 traded around $97, July around $89, August around $83, and December around $72. The market does not believe that $100+ oil is a permanent new level. It is pricing a gradual normalization contingent on eventual conflict resolution.
The SPR stands at 392,700 thousand barrels, having released roughly 20 million barrels in eight weeks. At current production of around 13,600 thousand barrels per day, the reserve covers approximately 29 days of domestic production. The historical norm is around 53 days. The space for further aggressive releases is limited, and each successive announcement carries diminishing price impact as the market has already priced expected releases.
One senior energy trader, quoted by the Financial Times, noted that prices should be higher given the scale of the physical disruption, but that not many people are brave enough to trade against Trump's interventions. The result is artificially suppressed volatility in the short term and accumulated unrealized price risk in the medium term.
Today's April CPI reading of 3.80%, beating consensus, further complicates the White House position. Energy inflation of 17.90% is visible in official data. The argument for "temporary short-term disruptions" becomes harder to sustain with each successive monthly release.
The political ceiling is real, but it is not unlimited. It works while the SPR retains capacity, while verbal interventions carry effect, and while the electoral calendar provides the incentive. After November 2026, at least one of those three factors will have changed.
5. CRB in Historical Context
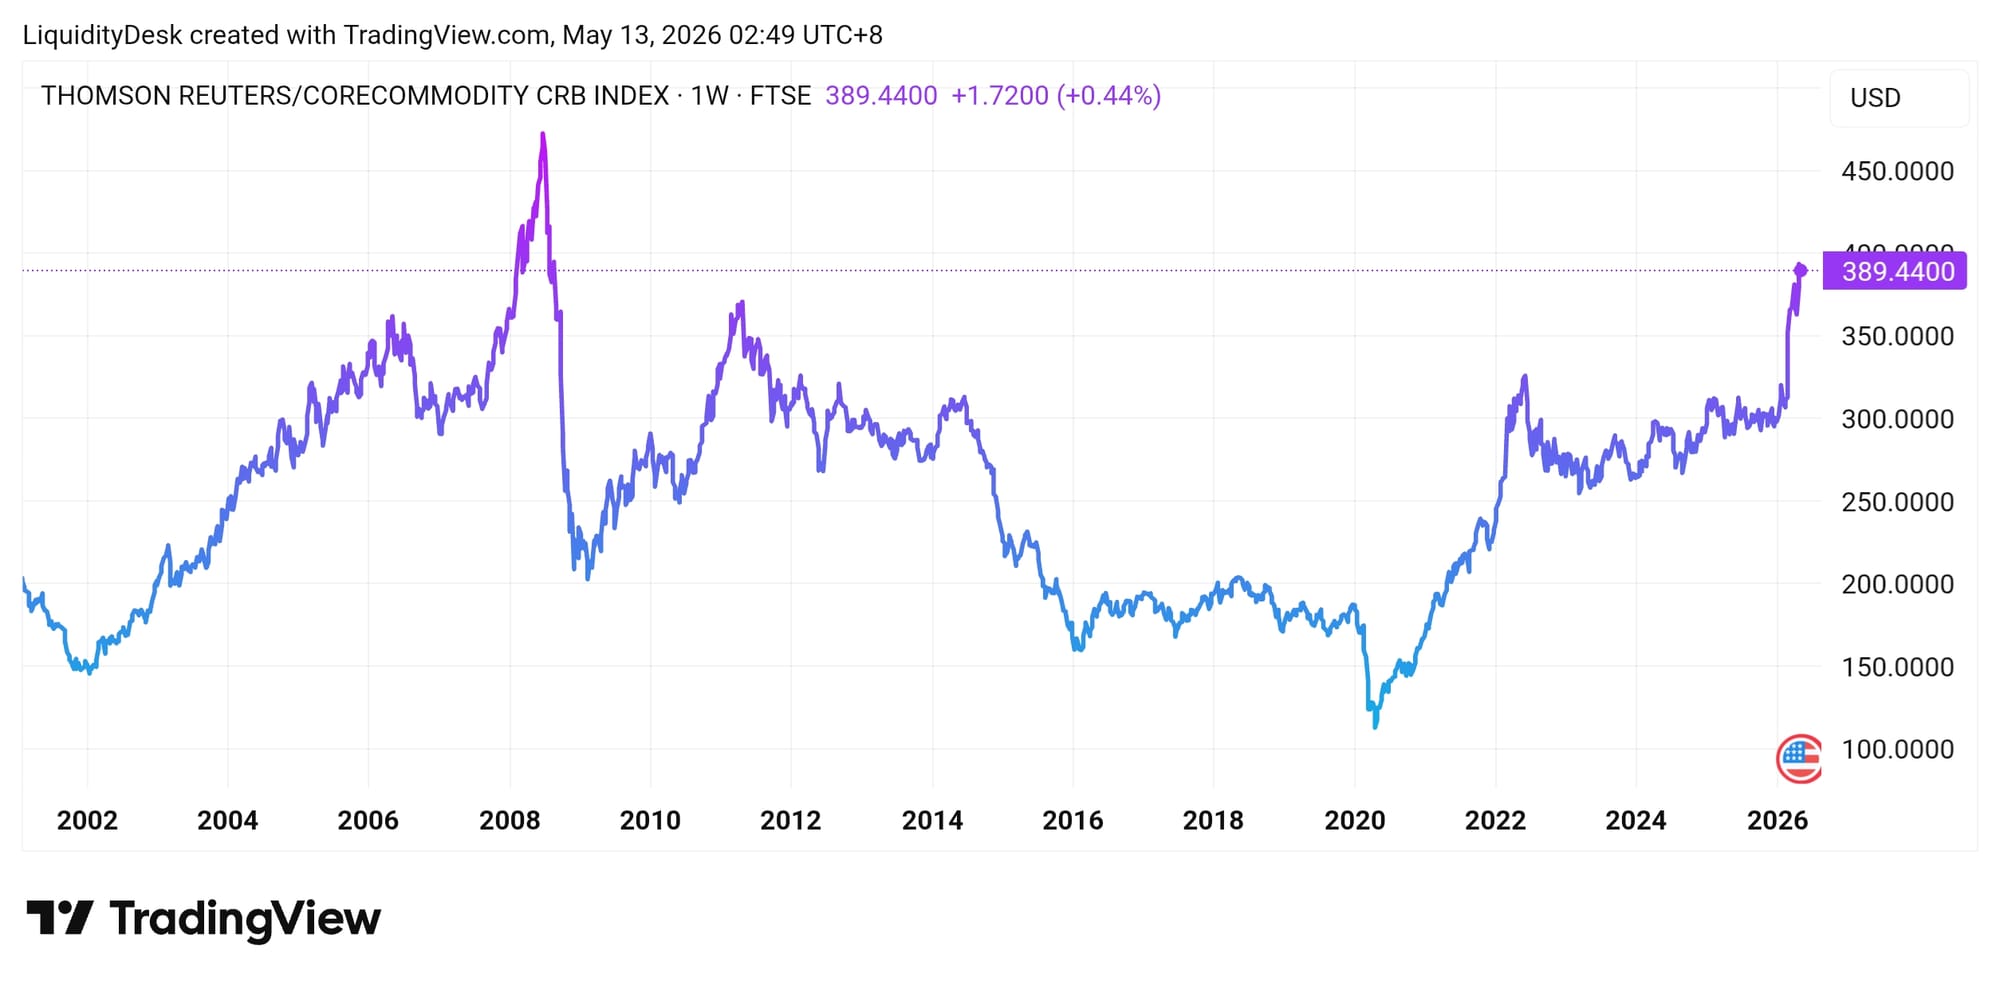
The TradingView chart needs few words of explanation. From the COVID pandemic low in March 2020 near 115 points, the CRB Index has risen to 389 points at the time of writing under the FTSE methodology. The TradingEconomics version with its broader 19-commodity basket shows 507 points. Two methodologies, different baskets, different numbers, but one message: commodity markets are at levels not seen since before the 2008 financial crisis.
The 2008 Peak: Liquidity as Fuel
CRB reached its historical maximum near 470 points in mid-2008. The driving force was a combination of a global demand boom led by Chinese industrialization and unprecedented liquidity expansion following the dot-com crisis and September 11. Oil reached $147 per barrel. The resolution came suddenly and brutally: Lehman Brothers collapsed in September 2008, global credit froze, and CRB fell from 470 to below 200 in less than six months. At 3.80% inflation today we are still well below the 5.60% peak of that episode, but the trajectory is upward and the May CPI is expected to accelerate further.
The 2011-2012 Peak: Arab Spring and QE
After the financial crisis the Federal Reserve injected unprecedented liquidity through QE1 and QE2. CRB recovered to around 370 points by 2011. The Arab Spring added a geopolitical premium to oil. But Chinese growth was already slowing, and global industrial demand was not strong enough to sustain the levels. CRB gradually declined from 2012 to 2016, when the American shale revolution flooded the market with oil and broke OPEC pricing discipline.
The 2022 Peak: Inflation's Return
The Russian invasion of Ukraine added a geopolitical shock to already stretched post-COVID supply chains. CRB reached around 330 points. The Federal Reserve responded with the most aggressive rate hiking cycle since 1980. Demand destruction followed, and CRB returned to 270 to 280 by end of 2022.
2026: Different in Nature
The current move is structurally different from the previous three peaks in one important respect. In 2008, 2011, and 2022, the commodity rally was at least partly demand-driven: real or anticipated demand was growing and pulling prices higher. In 2026 the move is almost entirely a supply shock: demand has not surged; supply has been forcibly removed from the market. Roughly 100 million barrels per week are blocked at the Strait of Hormuz. Ras Laffan is operating at reduced LNG capacity for three to five years.
The distinction matters for forecasting the resolution. Demand-driven peaks end when liquidity contracts or growth slows. Supply-driven peaks end when supply is restored, or when demand destruction from the high prices themselves becomes large enough. With a geopolitically-sourced supply shock, neither the Federal Reserve nor the ECB can solve the problem with interest rate tools. The only mechanism that normalizes prices is the physical reopening of the Strait of Hormuz.
Baltic Dry Index at 3,063 points, up 139% over the year, provides the final piece of this picture. When physical shipping costs rise 139%, the market is not signaling financial speculation. It is signaling real physical inaccessibility of commodities and products. Ships cannot pass. Goods are not arriving. Prices reflect reality, not sentiment.
6. What We Are Watching: June Signposts
Five sections above described the situation. This section answers the practical question: what exactly needs to happen over the next four weeks for us to know which scenario is playing out?
Confirming Signals (Scenario A: Transmission Continues)
CBOT Wheat above $700 per bushel would confirm that agricultural markets have fully absorbed the energy and fertilizer shock into their pricing. The current level of $667 is already significantly above year-ago levels, but the USDA downward revision and deteriorating winter wheat conditions in the Great Plains provide grounds for further upside.
CBOT Corn above $500 per bushel would signal that the biofuel buffer is insufficient to offset pressure from compressed yields and higher input costs. Corn is the instrument that lags the energy shock most visibly in the current data.
Heating Oil holding above $4.00 per gallon would confirm that the distillate shock is structural rather than temporary. If it remains at these levels through the end of May, the logistical inflation will enter June CPI data fully.
Urea stabilizing above $520 per ton would indicate that demand destruction in the fertilizer market has reached a floor and farmers have adapted to the new cost level. Continued decline below $500 would signal a deeper contraction in fertilizer application and potentially lower yields for the 2026 harvest.
Warning Signals (Scenario B: De-escalation or Demand Destruction)
WTI falling below $85 per barrel would signal either a genuine geopolitical resolution with physical reopening of Hormuz, or sufficient demand destruction from the broader global economy. Geopolitical resolution would be bearish for grain via lower input costs. A recessionary demand collapse would be bearish for everything simultaneously.
Urea falling below $480 per ton would confirm deep and prolonged demand destruction in the fertilizer market. The peak was around $750. $480 would represent a 36% decline, historically associated with subsequent contraction in grain production over the following two to three seasons.
April CPI came in today at 3.80% year-on-year, beating the 3.70% consensus and accelerating from 3.30% in March. Energy inflation jumped from 12.50% to 17.90% in a single month. But this is only the opening move: April data reflects partial Hormuz shock exposure. The May CPI, published in June, will be the first complete reading with the shock fully inside the basket. Consensus expects 3.80% to 3.90%, but 79.7% of market participants are positioned for an upside surprise. Core CPI accelerated to 0.40% MoM, the strongest reading in over a year, signaling that energy inflation is already spreading into the broader economy. If the May CPI comes in above 4.20%, the Federal Reserve will face a situation in which neither raising nor holding rates resolves the underlying problem.
A ceasefire with physical reopening of the Strait of Hormuz, confirmed by independent maritime sources, would be the single most powerful signal in this table. Brent falling 15% in one day at such an event is a realistic scenario, repeating the move of April 17 when Iran announced a temporary opening and Brent fell 10.7% in a single session.
Scenario Framework
The base case for June remains Scenario A. The physical closure of Hormuz continues. The SPR buffer is shrinking. Fertilizer demand destruction is already in the data, but its consequences for yields will only appear at harvest. The political ceiling is working with limited instruments and approaching elections. The only thing that can change this picture quickly is a diplomatic event. And diplomatic events, by definition, do not come with advance notice.
Disclaimer: This publication is for informational and educational purposes only. Nothing herein constitutes investment advice or a solicitation to buy or sell any financial instrument. Past performance is not indicative of future results. Always conduct your own research before making any investment decision.
Member discussion