

Frame
This is our second quarterly Macro Pulse for China. All the main data for July, August and September are now out, including the breakdown of growth by source that the National Bureau of Statistics released in its database. The last release included is October inflation, published on 9 November. October trade and industrial output come out after our cut-off and are left for the next issue.
Where the economy stands
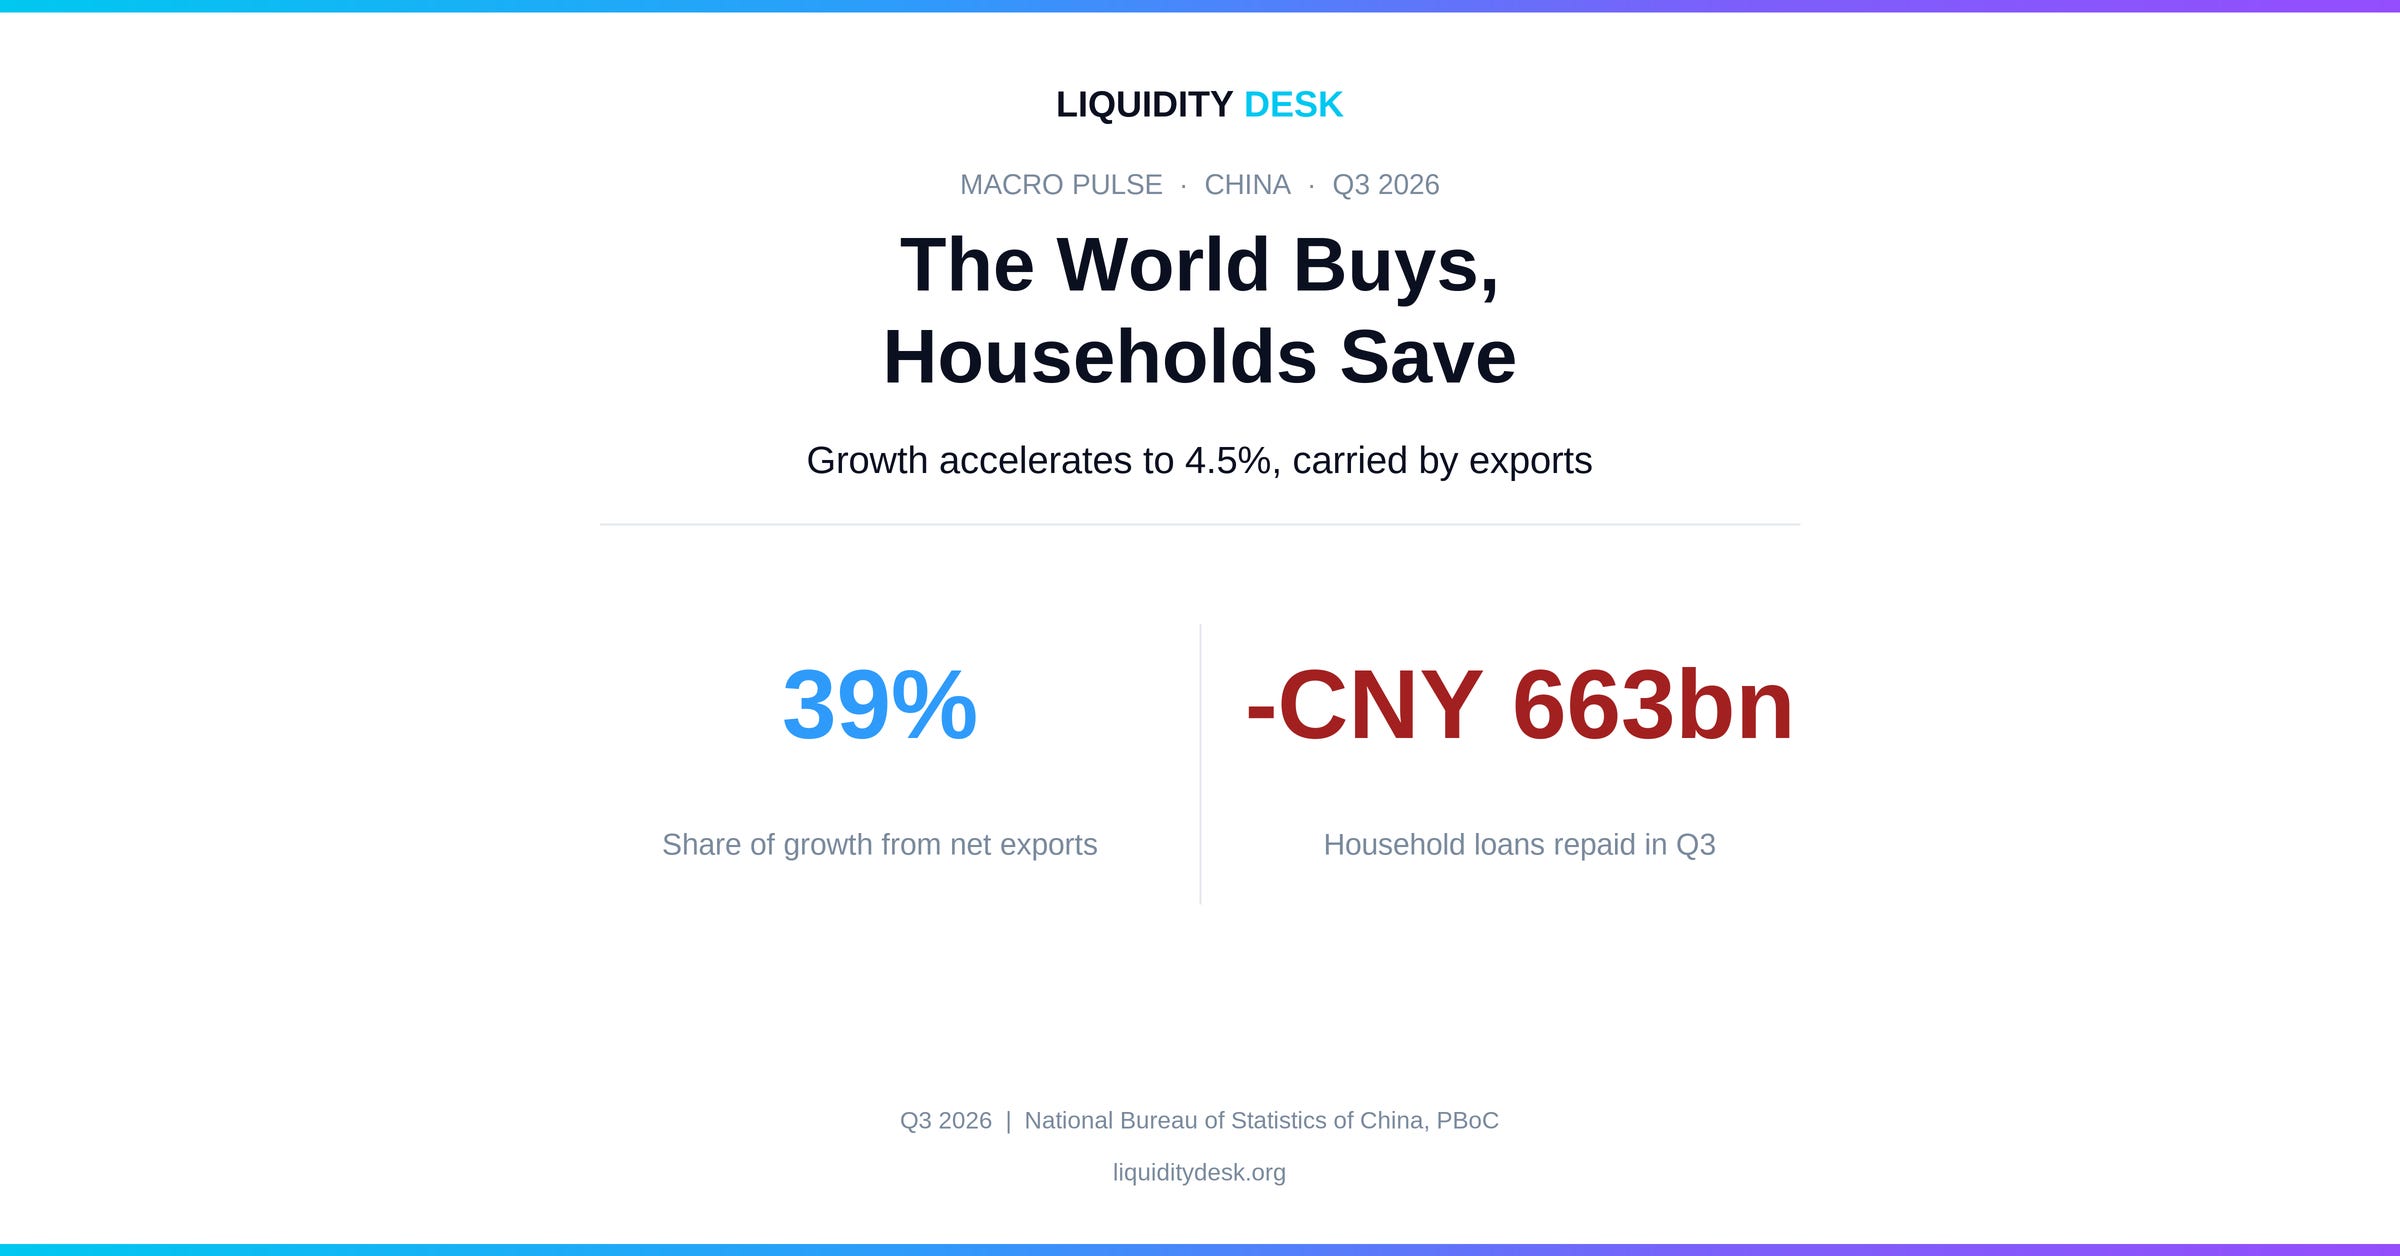
The phase changes from growth with slowing momentum to acceleration. Real GDP grew 4.5% from a year earlier and 1.2% on the second quarter after seasonal adjustment. Three months earlier the rates were 4.3% and 0.9%. Industrial production accelerated in every month of the quarter: 4.5%, 5.2%, 5.5%. In September the official composite PMI was 50.7 and new manufacturing orders 50.5. That is the threshold we set ourselves in August. The PMI is a survey of purchasing managers; a reading above 50 means more firms report improvement than deterioration. The acceleration is real, but narrow. It comes almost entirely from abroad.
The engine is the rest of the world. Net exports, that is exports minus imports, carried 39.3% of growth in Q3, almost twice the 20.8% of Q2. Dollar exports were 28.4% higher than a year earlier. In July and August, however, most of that increase was price, not more goods.
The brake is households, and it is structural. Investment, which carried a third of growth in Q2, now carries an eighth. Households repaid CNY 663bn more in loans than they borrowed, the same as in Q2. Over nine months private investment is 10.4% lower and property investment 20.6% lower.
Consumer inflation is coming down again, to an average of 0.7% from 1.1%. Growth is strengthening while inflation eases. For the People’s Bank of China, the PBoC, that is a comfortable position: it can wait. And that is exactly what it is doing. The policy rate does not move, easing remains targeted, and in early November the bank even slowed the rise of the yuan.
In October, however, the official manufacturing PMI fell back to 49.3, which raises the question this article cannot fully answer: was September a new rhythm?
Core indicators
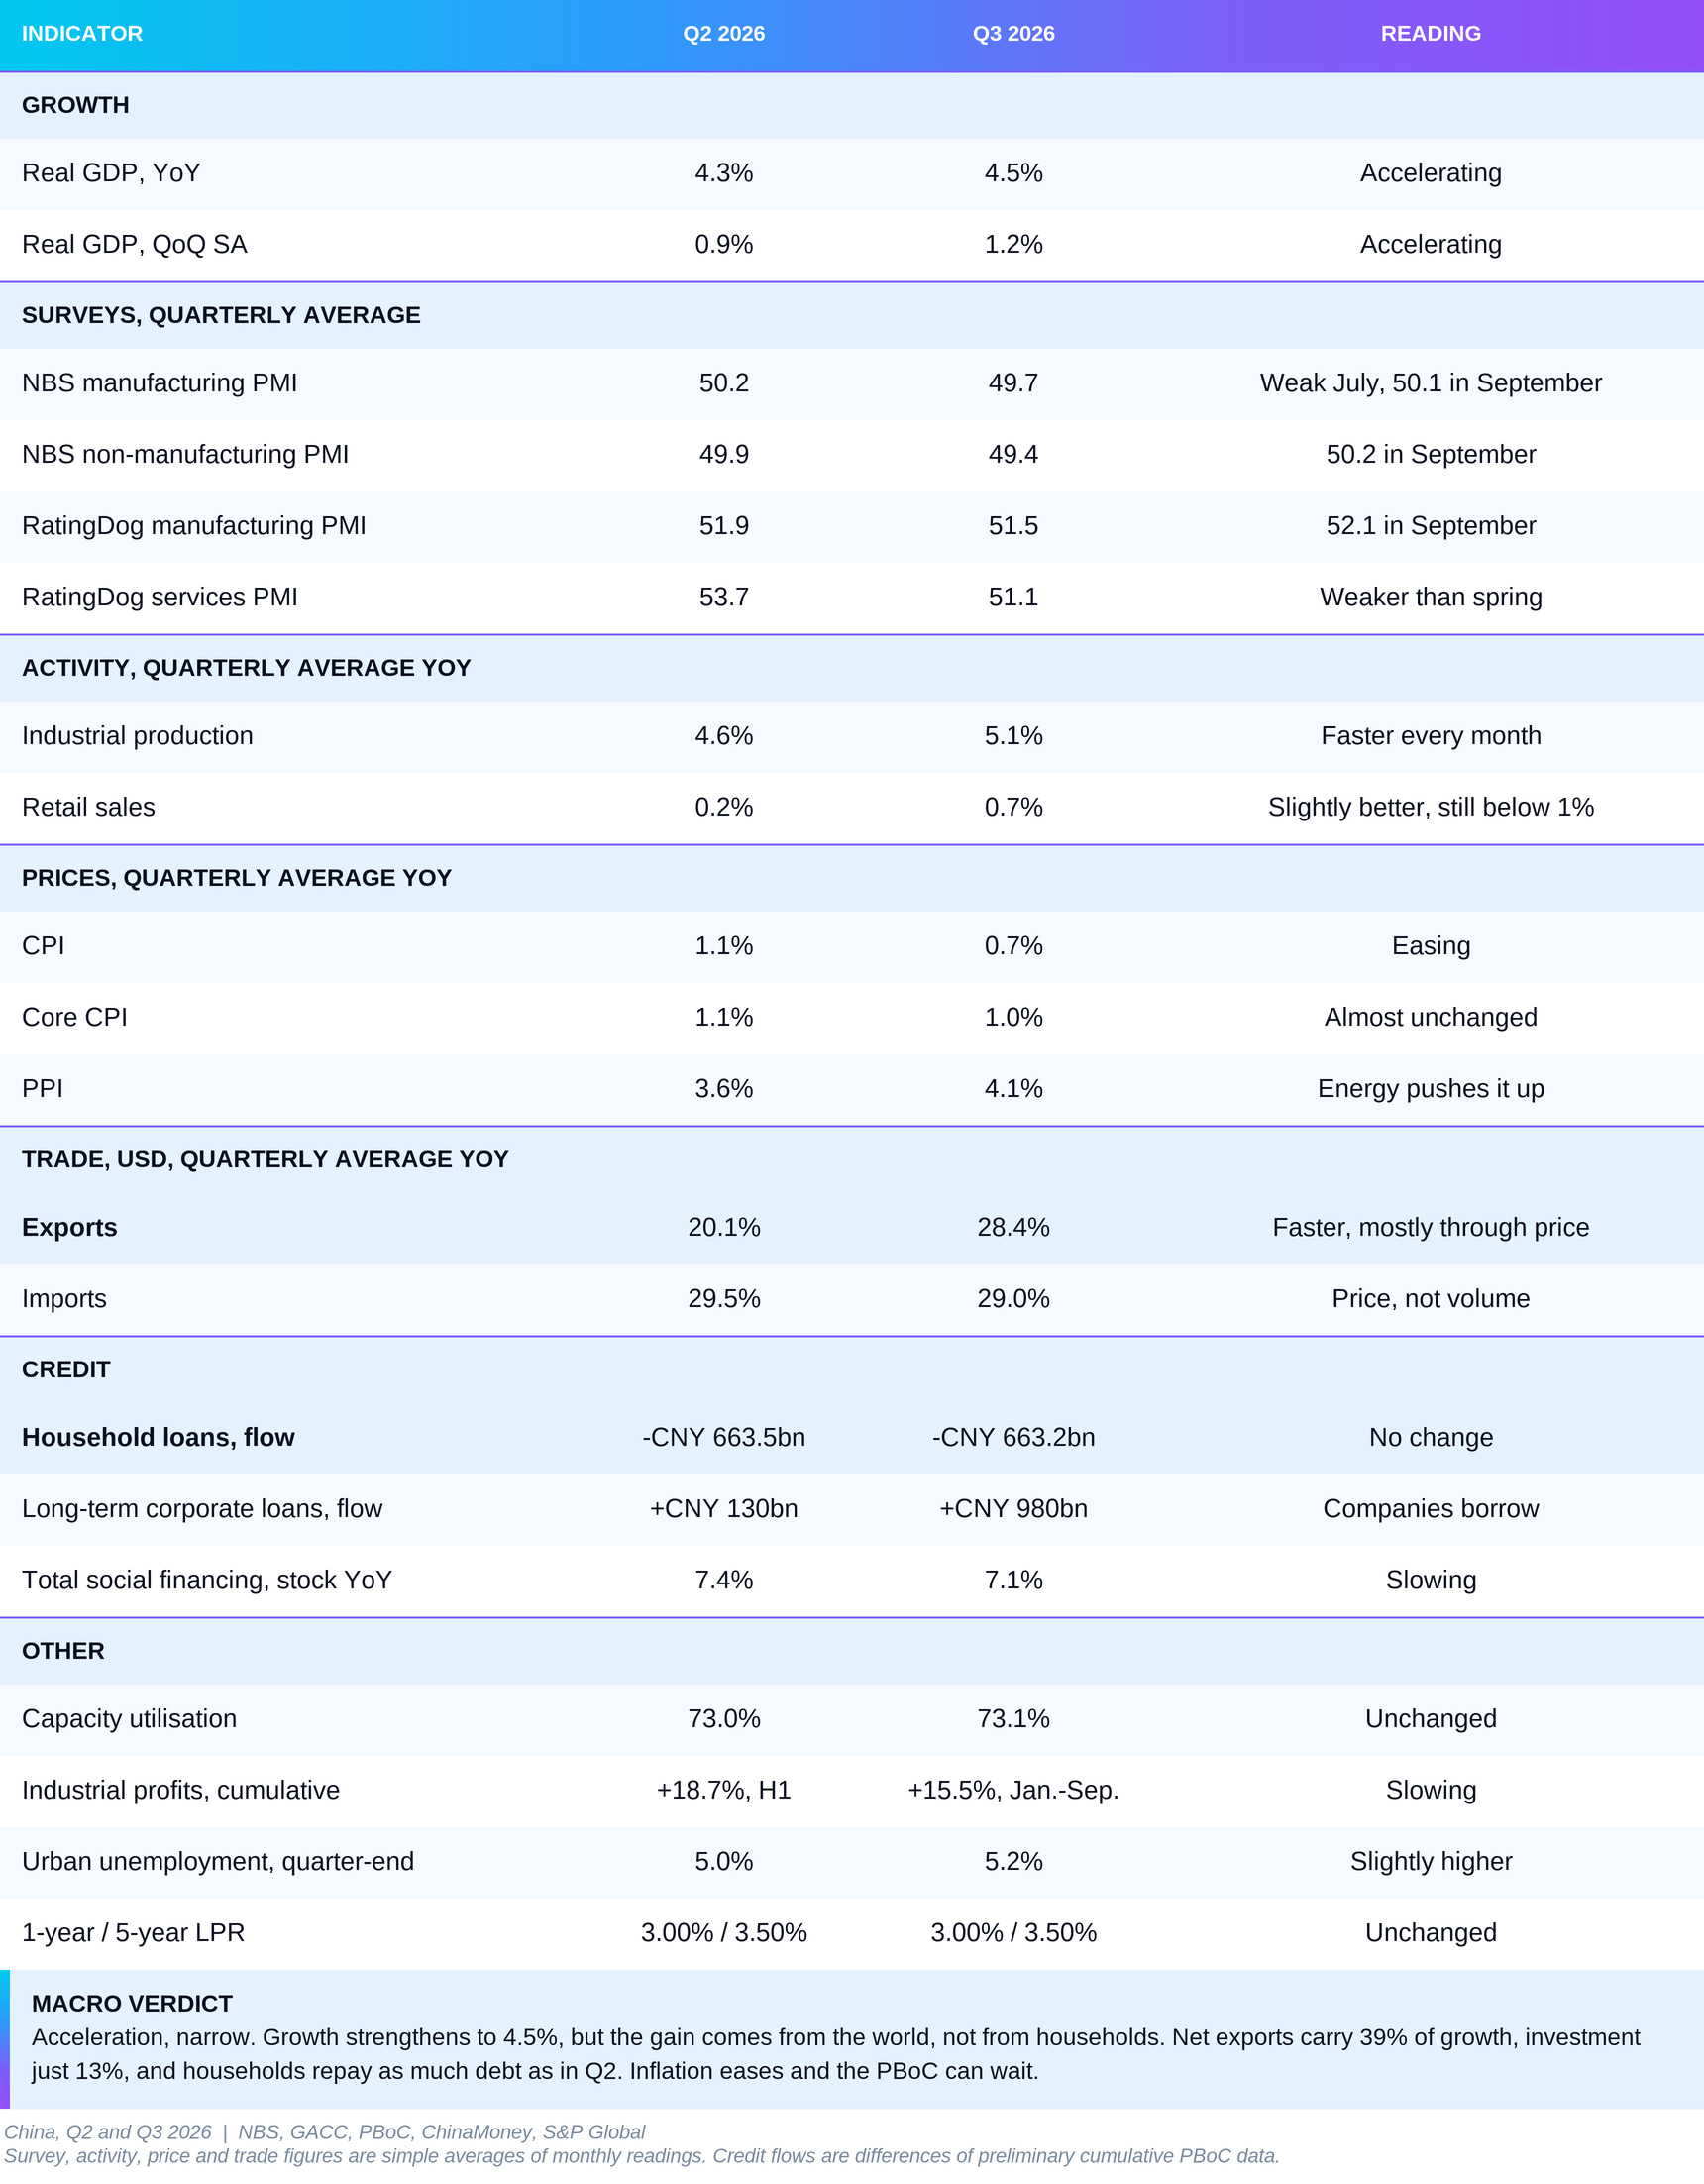
NBS and RatingDog are two different surveys. NBS covers more large and state-owned enterprises, RatingDog more private and export-oriented firms. The two are therefore not compared directly, and the gap between them is often the news.
The trajectory
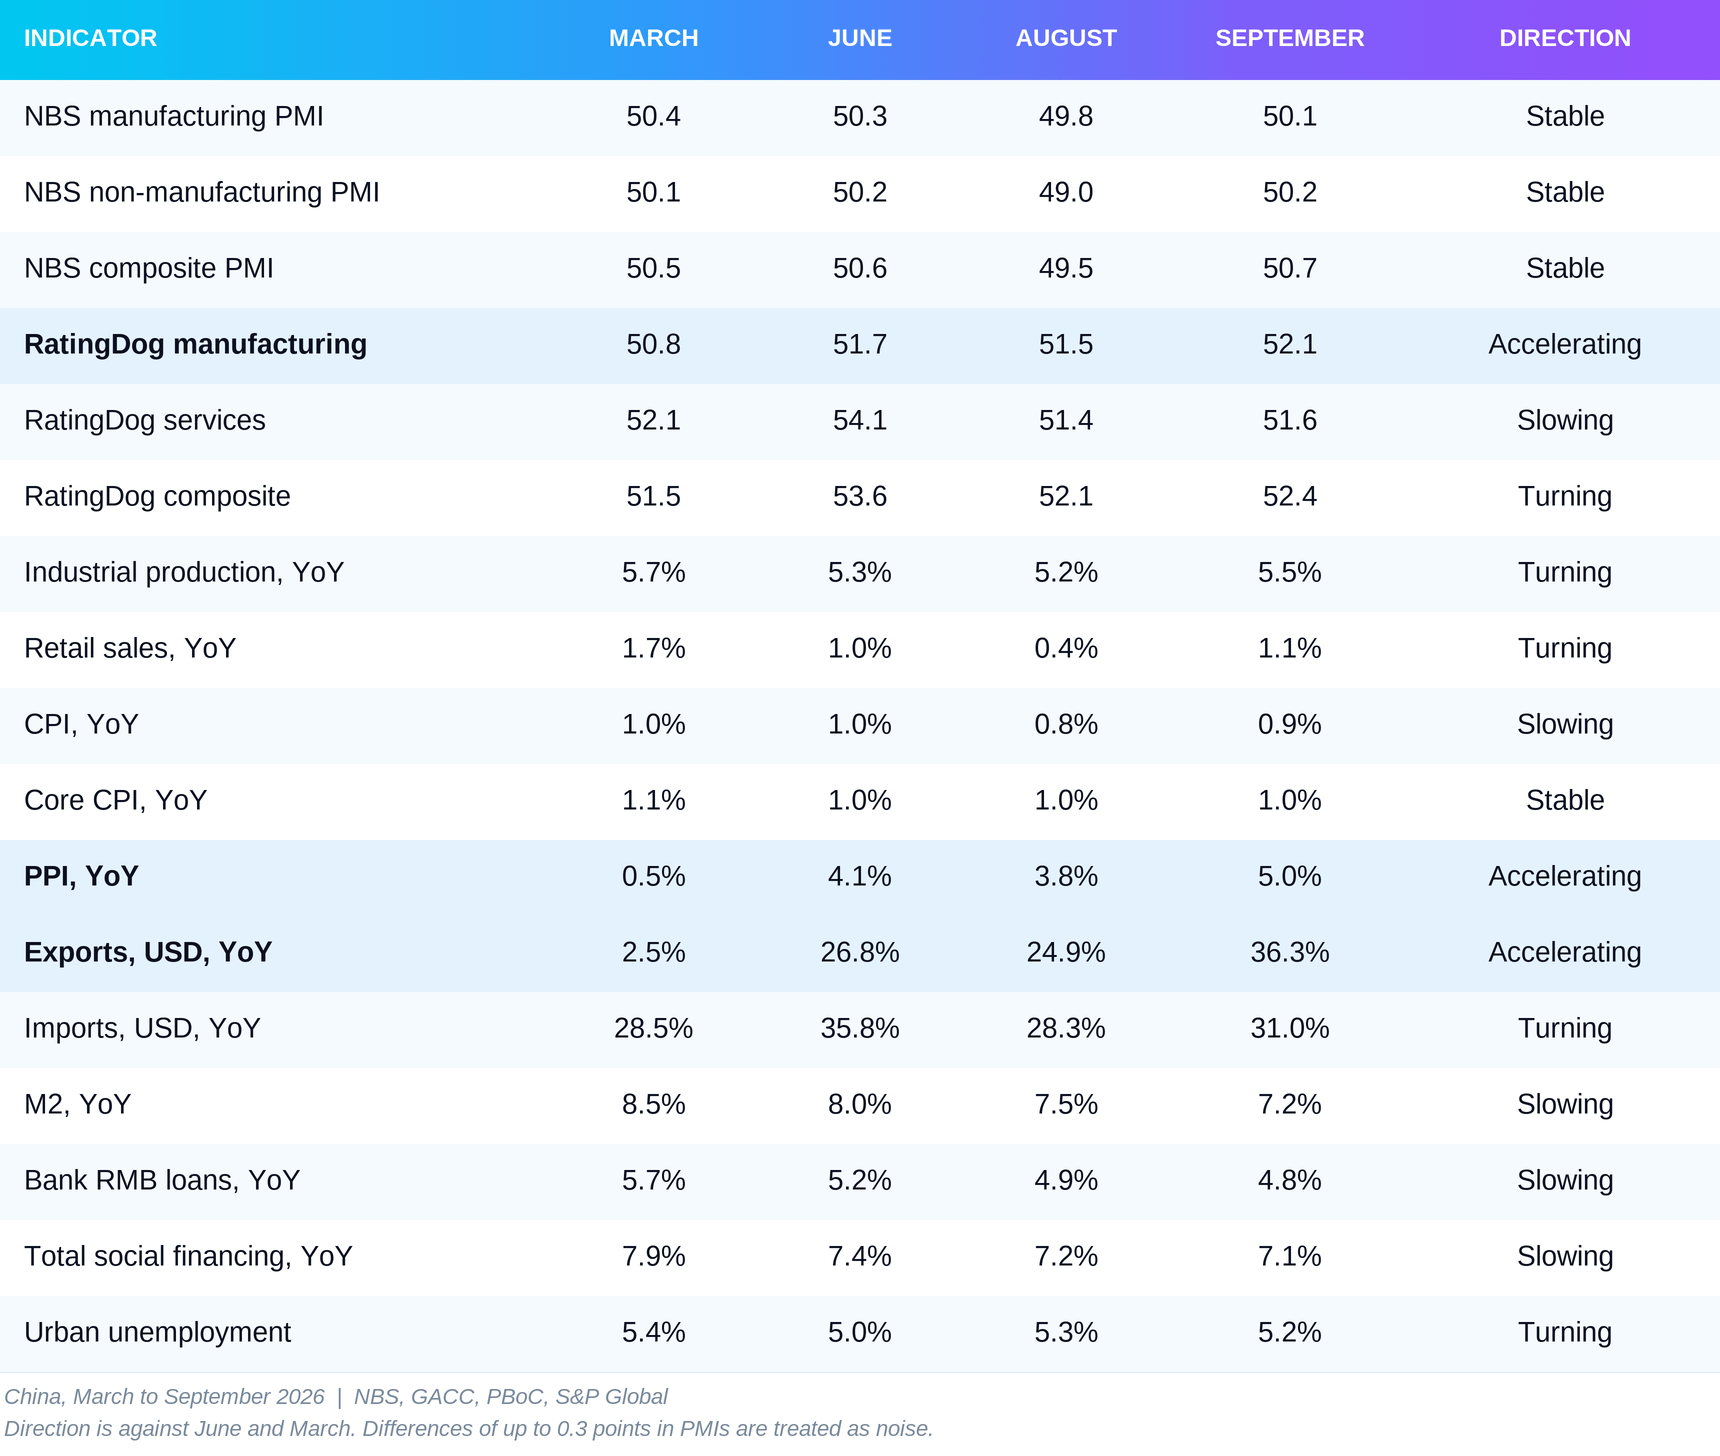
The table looks calmer than the headline. The official PMIs in September are almost exactly where they were in March and June. The difference is that between them came two months below 50. September is not a new peak. It is a return after a summer dip.
The line that really moves is exports: from 2.5% in March to 36.3% in September. The March figure is low partly because of a strong base a year earlier, but even against June the jump is ten points. Producer prices, the PPI, did the same: 0.5% in March, 5.0% in September. The two lines rise together, and that is no accident. A large part of the rise in exports is higher prices.
Industrial production changes direction. It is higher than in June and lower than in March. What matters is the seasonally adjusted monthly figure: output grew 0.11% in July, 0.54% in August and 0.61% in September. Companies really were producing more towards the end of the quarter.
Retail sales technically turn as well, but from a very low level. The 1.1% of September is just a tenth above June. Seasonally adjusted, sales rose 0.35% on August, after a 0.16% fall a month earlier. That is a good month, not a new trend.
Money and credit slow without exception. M2, the broad money in the system, fell from 8.5% to 7.2%. Total social financing, the widest measure of money flowing to the economy, from 7.9% to 7.1%. Three lines, one slope. The economy is accelerating while credit slows. That is only possible if growth comes from somewhere that does not need domestic credit. That place is the rest of the world.
What pushed and what held back growth
China does not publish quarterly contributions to growth in its press releases, but it does release them in its database as shares of growth. For Q3 the breakdown is: final consumption carried 47.9% of growth, gross capital formation 12.8% and net exports 39.3%. Gross capital formation is everything put into machinery, buildings and inventories. With growth of 4.5%, that means about 2.2 percentage points from consumption, 0.6 from investment and 1.8 from net exports, by our calculation from the published shares. In Q2 the same figures were 1.9, 1.5 and 0.9.
Consumption improved slightly, by about 0.2 points. That is no reason to celebrate, but it is not a decline either. Investment lost almost all of its contribution, about 0.9 points. Net exports added about 0.9 points. Put simply, the world replaced investment as the second engine of growth. China sold abroad what it did not invest at home.
Net exports have a quirk that the headline numbers hide. They are measured in real terms, that is in quantities. In August the volume of imported goods was 3.1% lower than a year earlier, while their price was 25.6% higher. Crude oil imports over nine months were 15.3% lower by weight. When China imports less oil because it is expensive, real net exports rise without anyone buying more Chinese goods. Part of the net-export contribution is weaker imports, not stronger exports.
The production side shows the same picture from another angle. Industry grew 5.2% and added 1.5 points to the quarter’s growth. Manufacturing was up 5.9%. Information technology and software grew 9.8%, leasing and business services 12.9%. Together the two added about one point. Trade, transport and restaurants added another. On the other side, construction shrank 4.4% and real estate 0.4%. So the secondary sector as a whole grew only 3.4%, even though industry grew 5.2%. The secondary sector is industry and construction together. The fall in construction pulls its growth almost two points below that of industry.
Inventories are a separate question. NBS does not publish how much inventories add to growth, for Q3 or for any quarter. Company data, however, show finished goods in stock growing faster than sales. We return to this in the section on the overlooked detail, because that is where the difference lies between growth produced now and growth borrowed from the next quarter.
The quarter month by month
July began weakly. The official composite PMI fell to 49.3 and new manufacturing orders to 48.5. Industrial production slowed to 4.5%. Banks cut their lending to the real economy by close to CNY 590bn in the total social financing measure. In July part of the weakness was the weather: floods and heat halted construction.
August repaired part of July. Output accelerated to 5.2% and its monthly growth to 0.54%. New manufacturing orders returned above 50. Companies took out long-term loans again. Retail sales, however, slipped to 0.4%, and households kept repaying debt.
September was the strongest month of the year on almost every number. Exports jumped 36.3%. Output accelerated to 5.5%. The official manufacturing PMI went above 50 for the first time since June, and the non-manufacturing index returned to 50.2. Small and medium-sized enterprises improved but stayed below 50: 49.7 and 48.9, against 50.6 for large ones. Total social financing added CNY 3.55trn, of which bank loans CNY 1.27trn.
The quarter ends stronger than it began. On monthly output growth, on the PMIs and on credit to companies, it enters Q4 with positive momentum.
October immediately calls that into question. The official manufacturing PMI fell to 49.3, new orders to 49.4 and new export orders to 48.7. The composite PMI was 49.7. In construction, new orders collapsed to 40.0. Small enterprises dropped to 47.5. The private RatingDog survey says something else: its manufacturing index was 52.0, almost the same as in September, with the fastest rise in output since April. The gap between the two surveys in manufacturing is 2.7 points. These are survey data from managers, not measured output. The hard data on output, sales and trade for October come out after this article’s cut-off.
The engine: chips, cars and price
How big is the engine? In Q3 China exported goods worth USD 1.246trn, 28.4% more than a year earlier. Imports were USD 882bn. The trade surplus for the quarter was USD 364.5bn, 27.0% above Q3 2025. These are our calculations from a single customs bulletin, summing the three months.
The engine is concentrated in a few products. In Q3 China exported integrated circuits worth USD 124.4bn, computers and parts worth USD 93.6bn and cars worth USD 58.1bn. That is about 22% of all exports for the quarter.
Chips and cars grow in different ways. Over the first nine months the value of exported integrated circuits was 108.1% higher than a year earlier, while their number rose only 3.8%. The average value of an exported chip has almost doubled. Part of that is a shift to more expensive products, part is the price of memory for AI servers. With cars it is the reverse. Value grew 54.3% and the number 51.9%. The average price of an exported car barely changed. China is exporting many more cars and much more expensive chips.
Customs also publishes overall indices that split export growth into price and quantity. They are available for July and August. In July the value of exports was 17.8% above a year earlier, the price 11.6% and the quantity 5.5%. In August value was up 18.6%, price 15.1% and quantity 3.0%. About two thirds of the growth in July and four fifths in August was price. These indices are in yuan, so they do not match the dollar growth rates. The September indices were still not on the customs website on 9 November.
Geography shows where the goods go. In September exports to Southeast Asia were USD 81.7bn, to the EU USD 60.2bn, to Hong Kong USD 52.5bn and to the United States USD 47.9bn. The destination does not prove the final buyer. Much of what goes to the neighbours is part of the same supply chain for servers and electronics.
Is the engine sustainable? Profits say “for now, yes, but in a narrow circle”. Industrial profits for January to September grew 15.5%, but in electronics they more than doubled, up 103.8%. Car makers earned 22.8% less despite record exports. Capacity utilisation in computers and electronics was 80.2%, against 73.1% for industry as a whole.
Investment intentions are narrow too. Investment in equipment grew 9.7% over nine months, in intellectual property products 9.3%. Overall manufacturing investment, however, was 2.1% lower. Companies are buying machines and software, but not expanding capacity. Foreign capital follows the same pattern. Foreign direct investment over nine months was 4.3% lower, while that in high technology was 33.8% higher. It is now 41.6% of the total.
What could stop the engine? First, the price of chips. In October markets repriced the profits from artificial intelligence. South Korea’s KOSPI, an index heavily weighted towards memory makers, lost 16.19% in the month, and in the first week of November the sell-off continued. As we described in our November sector rotation analysis, the South Korean exchange-traded fund EWY, more than 40% of which is SK Hynix and Samsung Electronics, lost 28.44% in the month to 6 November. If the price of memory falls, the value of Chinese exports falls at once, without China losing a single customer. Second, the yuan. It has risen about 5.8% against the dollar over a year. That makes Chinese goods dearer for foreign buyers. Third, trade measures against Chinese cars in the markets they are entering. And fourth, the surveys. In October new export orders in the official PMI fell to 48.7.
The brake: households and construction
The brake is where it was in Q2. The difference is that it now weighs more, because investment no longer offsets it.
We start with credit, because that is where the picture is clearest. In Q3 households repaid CNY 663.2bn more in loans than they took out. In Q2 the figure was CNY 663.5bn. Three months, a new mortgage subsidy, cheaper rates and stronger industry did not change their behaviour by a single yuan that can be told apart from rounding. Their short-term loans, which often finance purchases, fell by CNY 552bn. Long-term loans, which include mortgages, by CNY 115bn. When the price of a home is falling, a household does not take out a mortgage, even at a low rate. The average rate on new mortgages is 3.05%, and mortgage loans are 4.1% lower than a year earlier.
Property has not hit bottom. For January to September property investment was 20.6% lower, after 18.0% in the first half. New construction starts were 24.9% lower, completions 25.1%. The money developers receive was 21.6% lower, and bank loans to them 33.1%. Sales of new homes were 13.2% lower by floor area. There is one bright spot. Transactions in existing homes grew 10.7% by floor area. People are buying, but cheaply, from other people rather than from developers. That does not help construction, and prices show it.
Home prices keep falling almost everywhere. In September new homes got cheaper than in August in 49 of the 70 cities surveyed, and existing homes in 59. Compared with a year earlier, new homes are cheaper in 64 cities and existing ones in 69. Only in the four largest cities did new home prices rise, by 0.1% on the month, and even there they are 0.5% below a year earlier. In the third group, the smaller cities in the NBS survey, new homes are 3.9% cheaper than a year earlier and existing ones 5.4%.
Property flows into the budget. Local governments’ revenue from selling land-use rights was 27.9% lower over nine months. Local governments used that money to fund construction, which is why spending from the government funds that hold it is 16.2% lower. General budget spending grew only 1.0%, and local spending 0.2%. Instead of land, the public sector is financing itself with bonds. In Q3 the central government and local governments together issued a net CNY 3.86trn of bonds, 58.4% of total social financing. The bonds, however, do not raise spending. They fill the hole left by land. The state is not offsetting the decline. It is only keeping it from getting deeper.
Private business sees no reason to expand. Private investment over nine months was 10.4% lower, after 8.5% in the first half. Total fixed-asset investment was 7.2% lower, after 5.7%. Infrastructure was down 4.2%. Industrial capacity utilisation was 73.1%, 1.5 points below a year earlier. In cars it was only 66.2%, in cement and other non-metallic minerals 61.2%. When a third of the machines stand idle, there is no point buying new ones.
Companies are still borrowing. Long-term corporate loans grew by CNY 980bn in Q3, against CNY 130bn in Q2. Bill financing, in which a bank pays a company early for what it is owed in a trade deal, fell from CNY 1.91trn to CNY 426bn. The mix improved: less money for current payments, more money for years ahead. But investment did not take off, and capital formation contributes only 0.6 points of growth. A long-term loan can refinance old debt. It can also go to a state-owned organisation. The data do not let us tell.
Households respond by saving. Disposable income per person over nine months grew 4.4% in real terms, consumer spending 2.7%. The difference goes into savings. Youth unemployment among 16 to 24 year-olds not in education was 18.0% in September, after 18.9% in August and 17.7% in September 2025. Unemployment among 30 to 59 year-olds held at 3.9%.
Is the brake structural? Yes. Nothing in Q3 was temporary. There were no floods in September, and household credit, property and private investment all got worse. The cyclical part is small: retail sales excluding cars grew 3.9% in September and sales of services 5.0% over nine months. The brake will ease when families stop expecting lower home prices. So far the data show no such change outside the four largest cities.
Prices: expensive energy, cheap homes
Average consumer inflation in Q3 was 0.7%, after 1.1% in Q2. Month by month it rose, 0.5%, 0.8%, 0.9%, but the quarter as a whole was lower than the one before. Food is the main reason. In September it was 1.7% cheaper than a year earlier. Core CPI, excluding food and energy, was 1.0% and barely moved. It is the better measure of domestic demand and it says the same as the shops: demand is there, but weak.
The PPI, the prices at which producers sell their output, tells the opposite story: an average of 4.1% in Q3, 5.0% in September and 5.7% in October. The big price rise is at the start of the chain. Mining prices were 25.4% higher in September and 27.9% in October. For fuel and power bought by producers the rise was 18.6% in October. For consumer goods the PPI was -0.1%. NBS itself links this to the conflict in the Middle East, which in its view hit oil production and weighed on growth as early as Q2. The cost moves along the chain but stops before the shelf.
The gap between PPI and CPI, the price scissors, widened from 3.0 points in August to 4.1 in September and 5.0 in October. The two indices measure different baskets, so the gap is not a direct measure of margins. But it shows where the pressure is: on producers who buy expensive energy and sell into a weak domestic market.
The surveys show that the strain is starting to bite. In September the official PMI recorded a sharp rise in raw material costs, with an index of 60.8, and higher selling prices, at 54.0. In October both indices eased. RatingDog says the opposite for smaller firms: they cut their selling prices in both September and October because of intense competition. Large firms pass the cost on. Small ones absorb it.
Profits confirm where the pain is. The average industrial margin over nine months was 5.68%, 0.44 points above a year earlier, thanks to electronics and mining. Makers of cement, glass and other non-metallic minerals earned 46.9% less, car makers 22.8% less.
For the central bank, prices give freedom. Consumer inflation is below 1% and easing. Producer inflation is high, but it is imported expensive energy, not overheated domestic demand. An interest rate can fix neither.
The overlooked detail: the warehouse
The headline numbers say Q3 was the best quarter of the year. The warehouses say something more cautious.
At the end of September finished goods in stock at industrial enterprises were worth CNY 7.37trn, 11.6% more than a year earlier. The same companies’ revenue over nine months grew 6.6%. Inventories are growing almost twice as fast as sales. In June inventory growth was 9.5%, in July 10.8%. The trend is up. On average a product sits in the warehouse for 21.0 days, 0.6 days longer than a year earlier. Receivables, the money customers still owe, grew 10.0%, and the average time to collect them is 71.6 days, 1.3 days longer.
Why does this matter? Because growth is measured by what is produced, not by what is sold. When output accelerates and part of it stays in the warehouse, this quarter’s growth is borrowed from the next. Someone will have to produce less until the warehouse empties.
There are three caveats, and they are serious. First, inventories are in current prices. With producer prices 5% higher than a year earlier, much of the rise in inventories is price, not more goods. How much exactly we cannot say. Second, the official PMI’s index of finished goods inventory was 47.6 in September and 47.5 in October, below 50. The managers themselves say their stocks of finished goods are falling. Third, NBS does not publish the contribution of inventories to GDP.
So this is a warning, not proof. But the warning ties in with October. The official manufacturing PMI is falling just as the warehouses are fuller than at any time in the past year. If October output, due on 16 November, also slows, the warehouse will be the first explanation.
What this means
The growth-inflation map puts China in Q3 in the “growth strengthening, inflation easing” quadrant. That is a comfortable position for the central bank: it does not need to tighten, because prices are not running, and it does not need to ease, because growth is improving. Growth on the previous quarter accelerated by 0.3 points, while average consumer inflation fell by 0.4 points. This is the first quarter in this quadrant for a year.
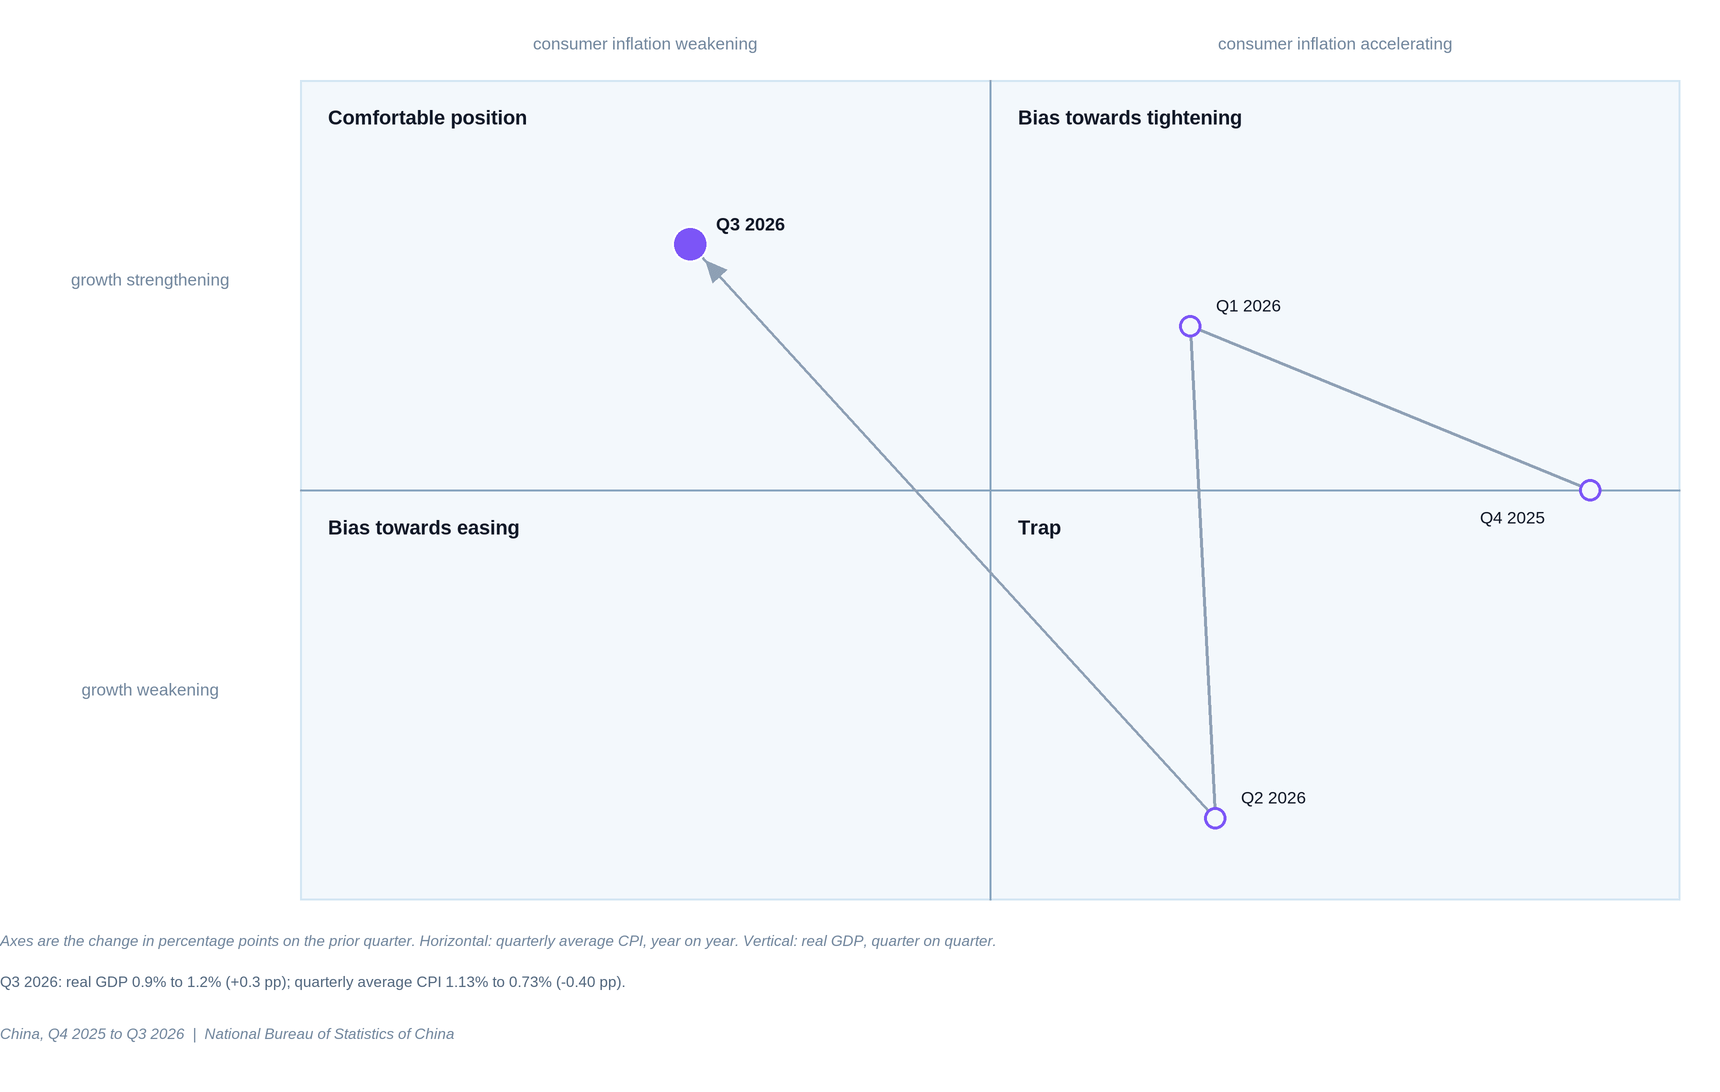
The PBoC is behaving exactly as the map suggests. The one-year loan prime rate, the main reference rate for loans in China, has been 3.0% since December 2025. The five-year rate, the benchmark for mortgages, is 3.5%. Neither was touched in Q3, nor on 20 October. The real rate, that is the loan prime rate minus current inflation, was 2.1 points in September. Easing remains targeted. On 29 September the bank cut the rate on its Pledged Supplementary Lending, targeted loans to the state development banks, from 1.75% to 1.50%. It added CNY 700bn in quotas for technology, agriculture and small business. From 1 October the state covers 1 point of the interest on a new first-home mortgage. Quotas are not money spent. They become a flow when banks use them.
The quantities say there is liquidity. The PBoC’s balance sheet grew CNY 1.07trn over the quarter. In September alone net operations added CNY 556bn. The interbank rate was 1.40%, almost the same as in August. Banks have money. The problem remains who wants it. The Q3 answer is: the public sector, through bonds of the central government and local governments, and companies, through long-term loans. Not households.
After the quarter ended, the PBoC did something that shows how relaxed it is about growth. On 3 November it raised the reserve requirement on foreign currency deposits from 4% to 6%, effective 15 November. The measure drains dollars from the banks and slows the rise of the yuan. It is a measure for the exchange rate, not for growth. The bank does not cut its rate, it only slows the yuan’s appreciation, which protects exports without pumping money in at home. The bank also announced measures for the stock market: refinancing for share buybacks becomes permanent and cheaper, at 1%, and a swap facility for brokers and funds carried out its first operation, for CNY 100bn. In October the CSI 300 index lost 8.54%. These are measures for financial stability, not easing for growth.
What does this mean for liquidity? It is not lacking and it is not the problem. China was the only one of the four large central banks adding liquidity in September, while the Fed, the ECB and the Bank of Japan held or tightened, as our November liquidity analysis showed. But the money the PBoC releases goes into bonds of the central government and local governments and into corporate loans, not to households. The mortgage subsidy is the first measure aimed precisely at that link. The first test is October credit.
For an ordinary person in China, Q3 looks much like Q2. Food is cheaper. Their home is losing value, unless it is in Beijing or Shanghai. If their child is 22 and not studying, almost one in five of their peers in the labour market is out of work. A mortgage is cheaper than ever, but they do not want one.
What is confirmed? That growth accelerated, that the engine is net exports, that investment weakened and that households did not change their behaviour. What remains an assumption? How much of export strength in September is price, how much of growth is sitting in warehouses, and whether October is a one-off dip or the end of the acceleration.
What we said last quarter
Three months ago we wrote that China was growing through industry, technology and exports, while households, property and private investment lagged behind. Q3 confirmed that framework and sharpened it. Exports accelerated more than we expected, and investment weakened more. We set two thresholds for a change of phase: a composite PMI above 50 with new orders above 50, and growth of at least 4.5% with stronger consumption. September met the first, and Q3 met the second, although consumption improved by only about 0.2 points. That is why we are changing the phase.
We also owe a correction. Our Q2 map placed China in the “trap” quadrant: growth weakening, inflation accelerating. The text beside it, however, described easing inflation and a bias towards easing, and our July and August issues repeated that. The text described the monthly fall in CPI from 1.2% in April to 1.0% in June. The map compared quarterly averages, and those rose from 0.9% to 1.1%. The map was right. In Q2 the PBoC was more constrained than we wrote, and that explains why it did not cut rates.
We also missed energy. We explained the Q2 slowdown entirely by weak domestic demand. NBS later also linked it to the conflict in the Middle East, which hit oil production and coal-related industries. The thesis of weak households stands, but it was not the whole explanation. Inventories, which we flagged as a risk, kept growing.
The case against our reading
The strongest number against our phase is the official October PMI. The manufacturing index fell to 49.3, the composite to 49.7, new orders to 49.4 and new export orders to 48.7. If the acceleration were real, it should have lasted at least one month beyond the end of the quarter. In the official survey it did not. Whether it holds in measured output and trade will be shown by the October data, due on 10 and 16 November.
There is another mechanism that explains the same data without any acceleration of the economy. On this view, the Q3 acceleration is about prices and imports. Price accounts for between two thirds and four fifths of export growth in July and August. Expensive energy reduces the volume of imports, and that raises real net exports without anyone buying more. Net exports carry 39% of growth, while investment shrinks to 0.6 points. Inventories are growing almost twice as fast as sales. On this reading Q3 is a quarter in which China produced more for the warehouse and for an expensive global memory cycle, while the domestic economy kept slowing. It is growth with slowing momentum dressed up in a good quarterly number.
This reading has serious support. We reject it as the main one for three reasons. Growth on the previous quarter is measured in real terms and after seasonal adjustment, so price does not explain it directly. Output grew month after month throughout Q3. And RatingDog, which better captures private and export-oriented firms, stayed at 52.0 in October.
What would have to happen to prove us wrong? Growth below 0.9% on the previous quarter in Q4. An official composite PMI below 50 in October, November and December. And a falling net-export contribution while investment stays below one point. Then Q3 will turn out to have been a one-off jump within the slowdown.
Risks in both directions
The upside risk is households. The mortgage subsidy from 1 October is a direct measure for households. If October and November credit show a positive household flow for the first time in months, the brake will start to ease. The acceleration would then get a second engine. Transactions in existing homes, up 10.7%, show there are buyers. The second upside risk is energy. If oil gets cheaper, as physical Brent began to in October, producers’ margins will loosen.
There are four downside risks. The first is the price of chips. October’s sell-off in AI stocks could reach memory prices, and from there the value of Chinese exports. The second is the warehouse. If the inventories turn out to be real rather than price, Q4 will have to produce less. The third is the yuan. It is already about 5.8% stronger against the dollar than a year ago, and the PBoC had to step in to slow it. The fourth is construction. New construction orders stood at 40.0 in October. If infrastructure does not make up for it, capital formation could fall further.
What to watch
On 10 November October trade comes out. If dollar exports grow by less than 20%, after 36.3% in September, the engine is losing speed faster than expected.
Around mid-November comes PBoC credit for October. The test is a positive monthly household flow. That is the first check on the mortgage subsidy.
On 16 November October output, sales, investment and home prices come out. If industrial production falls below 5.0% and retail sales stay below 1%, the October PMI will have hard confirmation.
On 18 November customs releases the price and quantity indices for October. If price remains above two thirds of export growth, the price reading strengthens.
On 30 November come the official PMIs for November. The threshold for a return to growth with slowing momentum is an official composite PMI below 50 for a second month in a row, together with industrial production below 5.0% in October.
Closing
China accelerated in Q3, but through exports, not through households. The world is buying more and at higher prices, while households save as much as they did in the spring. The growth is real, but it depends on one engine and on the prices of two or three products. We do not yet know whether October is a pause or the end of the acceleration, nor how much of the growth is sitting in warehouses. The answer starts to arrive on 16 November.
Sources
National Bureau of Statistics of China (NBS), preliminary GDP estimate for Q3, Chinese original and overview of the economy for the first three quarters.
NBS, database data.stats.gov.cn: shares of the three components of demand in growth for the single quarter, and unemployment by age group. The contributions in percentage points are calculated by Liquidity Desk.
NBS, Zheng Xuegong on the first half and the first three quarters; press questions and answers for the first three quarters; Xiao Ning on employment.
NBS, industrial production for September, retail sales, fixed-asset investment, real estate, capacity utilisation, household income and spending.
NBS, home prices in 70 cities for September: tables and interpretation. The city counts are our own tally from the tables.
NBS, industrial profits for January to September, including inventories and receivables.
NBS, CPI for September and October; core CPI for September; PPI for September and October; October interpretation.
NBS, 2026 release calendar.
S&P Global, RatingDog China General Manufacturing PMI for March, September and October; services and composite for September and October.
General Administration of Customs (GACC), monthly bulletin in US dollars, revision of 27 October; exports by product for July, August and September, imports by product for September; trade by partner. Quarterly totals and the average value of an exported chip are our own calculations. Quarterly product values are the sum of the monthly tables.
GACC, trade indices by HS2: list, exports for July and August, imports for July and August. The price share is our own calculation. The September indices had not been published by 9 November.
GACC, 2026 release calendar, official copy at the Ministry of Commerce.
People’s Bank of China (PBoC), financial statistics for the first three quarters, money supply, total social financing flow and stock, monetary authority balance sheet, September operations, loans by sector for Q3, financial markets in September. Sector credit flows are our own differences between rounded cumulative values.
PBoC, targeted instruments of 29 September and mortgage subsidy from 1 October.
PBoC, foreign currency reserve requirement, 3 November, capital market instruments, 2 November, refinancing for share buybacks, 4 November, SFISF operation, 3 November, report on financial work to the National People’s Congress, 3 November, the source for new loan rates and the yuan’s appreciation.
ChinaMoney, loan prime rate history.
Ministry of Finance, budget for January to September; Ministry of Commerce, foreign direct investment for January to September.
China Securities Index, CSI 300 in October.
Earlier Liquidity Desk analyses read for context: Macro Pulse, China, Q2 2026; Macro Pulse, China, August 2026; Global Liquidity Snapshot, November 2026; Global Sector Rotation, November 2026, the source for the moves in KOSPI, EWY and physical Brent.
For information and analysis only. Not investment advice.
Liquidity Desk | liquiditydesk.org