

Frame
This is the first monthly Macro Pulse for the eurozone after our second-quarter review. The main July releases are now available. Industrial production, published on 16 September, was the last essential piece. It did not confirm the strength suggested by business surveys. The final August inflation reading, published on 17 September, is included only as a check on the direction of prices after July. We need to separate what firms expected to do from what they actually produced and what households bought.
Where the economy stands
The phase in July is stagnation with improving leading signals. We called the previous quarter an acceleration. We now know more about what drove that quarter’s growth, and we have the first full set of real-economy data for the following month. Together, those checks do not allow us to repeat the earlier label as an established fact.
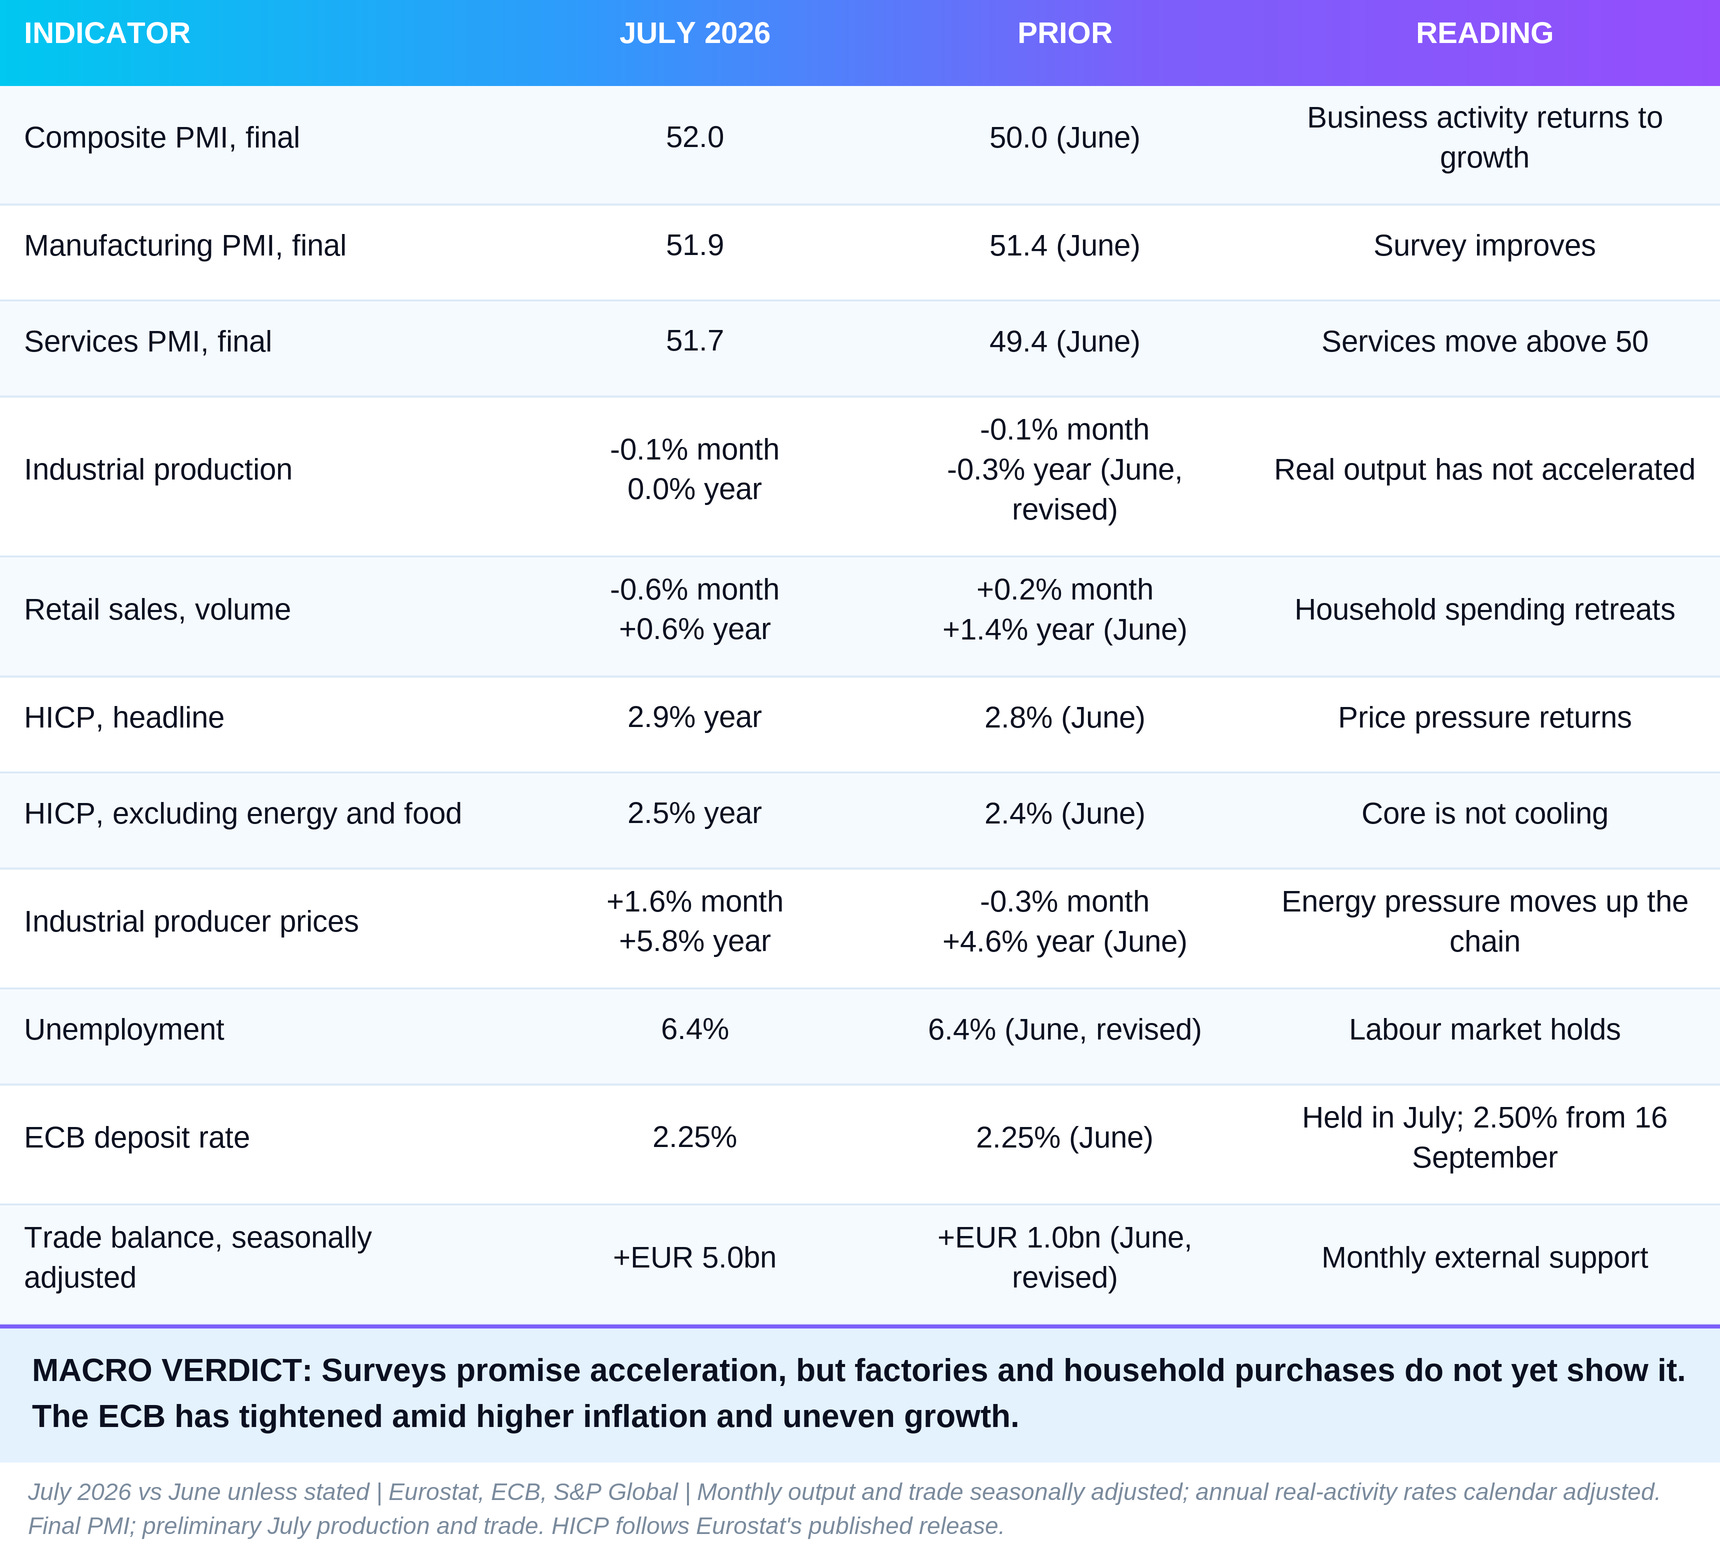
The business dashboard is turning green. The composite PMI, a survey of purchasing managers in which a reading above 50 signals expansion, rose from 50.0 in June to 52.0 in July. Services moved from 49.4 to 51.7, while the manufacturing PMI climbed from 51.4 to 51.9. The economic sentiment indicator recovered to 97.1 from its spring low of 93.7. Goods exports rose 1.2% from June. Corporate lending grew faster too.
The wheels are still spinning, however. Industrial production fell 0.1% in July after a revised 0.1% decline in June. It was unchanged from a year earlier. Retail sales volume dropped 0.6% on the month. Unemployment held at 6.4%, a cushion against a deeper downturn but not proof of renewed acceleration. The eurozone has no monthly GDP release, and statistics on services arrive later.
The engine is recovering business activity and some external demand. The brake is the household sector. Purchases are weakening as energy becomes more expensive and credit harder to obtain. That brake looks mainly cyclical. Higher bills and borrowing costs can recede without permanent damage to productive capacity. There is also a longer-term risk to export competitiveness that one better month will not solve.
Prices make the ECB’s position uncomfortable. Headline inflation rose from 2.8% in June to 2.9% in July, while producer prices accelerated again. The final August reading reached 3.2%. The ECB has already raised its deposit rate from 2.25% to 2.50% in September. From here the choice is harder. Further tightening could cool purchases that are already weak, while waiting could allow the price shock to last longer.
Core indicators
The trajectory
One month cannot settle the phase on its own. The six-month view makes July look more like a crossroads. Some indicators have recovered from the spring shock. Others have not regained their earlier pace. The final column compares July with January and April under the template’s direction rule. A small difference is called small rather than dressed up as a strong trend.
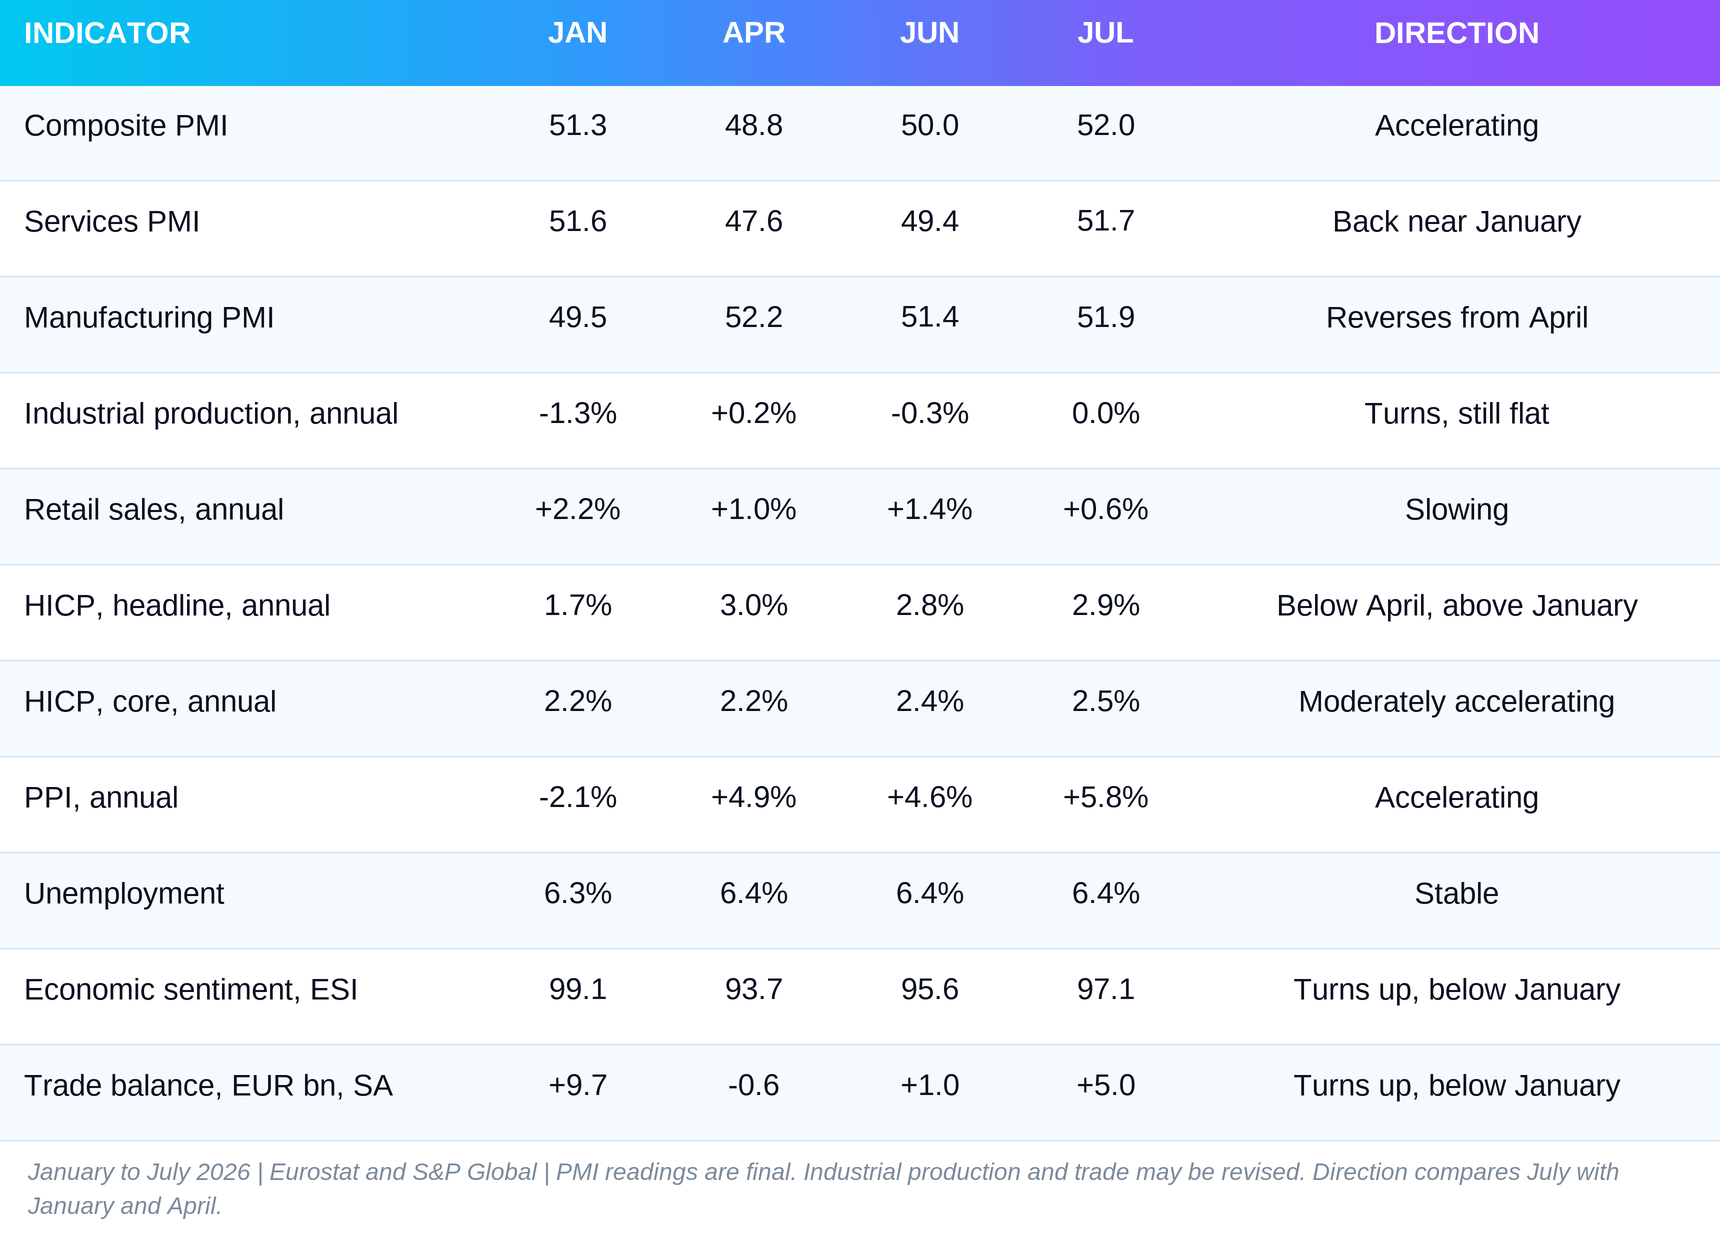
The most important divergence is between the PMI and actual output. The composite PMI is now higher than in both January and April. Industrial production, however, is level with a year ago, and each of the last two months brought a 0.1% decline. The survey asks firms whether activity improved from the previous month. Official statistics measure the volume produced. They are different windows onto the same economy, not interchangeable readings. For now, the expectations window is brighter than the output record.
The second divergence is between firms and households. Economic sentiment rose from 93.7 in April to 97.1 in July. Industrial and services confidence improved within it. Consumer confidence deteriorated from -2.9 in April to -5.2 in July. Annual retail-sales growth slowed from 2.2% in January to 0.6% in July. People have not stopped buying. But the direction of their purchases runs against the direction of business surveys.
The third divergence is in prices. Headline inflation fell from a May peak of 3.2% to 2.8% in June, then edged back up to 2.9% in July. Core inflation, which excludes energy and food, moved much more slowly, from 2.2% at the start of the year to 2.5%. Producer prices made a sharper turn. Their annual increase reached 5.8%, from 4.6% in June. The price risk does not come from runaway domestic demand. It comes mainly from another rise in energy costs and the possibility that those costs gradually reach other goods and services.
The engine: business wakes up, but cannot yet pull every carriage
The recovery begins with firms. Services crossed back above the PMI’s expansion line of 50 in July after falling below it in June. Manufacturing remained in expansion. That is a meaningful change from the second quarter, when the factory survey looked stronger than the services survey. If both sectors keep expanding, the economy has a chance to turn a one-month signal into broader growth.
We cannot measure the engine by a survey alone. Industrial production fell 0.1% in July. The detail beneath the headline is better, but mixed. Output of materials and parts used by other factories rose 0.3%. Capital goods rose 0.5%, energy 0.9%, and durable consumer goods 0.9%. A 1.6% fall in non-durable consumer goods outweighed those gains in the aggregate. The weak headline is not a uniform factory collapse. Nor does it justify calling the whole sector an accelerating one. Four groups improved, but total output still declined.
External trade offers more tangible support. Seasonally adjusted goods exports rose from EUR 257.7 billion in June to EUR 260.8 billion in July, an increase of 1.2%. Imports fell 0.4% to EUR 255.7 billion. The monthly surplus therefore grew from a revised EUR 1.0 billion to EUR 5.0 billion. These are flows of real goods, but the published trade values are nominal. On their own, they do not tell us how much the physical volume increased. That is why we do not automatically turn the larger surplus into a contribution to real GDP in the third quarter.
Durability is in doubt here too. The unadjusted trade surplus for January through July was EUR 17.0 billion, against EUR 92.8 billion in the same period of 2025. Exports over those seven months grew 1.2% from a year earlier; imports grew 5.8%. One better July does not erase that gap. Some of the monthly improvement may reflect the timing of shipments rather than a lasting recovery in competitiveness. The ECB’s September projections also warn that more expensive energy, the euro’s appreciation since late 2024, and US tariffs are weighing on exports.
Credit adds fuel, but distributes it unevenly. Broad money M3 grew 3.4% from a year earlier in July, after 3.3% in June. Loans to non-financial corporations, adjusted for transfers, accelerated from 4.0% to 4.4%. Household lending moved less, from 3.0% to 3.1%. More borrowing does not necessarily mean more productive investment. The ECB’s bank lending survey shows that some business demand is for inventories and working capital, while some is for large-company investment and refinancing old debt. Those motives have different shelf lives.
Firms are borrowing more despite stricter rules. In the second quarter, the share of banks tightening their approval standards for business loans exceeded the share easing them by 7 percentage points. For loan demand, banks reporting an increase outnumbered those reporting a decline by only 3 points. This is not a credit boom. Some firms have investment plans and liquidity needs, but banks have not opened the floodgates. Whether the better surveys become real growth over the next few months may be decided here.
The brake: households feel the cost before the recovery
The brake is household spending. Retail-sales volume fell 0.6% in July from June. Food, drinks and tobacco sales rose 0.4%, but non-food goods excluding fuel fell 1.4%, and automotive fuel sales declined 0.8%. Annual growth for the total was only 0.6%. Consumers are cutting back on purchases they have more freedom to postpone. The detail shows where they are saving.
The labour market is still preventing a deeper slide. Unemployment was 6.4% in July, the same as in revised June data. Eurostat estimates 11.264 million unemployed people in the eurozone. Employment increased 0.1% in the second quarter to 176.4 million. But a quarterly gain of 0.1% is not a strong new hiring wave. It is a stabiliser. If jobs hold, households can absorb some of the price shock. If hiring weakens, today’s caution could become a longer decline in purchases.
People’s own expectations explain why low unemployment is not enough. In the ECB’s July survey, the median household expected its nominal income to rise 1.0% over the next twelve months, but its spending to rise 3.6%. This is not an ECB forecast of actual income or expenditure. It measures how consumers see their own prospects. The gap says they are preparing for a tighter budget. Consumer confidence deteriorated to -5.2 points in July even as business sentiment recovered.
Banks reinforce the brake. For housing loans, the share of banks tightening approval standards exceeded the share easing them by 9 percentage points. For consumer credit, the difference was 12 points. The demand picture runs the other way. Banks reporting weaker demand outnumbered those reporting stronger demand by 15 points for mortgages and 2 points for consumer credit. The direction matters more than the size of those gaps. Households are pulling back from debt just as firms are seeking more finance. The same interest rate feels different to a company with orders and to a family deciding whether to buy a home.
For now, this looks mainly cyclical. Energy bills raise costs, interest rates make credit-funded purchases more expensive, and uncertainty encourages delay. If energy prices calm down and real incomes recover, the brake can ease. The more persistent problem is the eurozone’s exposure to imported energy and external trade shocks. One ECB decision cannot make either disappear. The distinction between temporary pressure on household budgets and a longer-term vulnerability matters.
Prices: the shock has not travelled through the whole chain
Headline eurozone inflation was 2.9% in July from a year earlier, against 2.8% in June. Core inflation, excluding energy and food, was 2.5% after 2.4%. Both rose, but not by the same amount or for the same reason. Energy prices were up 10.3% from a year earlier, after 8.5% in June in Eurostat’s published table. Services inflation edged from 3.2% to 3.3%. Non-energy industrial goods moved from 0.7% to 0.9%, while food, alcohol and tobacco eased from 1.5% to 1.2%.
This is not broad-based overheating. Energy is the hottest point. It also touches almost every firm and household. A company facing a higher bill for transport, electricity or heating may initially accept a lower margin. If the shock persists, it becomes more likely to raise its final prices. That is why producer prices deserve a separate look. We examined why gas can become more expensive for Europe even without a physical shortage, and how that cost reaches industry and households, in our August Commodity Snapshot.
Industrial producer prices rose 1.6% in July alone and 5.8% from a year earlier. In June the monthly change had been -0.3% and the annual rise 4.6%. The energy component jumped 5.6% on the month and 12.9% on the year. Excluding energy, producer prices were unchanged from June and 3.1% higher than a year earlier. The distance between PPI at 5.8% and consumer inflation at 2.9% is 2.9 percentage points. It does not mean consumer inflation must reach 5.8%. The two indices cover different things. It does show where firms meet cost pressure before consumers see a final price.
The check after July is uncomfortable, though not one-sided. Final headline inflation for August was 3.2%, below the initial 3.3% estimate. Energy accelerated to 14.3%, but services cooled to 3.0% and core inflation slipped to 2.4%. The renewed rise in the headline rate is still mainly an energy story. Softer core inflation is a real argument against the claim that the shock has already spread everywhere. If services keep cooling, the ECB may pause after its September increase. If prices outside energy rise with a lag, its room to wait will narrow.
The ECB’s September projections put average headline inflation at 3.0% in 2026, 2.5% in 2027 and 2.1% in 2028. That is a scenario, not an outcome already recorded. It assumes the energy shock gradually fades. The bank also describes worse scenarios if the conflict in the Middle East lasts longer and costs feed more strongly into wages and prices. For the reader, the important line is between temporarily expensive energy and persistently higher inflation outside energy.
The overlooked detail: what the second-quarter revision actually changed
Our published second-quarter analysis described faster GDP growth supported by inventories, with the external sector holding it back. That causal story no longer stands. The breakdown of GDP by component had not been released when we wrote it. Eurostat published the figures on 7 September, and they point the other way. Changes in inventories subtracted 0.5 percentage points from quarterly growth. Net exports added 0.9 points. Household consumption contributed 0.2 points, while government consumption and fixed investment contributed little.
This is not a minor statistical adjustment. The earlier article saw factories producing for stock as the main engine and trade as a headwind. The final account says inventories were a brake and net exports carried growth. We cannot change the published article. We can say clearly here what we learned after publication and why it changes the next reading.
At the same time, headline GDP growth was revised up from 0.4% to 0.6% from the first quarter. That looks like stronger acceleration until we examine Ireland. Its GDP jumped 10.2% in the quarter amid multinational-company activity that says little about local demand. The ECB substitutes a measure of Irish domestic activity that excludes large, one-off asset transactions for Irish GDP. On that adjusted basis, the eurozone grew 0.3% in the second quarter, exactly as it did in the first. The headline accelerated. The underlying pace did not.
This is why our July classification is stricter. Better surveys are a promise. Stronger exports are support. But once the second quarter shows no acceleration on the ECB’s cleaner measure, and July’s industrial and consumer volumes contract, we cannot call that promise fulfilled. This judgement may prove too cautious. At least it does not repeat a convenient story that the new data have already overturned.
What this means for the ECB and liquidity
The July data alone give no clean signal for either another rate increase or easing. Headline inflation accelerated, but industry and retail sales weakened. The ECB held its deposit rate at 2.25% on 23 July. On 10 September it raised the rate to 2.50%, effective 16 September. That is a decision already taken, not proof that the July economy accelerated. If energy pressure remains high and spreads into other prices, the next move may again be tightening. If core inflation continues to cool while real volumes stay weak, a pause becomes more likely. Headline inflation does not yet support rapid easing.
Liquidity conditions are tightening through two channels. The first is the price of money. A higher deposit rate influences short-term market rates and gradually the cost of new loans. The second is bank behaviour. Banks are already reporting tighter approval standards for business loans, mortgages and consumer credit. The higher policy rate compounds that caution. Even if M3 and lending are growing from a year earlier, financing is not becoming easier for every new project or purchase.
For a household, the effect is straightforward. More expensive credit makes a mortgage or an instalment purchase harder to carry while higher energy bills take another slice of the budget. For a firm, the outcome depends on orders and its balance sheet. A company with enough sales may keep investing despite the rate. Another may borrow only to cover working capital or refinance an old obligation. That is why corporate loan growth of 4.4% does not equal acceleration across the whole economy.
The biggest unknown is how far the energy shock will travel. For now, August’s cooling in services and core inflation argues for waiting rather than an automatic further increase. Producer prices show that the risk has not passed. In every scenario, someone bears part of the cost.
Risks in both directions
The strongest case against our stagnation label is that surveys sometimes see a turn before official statistics do. July’s PMI was above 50 in both manufacturing and services. Four of the five main industrial groups increased output on the month despite the weak aggregate. Exports rose, and corporate lending accelerated. If total industrial production and retail sales return to growth in August, July’s wheelspin may look like a brief interruption in a recovery already under way. The ECB also expects support from public spending and investment in infrastructure, defence and technology. This is the strongest honest version of the optimistic case.
The opposite risk is that energy stays expensive for longer. Business costs would keep rising while household income struggles to catch up. Further credit tightening could postpone home purchases and investment. July’s nominal trade surplus may also mislead if import prices and the timing of shipments drive the balance more than durable export strength. In that scenario, the surveys will have signalled a false start.
Neither direction is certain. Stagnation in this article is not a verdict on the entire third quarter. It is the most economical name for what July recorded while we wait to see whether recovering confidence turns into goods produced, services delivered and purchases made. If all three move together, the phase must change. If prices rise while volumes fall again, the problem is more serious than a temporary pause.
What to watch
Eurostat publishes July construction output on 18 September. It will show whether stronger construction confidence has begun to appear in real activity. August unemployment follows on 1 October and the September flash inflation reading on 2 October. If headline inflation keeps rising while core remains near 2.4%, the debate will be about how long the energy shock lasts. If core moves back above 2.5% too, the risk of broader inflation increases.
August producer prices are due on 5 October, retail sales on 6 October, industrial production on 15 October and goods trade on 16 October. The threshold for changing our phase is testable. If August industrial output rises by more than 0.3% on the month, retail sales turn positive and the PMI stays above 50, there will be a case to move from stagnation to acceleration. If volumes keep falling despite strong surveys, the current classification stands.
Closing
July looks like a car whose engine is revving again while its wheels have yet to grip the road. Business surveys, exports and credit give the eurozone a chance to accelerate. Production and household purchases do not yet confirm it. The new breakdown of the second quarter also demands more humility than our earlier account. Inventories did not drive growth, and net exports did not hold it back. The next real volumes, not the next promises, will decide whether the economy has left stagnation. Meanwhile the ECB must contain inflation without stalling a recovery that has barely begun.
Sources
S&P Global, final eurozone composite PMI for August 2026, including final July comparison
S&P Global, final eurozone manufacturing PMI for August 2026, including final July comparison
Eurostat, July international trade in goods, 15 September 2026
Eurostat, second-quarter GDP and employment, third estimate, 7 September 2026
ECB, September macroeconomic projections and Ireland-adjusted activity measure
Liquidity Desk | liquiditydesk.org