

Global Sector Rotation Snapshot | October 2026
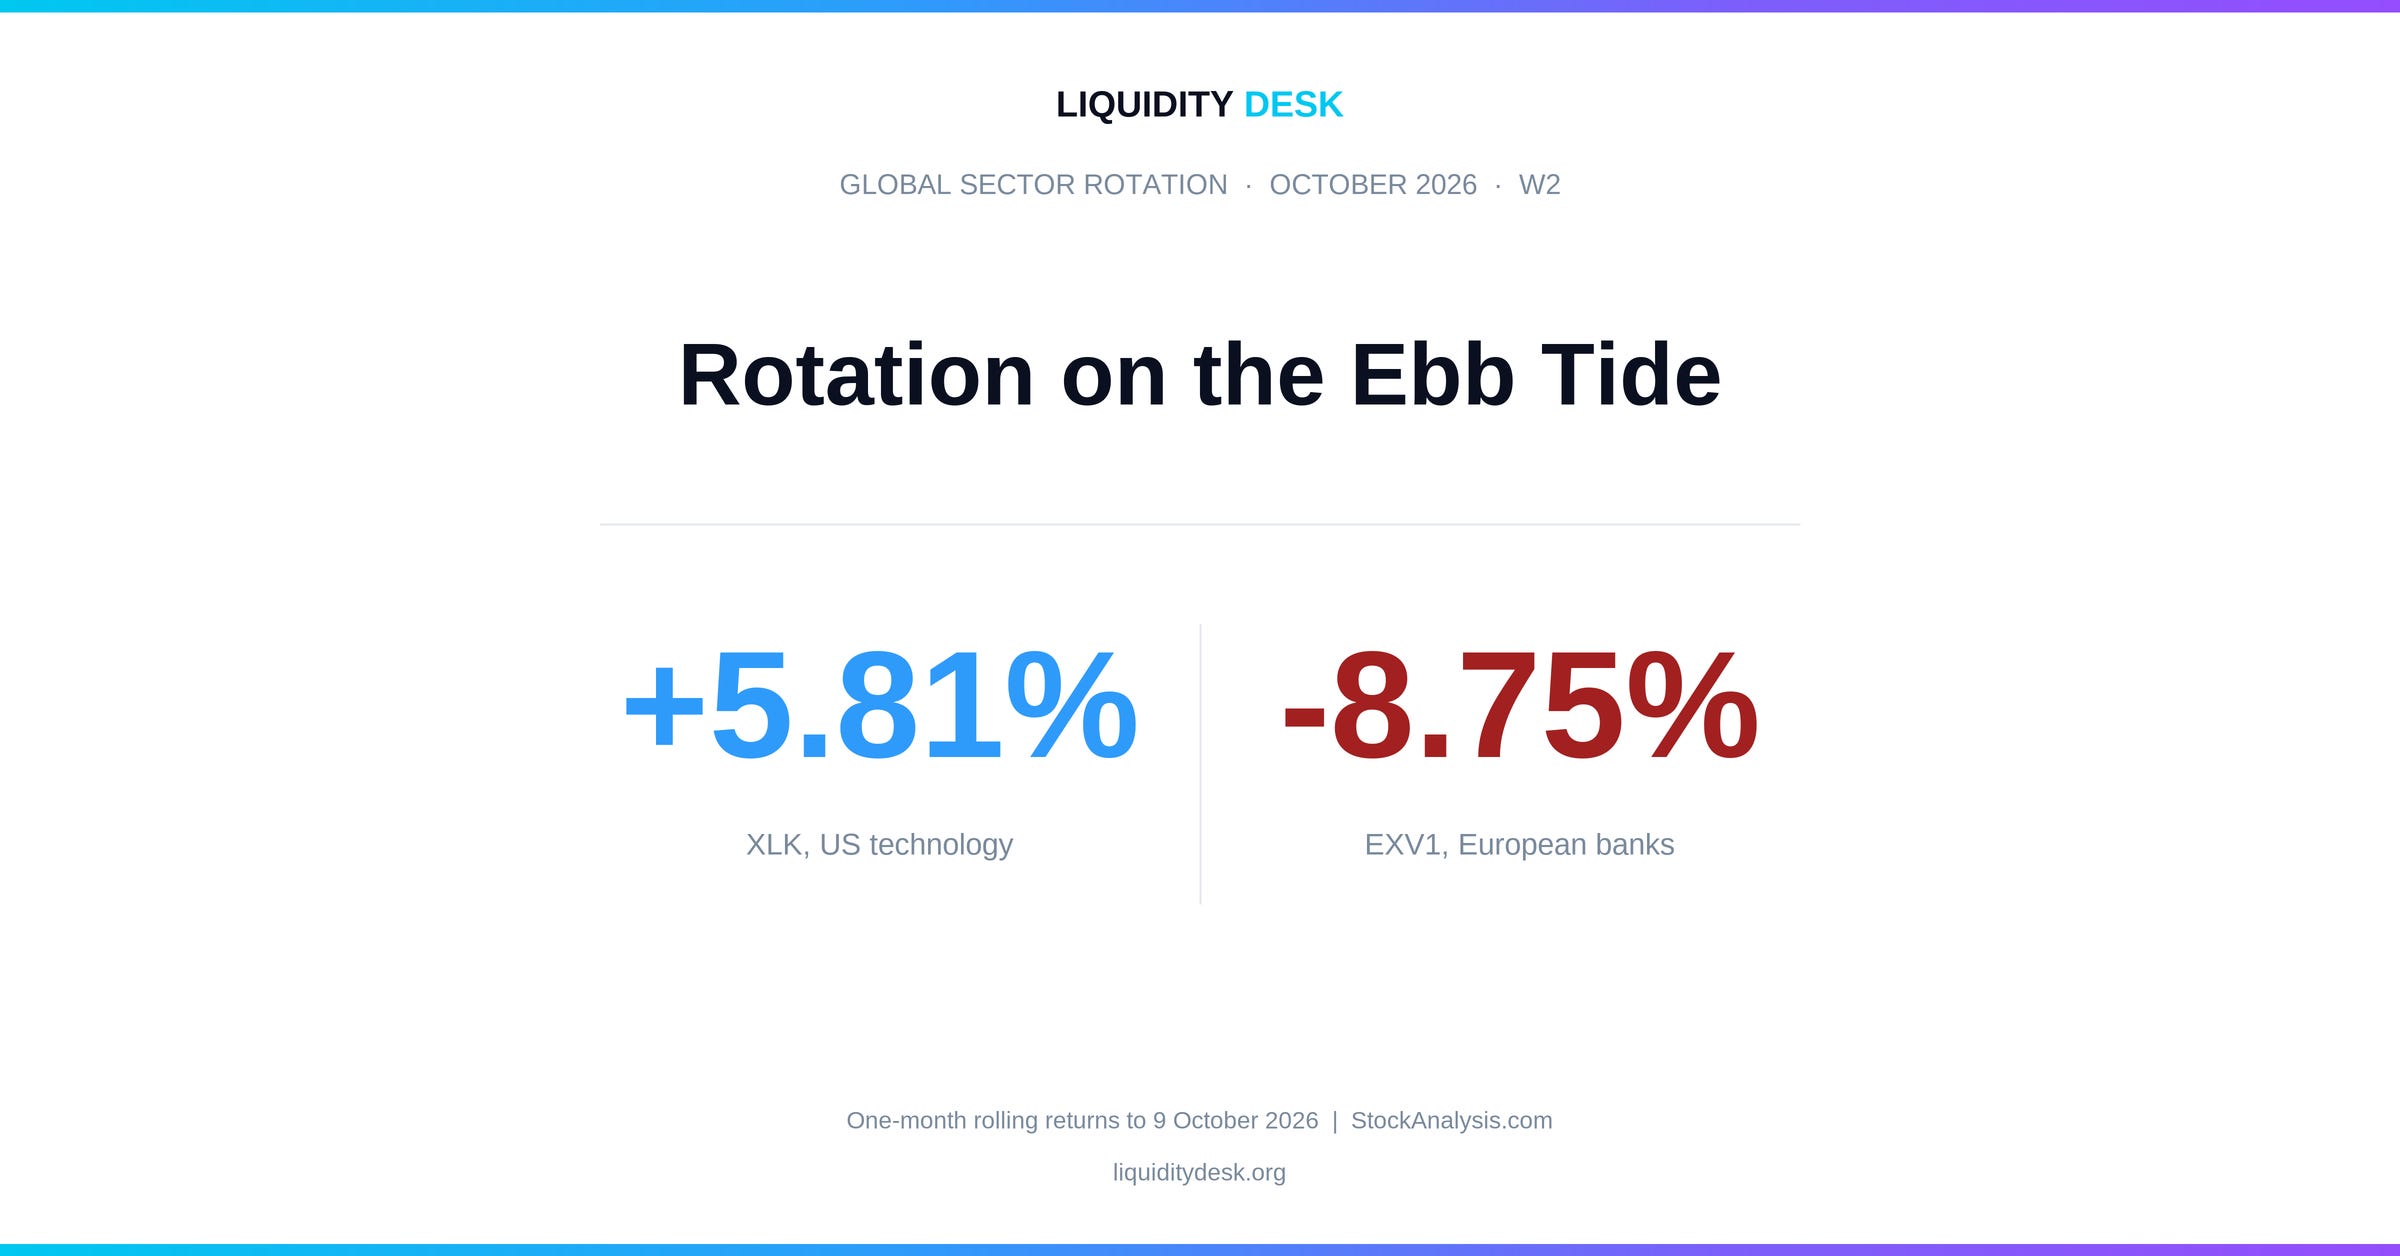
After the narrow market
September showed a narrow market. Capital paid for two sources of profit, energy and Asian semiconductors, and punished almost everything that depends on broad economic acceleration.
Between the two issues, the tide went out. October’s liquidity analysis, The Ebb Tide, described it as water pulling back from every shore at once: the ECB, the Fed and the Bank of Japan raised rates within eight days. The dollar strengthened. The long end in the United States kept rising.
This month the market is not looking for a new theme. It is returning to companies and sectors whose earnings are already proven and do not depend on cheap credit. US and European technology, US health care and Brazil gain. Banks, real estate, carmakers and most emerging markets lose.
The question this month is why banks are falling just as the rates that supposedly feed them are rising, and why South Korea, September’s leader, is among the weakest.
Macro backdrop
The rate environment
Three hikes in eight days. This is what is new in October’s picture, and it sits behind almost every move below.
The Federal Reserve raised its target range by 25 basis points, to 3.75-4.00%, on 16 September, by a unanimous vote. The effective rate is 3.88%. The ten-year yield kept rising, to 5.22% on 8 October from 4.95% on 10 September, with a peak of 5.31% on 5 October. The gap between the two is 1.34 percentage points, almost the same as in September. The market still demands compensation for long-term risk, even after the Fed has acted. The minutes of the meeting point to a new reason as well: heavy debt financing of artificial intelligence infrastructure is competing with the government for the same capital. ECB chief economist Philip Lane said the same in an interview on 6 October.
The European Central Bank raised its deposit rate to 2.50%, effective 16 September. The ten-year German Bund, however, did not keep rising: 3.53% on 9 October, against 3.56% on 11 September. The peak was 3.69% on 28 September, the highest level since April 2011 (see the separate analysis). The reason for the hikes is still energy. According to Philip Lane, euro area inflation is 3.8%, with energy at 18.8% and everything else at only 2.3%.
The Bank of Japan raised its rate from 1.00% to 1.25% on 18 September, by a 7-2 vote, effective 24 September. The average yield at the 30-year Japanese government bond auction on 8 October is 4.109%, against 4.079% on 3 September. The gap to the policy rate narrows to 2.859 percentage points, because the short end is catching up with the long end. This directly affects the carry trade, the practice of borrowing cheaply in yen and investing the money in higher-yielding assets elsewhere. The more expensive the yen loan, the thinner the profit from the trade.
The next test is packed into four days: the Fed on 27 and 28 October, the ECB on 29 October and the BOJ on 29 and 30 October.
The broad dollar
The Federal Reserve’s Broad Dollar Index stood at 121.3848 on 2 October, the latest available date, against 118.0732 on 4 September. That is a rise of 2.80%, after a 0.93% decline in the previous issue.
The direction has reversed, and so has the mechanism. A stronger dollar reduces the dollar value of foreign revenue for US companies and makes dollar debt more expensive for emerging economies. The second channel is clearly visible in Latin America and India. Brazil is the exception, explained in the Latin America section.
Risk appetite
The VIX stood at 15.41 on 8 October, against 17.84 on 10 September. The VIX measures the price of protection against short-term moves in the US equity market. Below 20 signals calm, above 20 greater nervousness and above 30 active fear. Between the two issues it did not close above 20 on a single day. The high was 17.71 on 16 September, the day of the Fed decision.
Three rate hikes, a stronger dollar and oil above $120 do not produce panic. That is the frame for everything below. The declines in banks, real estate and emerging markets are an orderly repositioning, not a flight.
Oil
Oil has two prices, and this month they are further apart than ever. Brent for physical delivery, according to EIA data, was $125.44 on 6 October, against $118.06 on 11 September, with a peak of $135.51 on 2 October. Brent futures, the price quoted in the news, settled at $102.31 on 1 October and at $100.32 on 5 October. The gap between the real barrel and the paper barrel is more than $30.
The reason is that crude is now getting through, but fuel is not enough. According to Reuters, Middle East crude exports rose above pre-war levels on four of the seven days in the last week of September, even though three tankers were struck in the Strait of Hormuz on 29 September. Diesel and other fuels, however, remain in short supply after damage to refineries in the Gulf and in Russia. Russia has halted diesel exports until the end of October, and on 1 October Chinese refiners suspended fuel exports beyond Hong Kong and Macau. The same day brought reports that the United States is sending a third carrier strike group to the region, and that President Trump is weighing new strikes on Iran after the midterm elections. Futures jumped 4.37% in a day. On 2 October the G7 agreed to release 100 million barrels of diesel and crude from emergency stocks over four months.
US WTI moved the other way: $96.24 on 6 October, against $101.27. The shock is no longer in the volume of crude, but in fuel and in the risk of renewed escalation.
United States: Technology returns
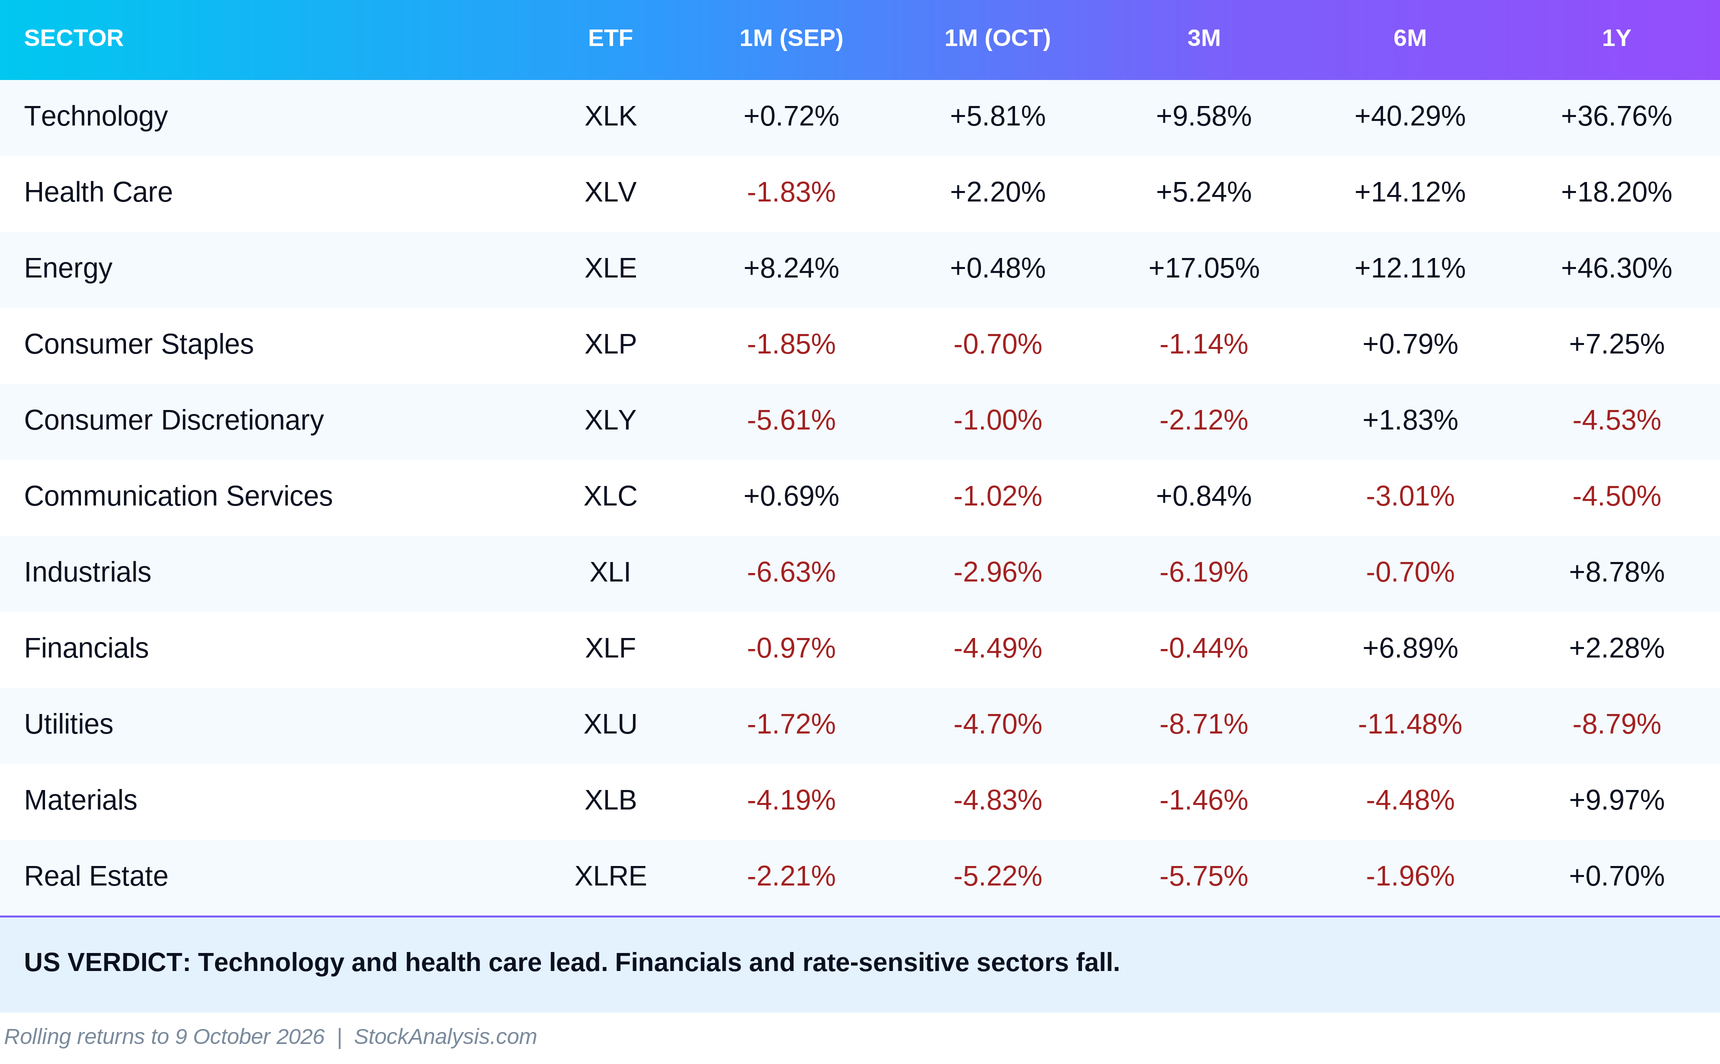
Technology leads again. XLK gains 5.81% for the month after only 0.72% in September. Its six-month return is 40.29%. September’s cooling turned out to be a pause, not a reversal. On an ebb tide, capital returns to the sector whose earnings growth exceeds the yield on bonds.
Health care is second with 2.20%, after minus 1.83% in September. XLV is up 14.12% over six months. The sector has structural support that does not depend on interest rates: ageing populations in the United States, Europe and Japan mean demand for treatment that is locked in for years ahead. When credit becomes more expensive, predictable demand becomes more valuable.
Energy stalls. XLE adds only 0.48% after 8.24% in September, even though physical Brent hit a new high. Its three-month return remains 17.05%. Producer shares no longer follow every new high in the price of the barrel. This is not a reversal. The sector keeps its accumulated strength, but the market no longer pays extra for it.
Financials are the surprise in the bottom half. XLF loses 4.49% even though the Fed raised rates. By the textbook, a higher rate widens banks’ lending margin. But when the long-term rate rises together with the short-term rate, and credit becomes more expensive for everyone, the risks to loan quality rise too. The market is selling banks as lenders exposed to the economy, not as collectors of interest.
Rate-sensitive sectors close the table. Utilities lose 4.70%, materials 4.83% and real estate 5.22%. Utilities and real estate are valued as bond substitutes. With the ten-year yield above 5%, the bond itself offers the yield, without the risk of the share.
RRG: The slower signal
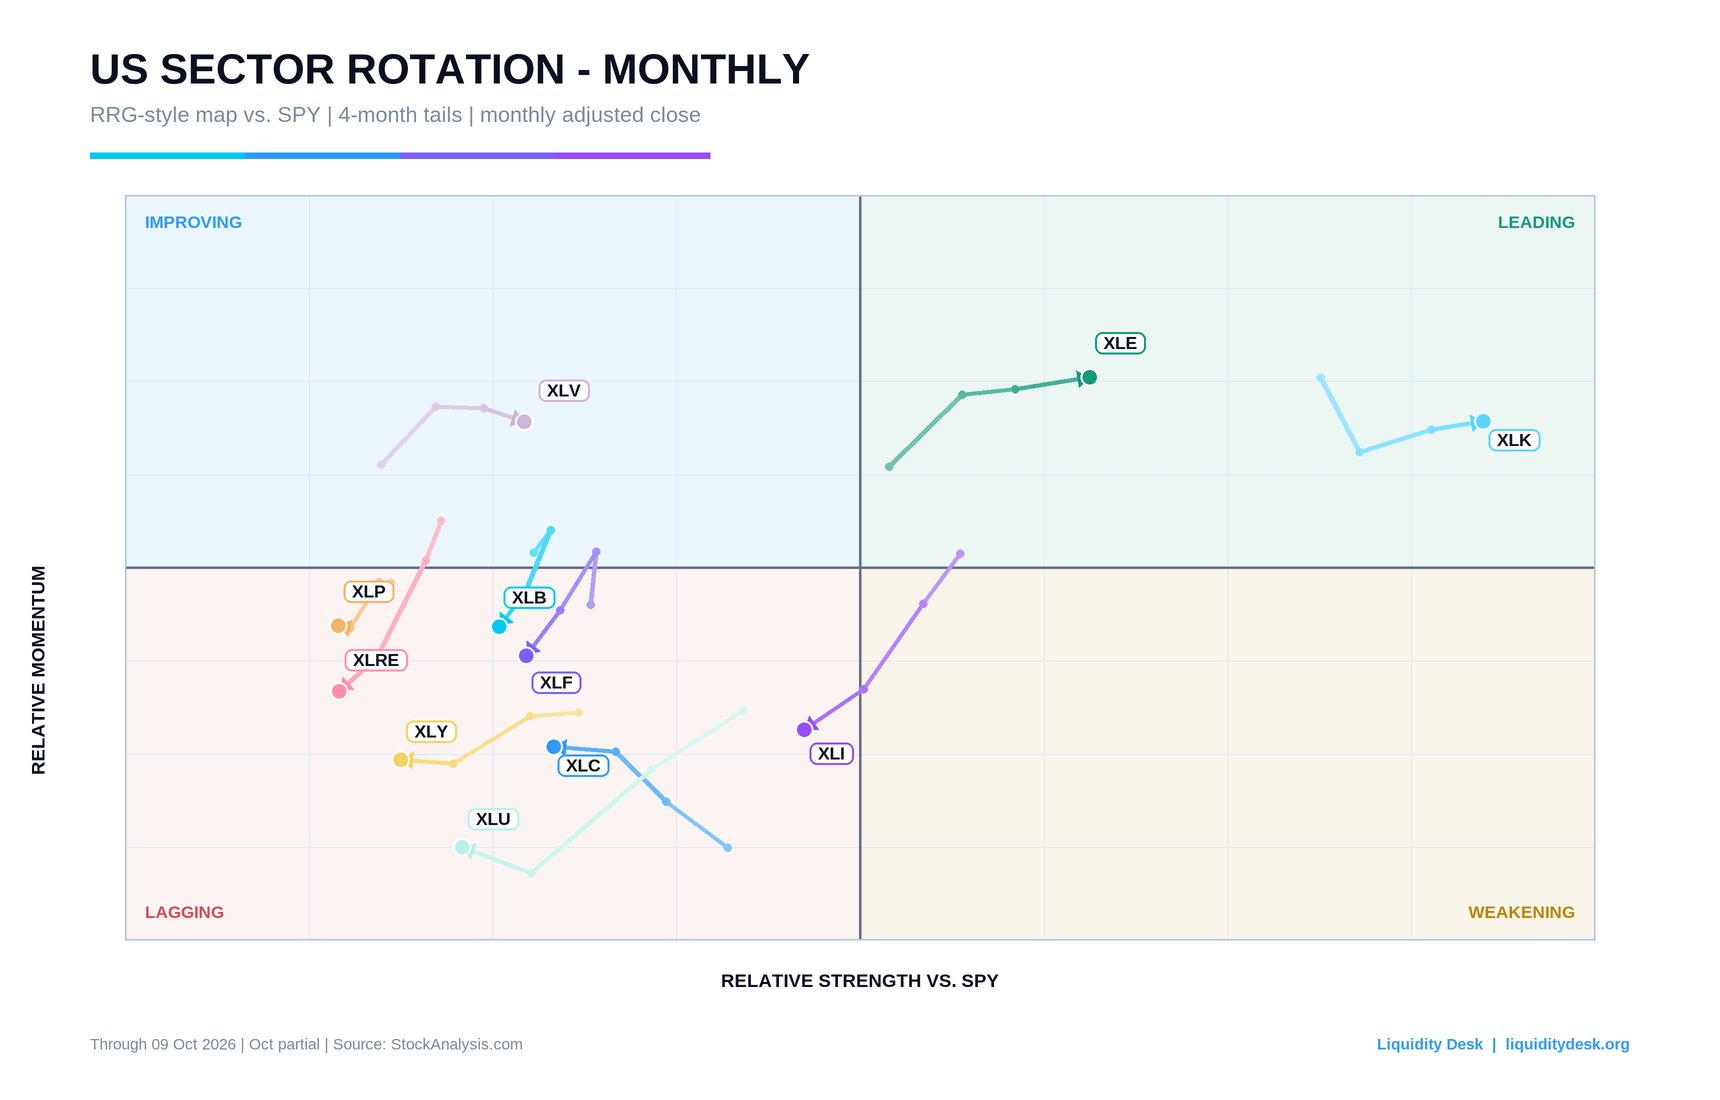
The horizontal axis shows relative strength against SPY, while the vertical axis shows the change in that strength. The upper-right Leading quadrant combines strength with positive momentum. The lower-right Weakening quadrant means a sector remains strong but is losing speed. The upper-left Improving quadrant shows recovery from a weak base, while the lower-left Lagging quadrant combines a weak position with weak momentum.
The map confirms the table. XLK and XLE are in Leading, and both are moving up and to the right. In September technology was losing momentum; now it is gaining it again. XLK remains the sector with the highest relative strength on the map. Energy keeps its direction even though its monthly return is close to zero, because the monthly map tracks a smoothed trend, not a single month.
XLV is the only sector in Improving and is moving to the right, towards Leading. If that direction holds for another month or two, health care will become the third durable leader.
XLI drops from Weakening into Lagging. Industry is losing the last of its relative strength against the market. All other sectors are in Lagging. For XLC, XLP, XLU and XLY the latest step is upward, meaning their momentum has stopped deteriorating, but their relative strength is still weakening. This is an early sign, not a turn.
The RRG does not measure actual money flows. It shows relative performance and the change in that performance. The chart is therefore a map of market preference, not proof that money leaving banks has moved into technology. It is a transparent RRG-style approximation built from the final available weekly adjusted price in each month, not the official proprietary JdK model. The last point is the incomplete October observation through 9 October 2026.
Europe: Technology leads, banks fall
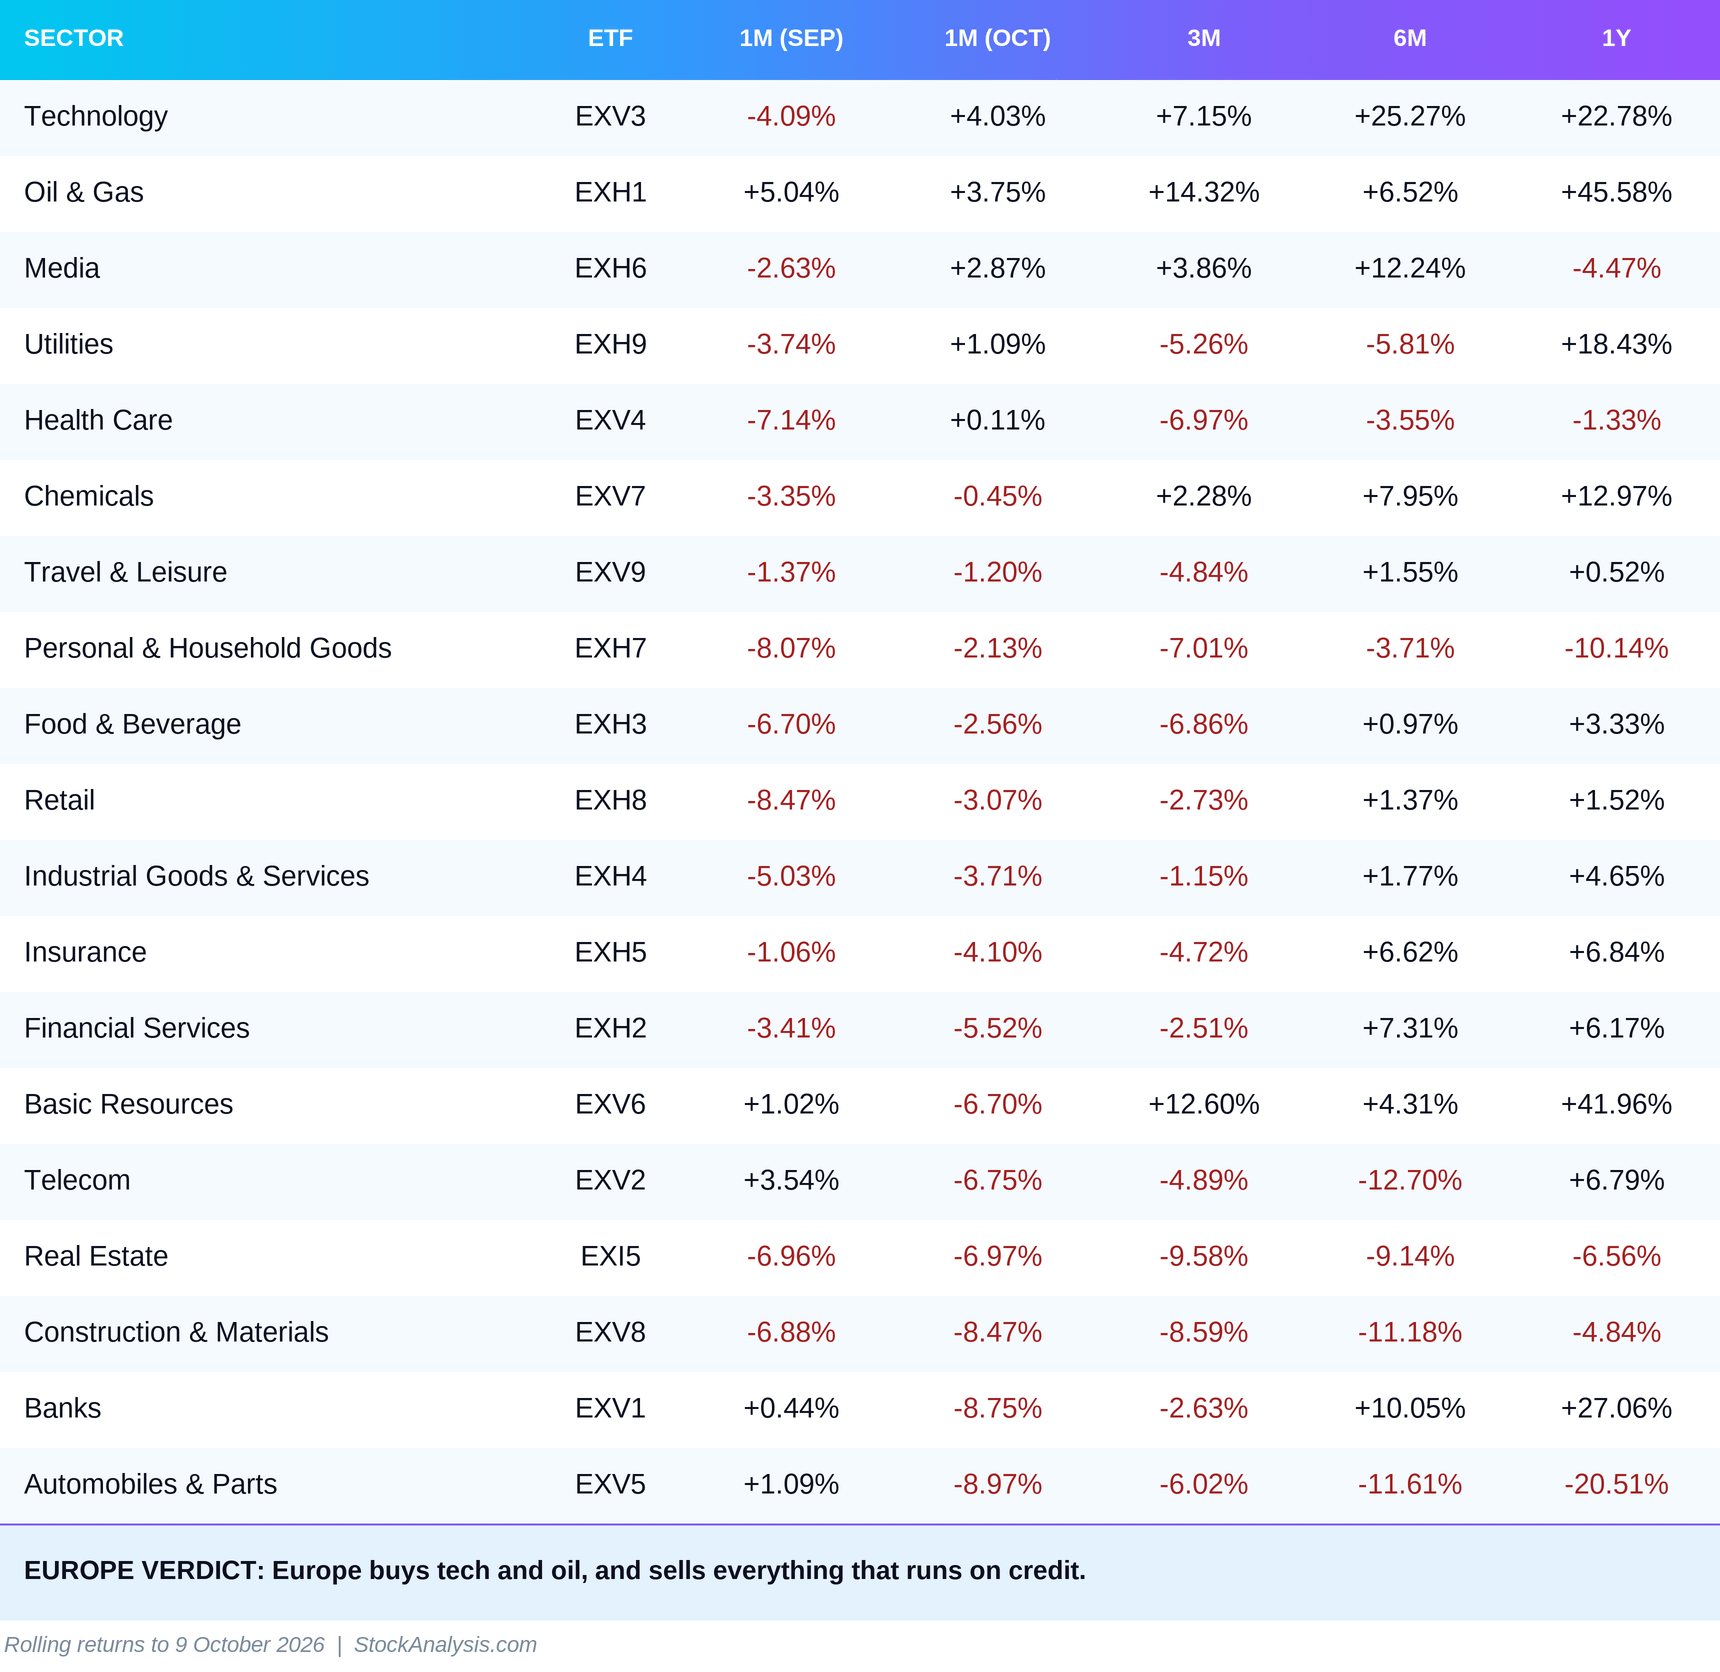
Europe repeats the US reversal, and does so more sharply. Technology swings from minus 4.09% in September to plus 4.03% and leads the European table. EXV3 is up 25.27% over six months. At its core are ASML, SAP and Infineon, directly tied to the global semiconductor and artificial intelligence cycle. European and US technology move together, while South Korea pulls back. There is also a structural reason the sector withstands the hikes. According to an analysis on the ECB blog, firms in the euro area’s most AI-intensive sectors carry less debt and fund themselves more through equity and bonds than through bank loans. The policy rate therefore hits them less than firms that live on bank credit.
Oil and gas are second with 3.75% and stay positive for another month. Here European producers gain more than US ones, reversing September’s picture. EXH1 is up 14.32% over three months. A more expensive Brent matters more for European companies, whose main crude grades are linked to it, than for US ones, which depend more on the cheaper WTI.
Banks are the heaviest signal. EXV1 loses 8.75% after plus 0.44% in September. This is the second-worst result in the table, in exactly the month the ECB raised rates. The six-month return remains 10.05%, because until now higher rates widened banks’ margins. This month the ghost of 2011 returns. The German Bund became a safe haven again, and the yield gap between French and Italian debt and the Bund widened sharply: for France from about 0.85 to 1.27 percentage points between 11 September and 9 October, with a peak of 1.41 on 2 October, and for Italy from 0.85 to 1.11 points (in detail in the separate analysis). European banks hold large amounts of their own governments’ debt. When government debt loses value, banks lose with it. The market is selling not just the margin, but the balance sheet.
The bottom of the table is entirely cyclical and rate-sensitive capital. Carmakers lose 8.97% and remain negative over six and twelve months. Higher consumer credit costs now add to the structural pressure from Chinese competition. Construction falls 8.47% and real estate 6.97%, the second consecutive month with a decline of almost 7%.
Basic resources and telecoms reverse their September gains. EXV6 loses 6.70%, but its three-month return remains 12.60%. This is a pullback after a strong run. EXV2 loses 6.75%, so September’s rebound proved short-lived.
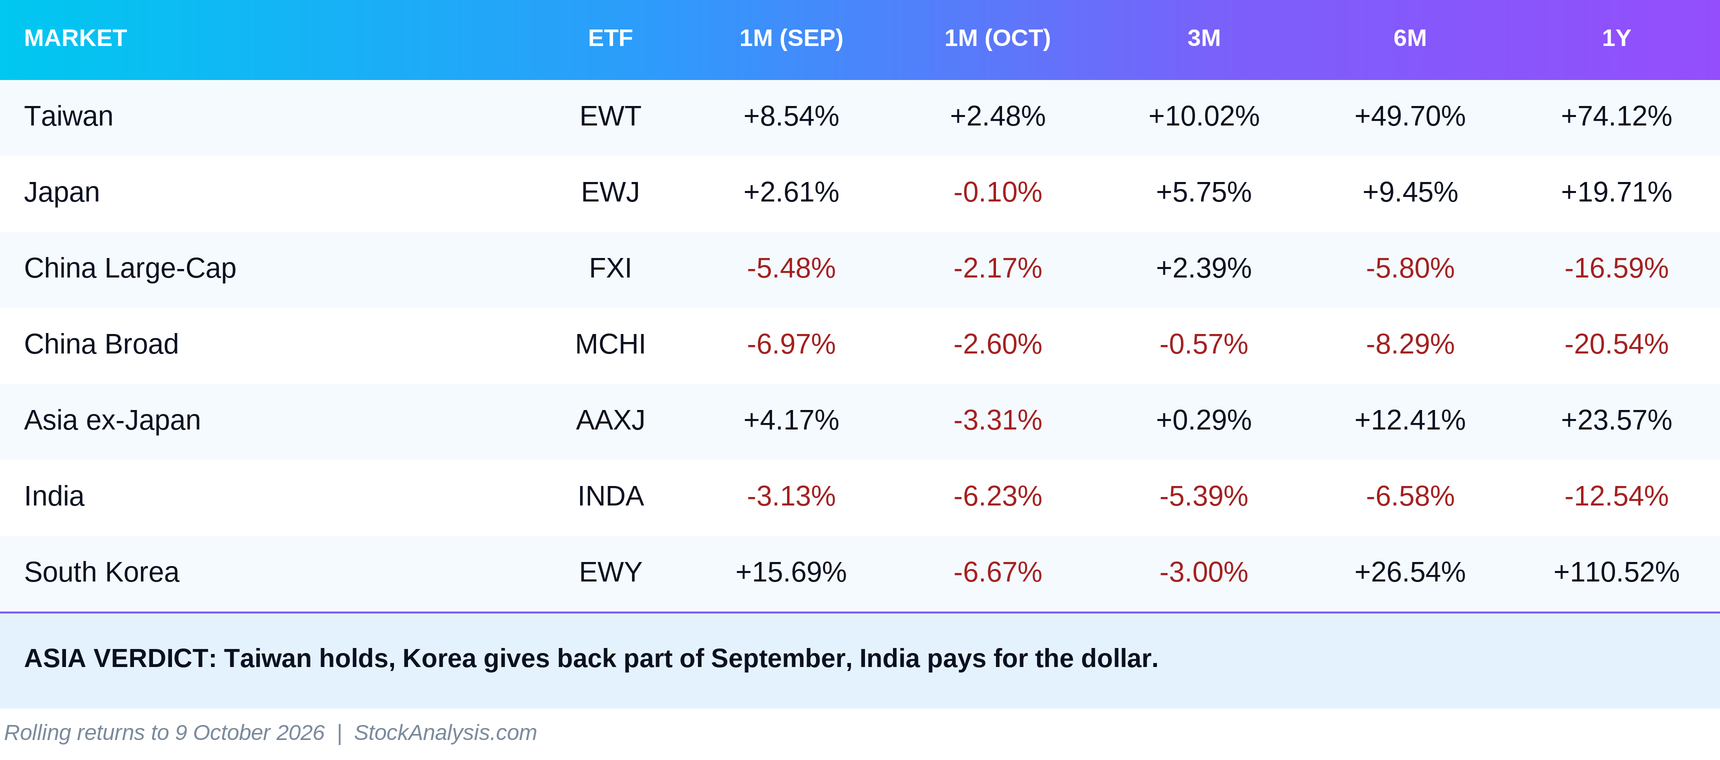
Asia: Korea gives back part of its gain
In Asia, we use country funds rather than sectors. Currencies, regulation and economic cycles differ too widely to fit into one common sector index.
South Korea falls 6.67% after a 15.69% gain in September. This is the weakest result in the region. But EWY remains up 26.54% over six months and 110.52% over one year. The Korean fund is extremely volatile, because almost half of it is Samsung Electronics and SK Hynix, effectively a single position in memory for artificial intelligence. A pullback after a strong run is not the same as structural weakness.
Taiwan stays positive with 2.48% and keeps a six-month return of 49.70%. TSMC and its surrounding supply chain continue to hold the most visible role in capital spending on artificial intelligence.
Japan is almost flat at minus 0.10%. The BOJ’s higher rate narrows the gap to the 30-year yield and makes the carry trade thinner. The Japanese market is not falling, but it is not receiving the new capital it received over the summer. Domestic demand does not help either: the BOJ’s consumption activity index falls 0.6% in the third quarter, based on the July and August averages.
China falls less than in September. FXI loses 2.17% and MCHI 2.60%. On 29 September the People’s Bank of China cut the rate on its one-year collateralised lending to the state development banks from 1.75% to 1.5%, expanded targeted lending quotas and introduced a mortgage subsidy. The measures target specific industries, not the main policy rates. The market reads them as a brake on the decline, not a turn.
India loses 6.23% and is now down 12.54% over one year. A stronger dollar hits hardest the markets that import oil and pay for it in dollars. India is exactly such a market.
Latin America: Brazil against the dollar
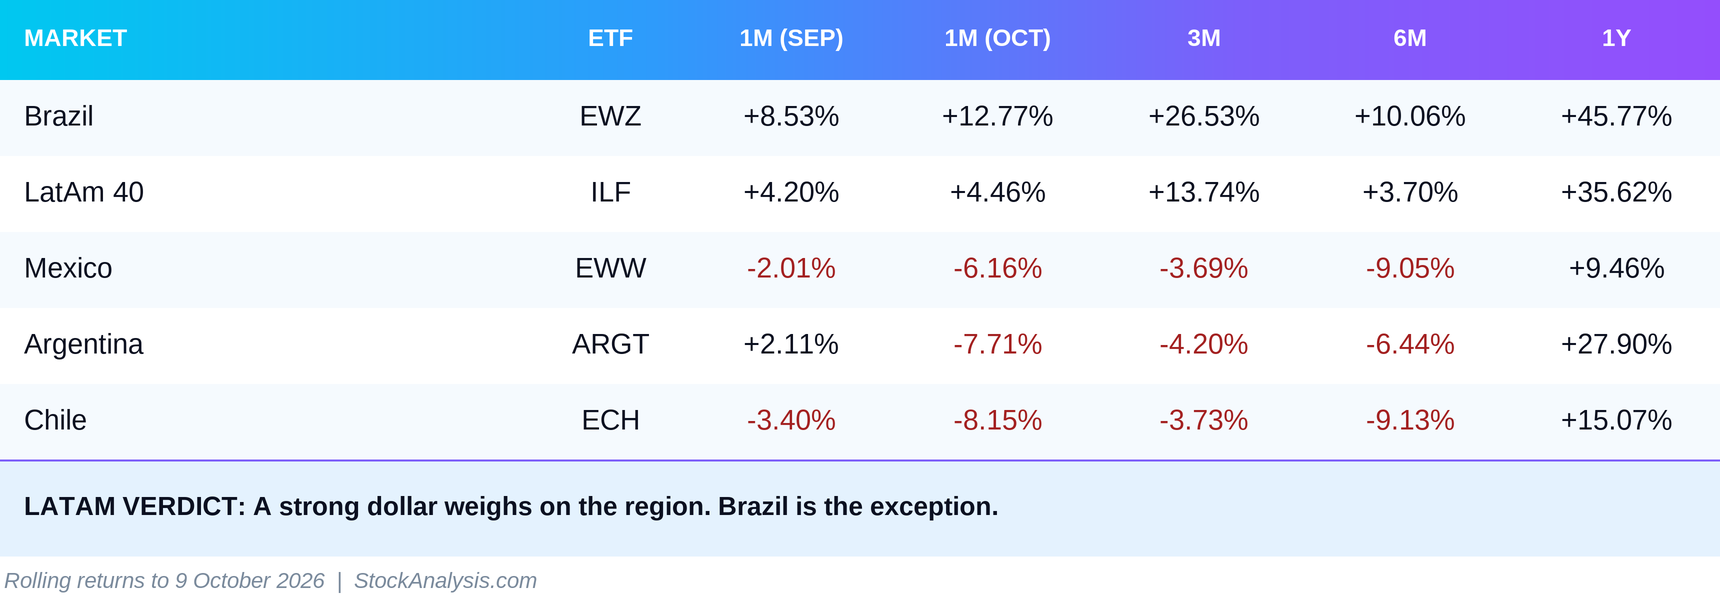
The dollar is the main variable for the region. It works through two channels: it reduces the value of commodity revenue in local currency and makes dollar debt more expensive to service. This month the broad dollar rose 2.80%, and the region reacted almost by the textbook. With one big exception.
Brazil gains 12.77%, after 8.53% in September. EWZ is now up 26.53% over three months. Three things set it apart from the region. First, a cut in the Selic policy rate from 14.00% to 13.75% took effect on 17 September. Brazil is easing while the Fed, the ECB and the BOJ tighten. Second, the real strengthened against the dollar, even though the dollar strengthened against almost everything else. The rate was 4.9892 reais per dollar on 9 October, against 5.0918 on 11 September. The biggest move came on 5 October, the first trading day after the first round of the presidential election.
The election is the third and most important explanation. According to the official results of the Superior Electoral Court (TSE), opposition candidate Flávio Bolsonaro finished first with 47.03% of valid votes, ahead of President Lula with 45.16%. The two go to a runoff on 25 October. The next day the real gained 4.8% against the dollar, the strongest one-day move between the two issues. The market is not waiting for the runoff. It is already pricing the possibility of a change of course. That makes Brazil’s gain fragile: if the runoff reverses the result, part of it could unwind just as quickly.
The regional ILF fund gains 4.46% only because of Brazil’s weight in it. Without Brazil, the picture is clearly negative.
Mexico loses 6.16% and Chile 8.15%. Mexico remains exposed to the US trade cycle, and the stronger dollar adds pressure. Chile is an indirect bet on Chinese industrial demand through copper, and China is not yet signalling a new acceleration.
Argentina loses 7.71% after plus 2.11% in September and is now negative over three and six months. Its reform thesis, built on fiscal consolidation and liberalisation of the currency regime, had so far set it apart from the region. This month it falls with it. A one-year return of 27.90% shows that the accumulated gains are not yet erased.
The rotation signal
Capital is not fleeing. It is returning to proven earnings.
The VIX is 15.41, lower than in September, despite three rate hikes and oil above $120. This is not panic. It is an orderly withdrawal from everything that depends on cheap credit, towards earnings the market has already seen.
The first theme is the return to proven earnings. XLK gains 5.81%, EXV3 4.03% and XLV 2.20%. US and European technology lead together, and health care joins as a second choice. When bonds pay more than 5%, a share with no growth and a dividend below that yield makes no sense. The market pays only for companies whose earnings growth can exceed the safe yield on the bond.
The second theme is that higher rates no longer help banks. XLF loses 4.49% and European banks 8.75%, in the same month the Fed and the ECB raise rates. Until September, higher rates were a driver for banks. When rates rise for long enough, the market starts pricing not the margin, but the borrowers. Real estate, construction and carmakers, the sectors most dependent on credit, fall together with banks on both sides of the Atlantic. In 2011 the same chain from government debt to banks sat at the centre of the crisis.
The third theme is the strong dollar as the regulator of emerging markets. The dollar rises 2.80%, and India, Mexico, Chile and Argentina fall by between 6% and 8%. This is the familiar mechanism in its pure form: more expensive debt and cheaper local revenue.
The quiet signal is Brazil. The only large economy in the analysis that cut rates is also its strongest market. EWZ gains 12.77%, and the real strengthens against a strong dollar. If Brazilian easing continues while others tighten, the rate differential will keep attracting capital.
Energy remains at a high level, but stops accelerating in the United States. Physical Brent set a new high, while XLE added only 0.48%. The market has already paid for the energy shock and is not paying twice.
The next week of truth is 27 to 30 October, when the Fed, the ECB and the BOJ decide within four days. If all three tighten again, the market’s choice will become narrower still. If they pause, the first confirmation of a rising tide should come from banks and industry, the two sectors that lost the most this autumn.
Data and sources
ETF performance: StockAnalysis, retrieved on 10 October 2026. Values are rolling returns to the close of 9 October, as displayed by the source.
FOMC decision of 16 September 2026: Federal Reserve. Minutes: FOMC Minutes. Calendar: FOMC calendar.
Federal Reserve effective rate and ten-year yield: FRED DFF and FRED DGS10.
Broad Dollar Index: FRED DTWEXBGS.
VIX: FRED VIXCLS.
Brent and WTI spot, EIA: FRED DCOILBRENTEU and FRED DCOILWTICO.
Oil market, 1 and 5 October 2026: Reuters, Oil jumps 4% on reports China halts fuel exports, US troops head to Middle East and Oil slips as Middle East crude exports rise, G7 to release stocks.
ECB decision of 10 September 2026: European Central Bank. Calendar: ECB.
Philip Lane, 5 and 6 October 2026: speech and interview with ANSA.
ECB blog, 6 October 2026: Funding the AI revolution: evidence from euro area sectors.
Ten-year German government bond yield: Deutsche Bundesbank.
Spreads against the Bund: France approximated as the Banque de France TEC10 yield minus the Bundesbank curve; Italy from ANSA daily closes (8 October via SoldiOnline). In detail: Rate Hikes Don’t Open Hormuz.
Bank of Japan decision of 18 September 2026: BOJ. Calendar: BOJ meeting calendar. Consumption activity index: BOJ.
30-year Japanese government bond auctions of 3 September and 8 October 2026: Japan Ministry of Finance and Japan Ministry of Finance.
People’s Bank of China measures of 29 September 2026: PBOC.
Selic and USD/BRL: Banco Central do Brasil, SGS 432 and SGS 1.
Brazil presidential election, first round of 4 October 2026: Tribunal Superior Eleitoral, official results.
Monthly RRG-style methodology and numerical verification: Liquidity Desk calculations using the final available weekly adjusted price in each month for SPY and the 11 US sector ETFs.
Liquidity Desk | liquiditydesk.org