The geopolitical shock and the return of the inflationary regime

Why the history of stocks and bonds is written in regimes, not in years
INTRODUCTION
In October 2022, something unusual happened to the portfolios of millions of investors around the world. It was not just equities that fell. Bonds fell too. Simultaneously. Over the course of one year, the S&P 500 lost nearly 20%, while long-duration US Treasuries, as measured by the TLT ETF, lost over 30%. The instrument that had served for decades as insurance against equity drawdowns collapsed harder than equities themselves.
For investors who had entered the market after 2000, it was a shock. For those familiar with market history before 1990, it was something else entirely: a deeply familiar feeling.
Markets have memory. Not in the sense that history repeats exactly. But in the sense that macro regimes return. And we may be at the beginning of exactly such a return.
THE FRAMEWORK OF JOHN MURPHY
John Murphy is one of the few market analysts who studies not just the movement of individual assets, but the relationships between them. In his book Intermarket Analysis, he describes something that most modern investors take for granted but that is, in fact, a historical exception: that stocks and bonds move in opposite directions.
Murphy shows that this inverse relationship is not a law of nature. It is the product of a specific macro regime that took hold in the late 1990s and dominated the following two decades. Before that, for more than thirty years, stocks and bonds frequently fell together. The reason is simple: when the market's primary fear is inflation rather than growth, the two assets share the same enemy.
The distinction Murphy draws is as follows. In an inflationary environment, the primary risk to a portfolio comes from the price of money. When inflation rises, central banks raise rates, bond yields climb, bond prices fall, and equities suffer from a higher discount rate. Both assets face the same pressure. Their correlation is positive: they fall together.
In a disinflationary environment, the logic reverses. The primary risk is no longer inflation but growth. When the economy slows, equities fall, but the central bank has room to cut rates. Bonds appreciate. They become the natural safe haven. The correlation between stocks and bonds turns negative: when one falls, the other rises. It is precisely this logic on which the 60/40 portfolio, as we know it today, is built.
The key point is that this shift is not a technical footnote. It is a change in the entire macro regime.
THREE PERIODS
Period One: The Inflationary Regime (1965 – 1997)
To understand what an inflationary regime means in practice, one number is enough: the yield on 10-year US Treasuries reached nearly 16% in September 1981. Not because the economy was exceptionally strong. But because inflation had spiraled out of control and the Fed under Paul Volcker was forced to break expectations with record-high interest rates.
The path to that moment began in the mid-1960s. The combination of Vietnam War spending, the social programs of the Great Society, and two successive oil shocks in 1973 and 1979 created an environment in which inflation was structural, not temporary. During this period, stocks and bonds did not move as opposing forces. They moved as assets with a common enemy: higher interest rates. When inflation accelerated, yields rose, bond prices fell, and equities came under pressure from a higher discount rate and compressed margins.
The classic example is 1969: the S&P 500 lost around 11% while long-duration bonds simultaneously suffered from rising yields. Then 1973-74: the S&P lost nearly 48% amid the oil shock and stagflation, while bonds offered no real protection because inflationary risk dominated. Then 1977-78: simultaneous pressure on both assets again.
This is the world in which the 60/40 portfolio does not work as diversification. Bonds do not put out the fire in equities. They burn alongside them.
Period Two: The Disinflationary Regime (1990 – 2021)
The history of the disinflationary regime does not begin with a single event. It begins with two, separated by seven years, that together created the conditions for the longest and most stable market environment in modern history. But to understand how this regime was born, we need to take one step further back.
To understand the origins of the disinflationary regime, we must start with Volcker. When Paul Volcker raised interest rates to nearly 20% in the early 1980s, he broke inflation. But the side effect was a massively strong dollar. The DXY, the US Dollar Index, reached its all-time historical peak of around 164 in 1985.
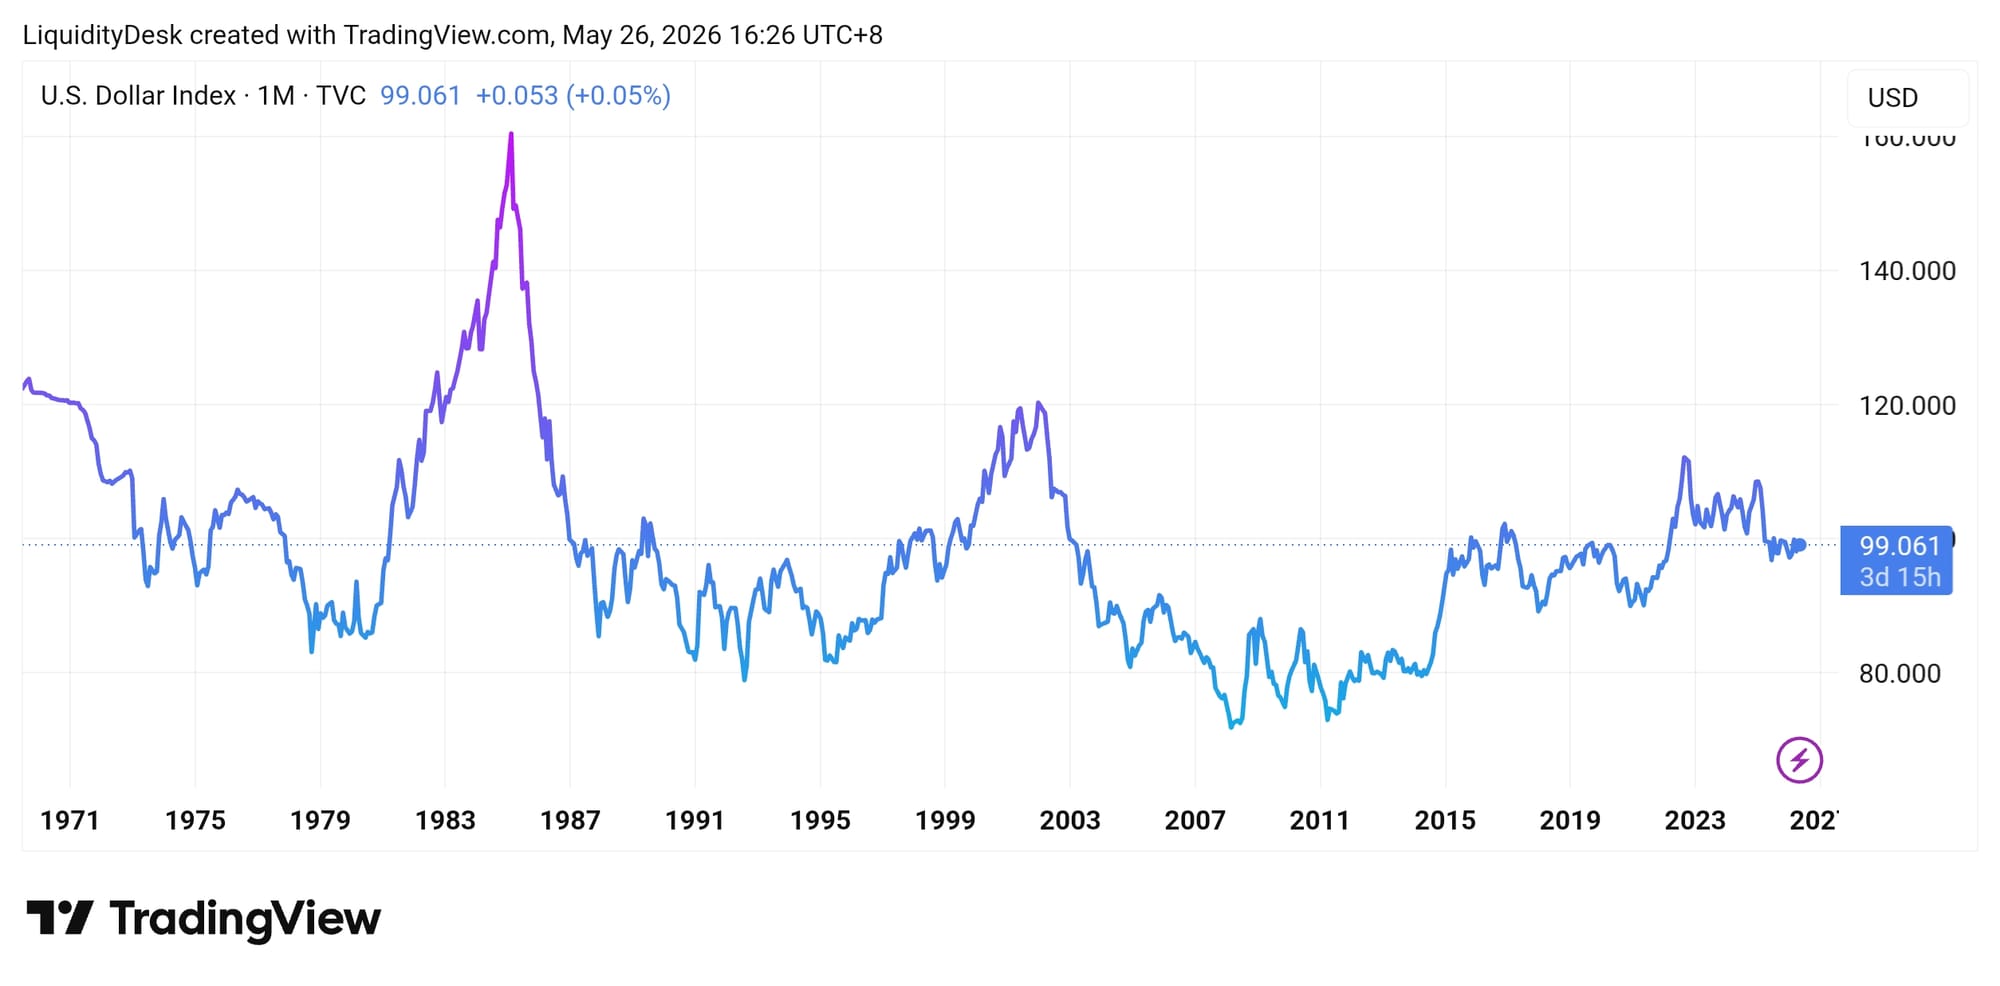
The dollar had become so strong that developing economies carrying dollar-denominated debt were under enormous pressure. The response came in September 1985 with the Plaza Accord: the G5 agreed to deliberately devalue the dollar, forcing a sharp appreciation of the yen. In response, Japan leaned into domestic monetary easing and credit expansion, which helped inflate one of the largest real estate and equity bubbles in modern history. When the Bank of Japan tightened policy in the late 1980s, the bubble burst. Volcker had cured inflation. But the medicine had sown the seeds of the next regime.
The first event is Japan. In 1990, the Japanese equity bubble burst. This was not an ordinary bear market. It was the beginning of a 13-year decline that gradually became a deflationary spiral in what was then the world's second-largest economy. The Japanese economy entered a regime in which prices fell, growth stalled, and the central bank lost its ability to stimulate through conventional tools. Western central bankers studied the Japanese deflationary model with growing anxiety, searching for ways to prevent the same from happening in their own economies.
The second event is the Asian financial crisis of 1997-98. The collapse of the Thai baht triggered a chain reaction in South Korea, Indonesia, Malaysia, and Hong Kong. But the market effect extended far beyond Asia. The crisis sent a powerful deflationary impulse into the global economy: cheap Asian goods and devalued currencies flooded world markets, pushing prices down. Murphy calls this the "Asian contagion" and argues that more than any other single factor, it was this that changed a key intermarket relationship.
Until 1998, the word "deflation" had not been heard seriously since the 1930s. After 1998, it began to define the logic of markets.
This is where the "decoupling" Murphy describes takes place: the normal relationship between bonds and equities disappears and reverses. Until this point, the two assets had generally moved in the same direction because they shared a common enemy: inflation and interest rates. After 1998, they began moving in opposite directions. Bonds became a refuge precisely when equities were suffering.
It is important, however, to draw a distinction that Murphy emphasizes explicitly. Disinflation, meaning the slowing of inflation, is good for both bonds and equities. Interest rates fall, bond prices rise, and equities perform well as long as the economy is still growing. But when falling rates are a symptom of economic weakness rather than strength, the picture changes. This is precisely what we see in the two bear markets of 2000 and 2007: bond yields fell, but equities fell alongside them rather than in the opposite direction.
Within the disinflationary regime that consolidated after 1998, the 60/40 portfolio performed exceptionally well. Inflation remained low and controlled. The Fed had room to cut rates at every shock. The policy put was real and predictable. In every crisis, 2001, 2008, 2011, 2015, even 2020, bonds appreciated when equities fell. The negative correlation looked like a law of nature. For an investor who entered the market after 2000, it simply was. It had always been. And it always would be.
Until 2022 arrived.
Period Three: The Return? (2022 – Present)
To understand why 2022 was not an accident, we need to look back not years but decades. Because the conditions that produced the inflationary regime of the 1960s and 70s reproduced themselves in a strikingly similar form.
In the 1960s and 70s, the combination was: massive fiscal expansion through Vietnam War spending and the Great Society social programs, monetary policy that financed those deficits, and two successive oil shocks in 1973 and 1979 that added powerful supply-side inflationary pressure. The result: inflation was not temporary. It was structural.
Now look at the period after 2008. The financial crisis forced the Fed to expand its balance sheet from roughly $900 billion to over $4.5 trillion through QE1, QE2, and QE3. Rates stayed at zero for nearly a decade. Then came Covid: the Fed's balance sheet jumped to nearly $9 trillion in a matter of months, governments deployed trillions in fiscal stimulus, and global supply chains snapped simultaneously. Then came Ukraine and the energy shock.
The parallel is not coincidental. In both cases, the same combination: prolonged monetary and fiscal expansion followed by an external supply shock. The difference is only in the instruments. In the 1960s, direct money creation for war and social programs. After 2008, zero rates and QE for a decade, followed by fiscal bazookas during Covid. The mechanism is identical. So is the result.
And here lies the deep irony of macro regimes. Bernanke and the post-2008 Fed had studied the Japanese deflationary spiral precisely in order not to repeat it. QE1, QE2, and QE3 were a direct response to the lesson from Japan: when facing deflationary risk, do not hesitate, act aggressively, and provide liquidity. Zero rates for a decade were a deliberate choice against deflation. They worked. Deflation did not happen. But zero rates for a decade inflated new bubbles, created structural dependency on cheap money, and left the system without a buffer when the supply shock hit. Bernanke cured deflation. But the medicine sowed the seeds of inflation. Every regime carries within it the embryo of the next.
2022 was the first serious warning that the regime may have changed. For the first time in decades, investors saw a simultaneous decline in both stocks and bonds of real magnitude: S&P 500 minus 19%, TLT minus 31% within a single calendar year. It was not a technical anomaly. It was the logical consequence of inflation not seen in advanced economies for 40 years, and a Fed forced to respond with the fastest tightening cycle since the Volcker era.
The question now is not whether 2022 was an accident. The question is whether the structural disinflationary forces of the past three decades are still strong enough. Globalization is reversing. Geopolitical fragmentation is raising supply chain costs. Asian demographics no longer produce the same deflationary pressure. Energy insecurity around the Strait of Hormuz adds structural inflationary risk.
We are not saying we are returning exactly to 1975. We are saying something more precise: the structural conditions that made disinflation almost automatic are weakening. And in such an environment, the correlation between stocks and bonds may shift back toward positive territory, just as it was before 1997.
Stock-Bond Correlation Across Regimes
THE TRANSMISSION MECHANISM AND THE CURRENT CRISIS
Geopolitical shocks do not move markets by themselves. Markets move from the liquidity and inflationary response to those shocks. The same geopolitical shock can have an entirely different market impact depending on the macro regime in which it occurs.
If the shock occurs in a disinflationary environment, where inflation is low and the central bank has room to respond, the market treats it as a recessionary risk. Equities fall, bonds rally, the Fed cuts rates. The classic risk-off. This is precisely how most geopolitical crises played out after 1998.
If the shock occurs in an environment where inflation is already elevated and the central bank lacks the same freedom, the logic changes fundamentally. The market no longer asks only "how large is the shock?" It asks "will this shock force central banks to remain more hawkish than investors expected?"
This is precisely the second situation we now face.
The mechanism can be described as a sequential chain: tension around the Strait of Hormuz pushes oil and energy prices higher. Higher energy feeds directly into headline inflation. Headline inflation pushes inflation expectations higher. Higher inflation expectations push nominal bond yields higher. Higher yields push bond prices lower. And higher yields compress equity multiples, because the discount rate rises.
This is the chain that makes the current situation different from ordinary risk-off. In a classic risk-off shock, investors sell equities and buy bonds. That logic works only when the shock is deflationary in nature: banking stress, a consumption collapse, recessionary risk. Then the market expects the central bank to cut rates and bonds benefit.
An energy shock from the Middle East is different in nature. It can simultaneously depress real growth and push headline inflation higher. This is the uncomfortable combination: the economy weakens, but inflation prevents the central bank from responding aggressively. The result is stagflationary logic: equities suffer from weaker growth and higher costs, while bonds suffer from higher inflation expectations and a higher term premium. Both sides of the 60/40 portfolio are under pressure simultaneously.
This is the moment when the market begins to fear not simply high oil prices, but something deeper: the loss of the policy put. In the disinflationary regime of recent decades, investors had grown accustomed to the idea that at every sufficiently large shock, the central bank would cut rates, provide liquidity, and stabilize the system. That insurance worked because inflation was low and the Fed had room to act.
In an inflationary supply shock, that insurance disappears. The central bank may see deteriorating growth, but if inflation expectations are rising, it does not have the same freedom to respond. It is forced to hold rates high or even speak more hawkishly to prevent second-round effects on wages, prices, and expectations. This is precisely the regime Murphy describes as inflationary: when the market's primary fear is not growth but the price of money.
THE DATA IS ALREADY MOVING IN THIS DIRECTION
Everything described above is not theory. The data from recent months paints a picture that is difficult to ignore.
Start with inflation expectations. Not the official CPI, but what households and markets expect to happen over the next five years. The Michigan Survey, one of the most closely watched indicators of long-term inflation sentiment in the US, registered 5-year expectations of 3.9%. One-year expectations for the eurozone reached 4%. These are not noisy short-term reactions to an oil shock. Long-term expectations move slowly and are sticky. When they move higher and hold, the market sends a clear signal: confidence in central banks' ability to return inflation to target is being depleted.
Then look at producer prices. US PPI rose 6.0% year-on-year in April 2026, with a 1.4% monthly increase marking the fastest one-month rise since March 2022. Japanese producer prices show a similar trajectory. European ones too. Producer prices matter because they are a leading indicator: what enters production today exits as consumer inflation tomorrow. The chain has not finished transmitting.
Then look at the long ends of bond markets around the world. The yield on 30-year UK gilts stands at 5.82%. Australian equivalents are at 5.51%. Japanese 30-year bonds, traditionally the symbol of the deflationary era, now yield 4.00%, having risen by more than 100 basis points over the past year alone, the sharpest move among developed economies. This is not an American problem. It is a global repricing of long-term inflationary and fiscal risk.
And finally, perhaps the most important signal comes not from the data but from the people who manage the money. Mohamed El-Erian, chief economic adviser at Allianz and one of the most closely followed macro voices in the world, published a direct thesis in the Financial Times at the end of May 2026: investors can no longer rely on the policy put. For three decades, central banks intervened at every instance of market stress, not only at systemic crises but at ordinary selloffs. This practice built a deep market psychology in which volatility was perceived not as a signal of a fundamental problem but as an automatic buying opportunity. Now, El-Erian argues, the equation has changed. The inflationary reality places central banks before a stark choice: stabilize financial assets or protect their long-term credibility. In an inflationary supply shock, the two cannot happen simultaneously.
Taken together, these data points do not prove we are in a new inflationary regime. They prove something more precise: the market no longer takes the disinflationary regime for granted. And when the market stops taking something for granted, its behavior changes before the official data confirms it.
THE PRACTICAL CONCLUSION FOR PORTFOLIOS
The biggest mistake an investor can make in this environment is the mechanical assumption that bonds always diversify equities. That assumption is not a universal truth. It is the product of a specific macro regime that dominated from 1998 to 2021. Within that regime, it worked perfectly. But the regime in which it worked may no longer be in place.
The key question for any portfolio right now is not "how many bonds should I hold?" The question is "which risk dominates right now: inflationary or growth?"
If the market is trading recessionary fear, falling growth, and anticipated rate cuts, long duration works. Bonds appreciate, the correlation with equities remains negative, and 60/40 performs well. This is precisely how the crises of 2001, 2008, and 2020 played out.
If the market is trading an energy shock, sticky inflation, and higher-for-longer, long duration may increase the drawdown rather than reduce it. Equities suffer from weaker growth and compressed margins, while bonds suffer from higher inflation expectations and a rising term premium. Both sides of the 60/40 portfolio are under pressure simultaneously. This is precisely how 1973-74 and 2022 played out.
This means that the stock-bond correlation is not a parameter set once and forgotten. It is an indicator of the macro regime. When it shifts toward positive territory, the market is sending a signal: I am no longer afraid only of growth. I am afraid of inflation, interest rates, and the reaction of central banks.
What should an investor specifically monitor? Three indicators provide the earliest signal of the regime's direction. The first is break-even inflation expectations, meaning the spread between nominal and real yields on TIPS bonds. When these expectations rise persistently, the market is pricing inflationary risk, not growth risk. The second is term premium, the additional compensation investors require for the risk of holding long-duration bonds. When term premium rises, the market does not believe inflation will return quickly to target. The third is the movement of the long end globally. When UK, Japanese, and Australian long-duration bonds move in the same direction simultaneously, that is not local noise. It is a global regime signal.
FINAL THESIS
John Murphy describes a regime change not as a catastrophic event but as a gradual shift in the logic of markets. First, anomalies appear, correlations that do not behave as investors expect. Then the anomalies become more frequent. Then the new logic establishes itself as the norm, and the next generation of investors takes it for granted.
We are living in a moment when the anomalies are already visible. 2022 was a warning. The global rise in long-duration yields is a continuation. Inflation expectations stuck above target are a confirmation. The loss of the policy put is the consequence.
The current crisis around Hormuz matters not because every geopolitical shock automatically collapses markets. It matters because it arrives at a moment when structural disinflationary forces are weakening, inflation expectations are already becoming unanchored, and central banks do not have the same freedom to respond that they had between 1998 and 2021.
If the shock remains contained, oil normalizes, and inflation returns to target, the market may return to disinflationary logic. Bonds will work again as a hedge. 60/40 will perform well.
But if the shock keeps energy elevated, inflation expectations continue rising, and central banks remain hawkish for longer than expected, then bonds will not be the automatic protection against equity drawdowns. They will be part of the problem itself.
This is the essence of what Murphy describes: the relationship between stocks and bonds is determined by the market's primary fear. In a disinflationary world, the fear is growth. In an inflationary world, the fear is the price of money. And when the price of money rises, both bonds and equities can fall together.
The shock is not dangerous in itself. It is dangerous if it transforms geopolitical risk into an inflationary regime. Then the old rules stop applying. And investors accustomed to the logic of the past twenty-five years will have to learn something that the generation before them knew very well.