Liquidity Snapshot | June 2026
Introduction
In the last edition, we closed with the image of an open wound in the global economy. The Strait of Hormuz. A disruption that had not ruptured completely but was not healing either. Three weeks later, the answer is: it is still there. But the body is healthy enough, for now, to absorb the damage.
Global liquidity is no longer contracting in unison. Quantitative tightening in the United States ended in December. M2 is at a new record high in almost every major economy. Bank credit is expanding. Credit spreads, the additional compensation investors demand for taking on risk, remain tight. Volatility is contained.
But liquidity is not flowing evenly everywhere. It reaches markets unevenly, concentrates in specific sectors and regions, and depends on conditions that can change. The question is not whether the system is functioning today. The question is how long those conditions hold while the inflammation continues to smolder.
Block 1: Central Banks
1.1 United States - QT Has Stopped, But Inflation Does Not Allow a Clean Easing Cycle
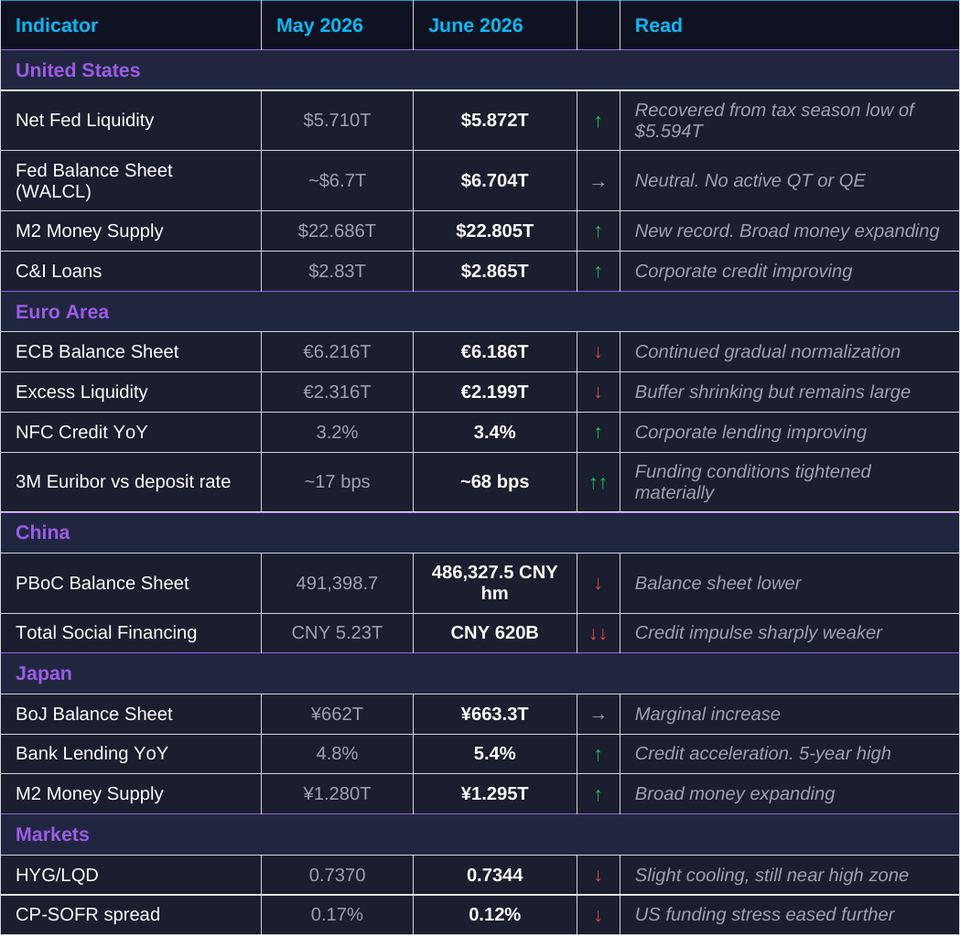
The Federal Reserve held its policy rate at 3.75%. Quantitative tightening, the active withdrawal of liquidity through balance sheet reduction, was stopped in December last year. The balance sheet stands at approximately $6.704 trillion, essentially unchanged week on week.
This is an important shift in regime: the Fed balance sheet is no longer a mechanical source of liquidity drain. But it does not mean a clear path to easing.
CPI accelerated to 3.8% year on year in April, above the consensus of 3.7% and above the prior reading of 3.3%. Core PCE, the measure the Fed monitors most closely, is at 3.3%. These numbers leave the central bank in a waiting mode: it cannot ease because inflation does not permit it, and it cannot tighten because the economy does not require it.
After the end of QT, the short-term driver of system liquidity is no longer the Fed balance sheet but the Treasury General Account (TGA). When the government collects tax revenue and leaves it unspent at the Federal Reserve, those funds leave the banking system. When the government spends, they return. This mechanism explains most of the weekly fluctuations in Net Fed Liquidity and matters more right now than movements in the Fed balance sheet itself.
Net Fed Liquidity stands at $5.872 trillion as of May 27, recovering from the tax season low of $5.594 trillion. The banking system continues to expand, reaching $25.458 trillion in total assets, a new record. Together with rising C&I loans and M2 in the next block, this suggests the domestic credit channel in the United States looks more stable.
The weak link is the consumer. The Michigan Consumer Sentiment index fell to 44.8, a new record low, while inflation expectations are rising. The Fed cannot respond to weak growth alone while price pressures remain elevated.
1.2 Euro Area - ECB Is in a Softer Regime, But the Signal Is Not Clean
The ECB stands in a softer policy position than the Fed: main refinancing rate at approximately 2.15%, deposit facility rate at 2.00%. The balance sheet is around 6.186 trillion euros, slightly up week on week but not a significant new injection. Excess liquidity in the system sits at approximately 2.199 trillion euros, a large buffer that is no longer growing aggressively.
The problem is inflation. Headline came in at 3.5% year on year in May, above the consensus of 3.0%. Services inflation remains persistently elevated. This limits how aggressively the ECB can act even in its softer stance.
Activity data is mixed. Manufacturing PMI is 51.6, still in expansion territory, but services PMI fell to 46.4 and composite PMI is 48.8, a reading below 50 that signals a mild contraction in the broader economy. Europe is growing more slowly than the United States, and the transmission of policy to the real economy remains uneven.
1.3 Japan - BoJ Normalization Remains the Key Regional Risk
The Bank of Japan held its short-term policy rate at 0.75%, but the decision was not unanimous: three board members voted for a hike to 1.0%. Japan is the only one of the four economies in which the direction of travel is upward, not sideways.
Why this matters beyond Japan: decades of near-zero rates made yen-denominated borrowing extremely cheap. Investors worldwide borrowed in yen and deployed that capital into higher-yielding assets elsewhere. If the BoJ continues to normalize, the cost of those positions rises and unwinding them can produce volatility in entirely unrelated markets. For now this is a normalization risk, not a funding accident.
The BoJ balance sheet stands at approximately 663.3 trillion yen, slightly up from 662.1 trillion. The inflation outlook for FY2026 was raised to 2.8% from 1.9%, while the growth forecast was cut to 0.5% from 1.0%. An uncomfortable combination: higher inflation expectations, weaker growth, and pressure to normalize. The 10-year Japanese government bond yield is around 2.74%. The yen remains a key global liquidity variable.
1.4 China - Loose Policy Exists, But Transmission Remains Weak
The People's Bank of China maintains a moderately loose stance: 1-year Loan Prime Rate at 3.00%, 5-year LPR at 3.50%, reserve requirement ratio for large banks at 7.50%. Policy is supportive but not aggressively reflationary.
The PBoC balance sheet fell to approximately 486,327.5 CNY hundred million in April from 491,398.7 in March. Liquidity injections via reverse repo declined to CNY 11 billion from CNY 123 billion. CPI is 1.2%, a signal of weak domestic demand. PPI is accelerating to 2.8% due to production input costs, a strange combination in which the consumer is not spending but the industrial sector is absorbing price pressure. China is not a source of acute liquidity stress, but it is not a strong global reflation engine either.
Block 1 Conclusion
Global central banks are no longer tightening in unison, but they are not easing in unison either. In the United States, QT has stopped but the Fed is constrained by inflation. In Europe, the ECB is in a softer mode but the data is uneven. In Japan, the BoJ remains a normalization risk. In China, policy is loose but the effect is limited. Liquidity pressure is easing without being replaced by a new synchronized impulse.
Block 2: Money and Credit Transmission
2.1 United States - Broad Money and Bank Credit Are Improving
M2 in the United States rose to $22.805 trillion in April from $22.686 trillion in March, a new record high. Broad money supply is no longer confirming a tightening regime. After the period of QT and liquidity drain, M2 has not only recovered but exceeded its previous peak.
Commercial and industrial loans also rose to $2.865 trillion from $2.822 trillion. When businesses borrow, they typically do so because they see demand ahead of them. Together with the banking system balance sheet at a record $25.458 trillion, the credit channel in the United States is not frozen despite lending rates around 6.75%.
Consumer credit gives a more mixed signal. The $24.86 billion increase in March looks strong on the surface, but the structure matters. Revolving credit (credit cards) rose to $1.34 trillion while nonrevolving credit (auto and student loans) reached $3.90 trillion. Households are using credit to sustain spending. That is different from credit driven by confidence and investment.
2.2 Euro Area - Credit Is Stable, But M3 Cooled for the First Time
In Europe the picture is more uneven. M3 fell to 17.434 trillion euros in April from 17.474 trillion in March. After several months of consecutive increases, April is the first monthly decline. It is not a systemic signal, but it is the first indication that the monetary impulse is losing momentum.
Corporate lending accelerated to 3.4% year on year from 3.2%, above the consensus of 3.1%. Household credit growth held steady at 3.0%. These readings are constructive, but the M3 cooling makes the overall picture more cautious: corporate credit is growing, but broad money is no longer confirming it with the same force.
2.3 China - Credit Creation Is Weak Despite Supportive Policy
Chinese credit transmission remains the weakest among the four regions. Total Social Financing, the broad measure of new financing flowing into the economy, fell to CNY 620 billion in April from CNY 5.23 trillion in March, well below the consensus of CNY 1.5 trillion. This confirms that policy support does not automatically translate into real credit momentum.
Household lending declined and outstanding loan growth slowed to 5.6% year on year from 5.8%. PMI data provides a slightly better signal, with Composite PMI rising to 53.1 and manufacturing PMI at 51.8. Stabilization in activity, but not a change in credit weakness. China remains a stabilization story, not an acceleration story.
2.4 Japan - Money Supply and Bank Lending Remain Supportive
Japan shows perhaps the most interesting contrast in this block. M2 rose to 1,295.4 trillion yen in April from 1,279.5 trillion, and M3 rose to 1,640.5 trillion from 1,625.1 trillion. Bank lending accelerated to 5.4% year on year from 4.8%, above the consensus of 4.6%.
This is happening despite official tightening from the BoJ. The monetary base is falling approximately 11.3% year on year. But the banking system is more than compensating: credit is growing, broad money is growing. Japanese investors purchased a net 10.3 billion yen in foreign bonds for the week ending May 23, a fourth consecutive week of positive flows, with no abrupt withdrawal of Japanese capital from international markets.
Block 2 Conclusion
The United States leads: M2, bank balance sheets and corporate lending are all expanding. Europe is stable but M3 posted its first monthly decline after several months of growth. China remains weak on credit impulse despite supportive policy. Japan shows accelerating credit and growing money supply despite official BoJ tightening. The global environment is stabilizing but not accelerating in unison.