The Price of Money and the Weight of Debt

LIQUIDITY DESK | HISTORICAL PARALLEL
How governments have always answered the arithmetic of r > g, and what that history says about the decade ahead
Introduction
Last month, this series traced how the relationship between stocks and bonds shifts with the macro regime, and how the return of an inflationary environment after 2022 revived a correlation pattern not seen since before 1997. That piece was about the price of risk. This one is about the price of money itself, and about a second, quieter consequence of the same regime shift: what happens to government debt when the cost of servicing it rises faster than the economy that has to pay for it.
The relationship is not complicated. It is, in fact, one of the few genuinely mechanical relationships in all of macroeconomics. When the interest rate a government pays on its debt exceeds the nominal growth rate of its economy, the debt-to-GDP ratio rises automatically, even if the budget is balanced. When growth exceeds the interest rate, the ratio can fall even with a moderate deficit. Economists shorthand this as r minus g. It looks like a footnote. It is not. It has, at different points in modern history, forced governments into default, into austerity, or into a third and far more common path: financial repression, the deliberate, sustained suppression of the return on government debt below the rate of growth or inflation.
The United States is now back on the wrong side of that equation, at a debt level that makes the choice unavoidable. This piece asks the question the May parallel did not: when r exceeds g for long enough, what does a government actually do about it, and has it ever been able to do so while inflation, not deflation, was the problem.
The Arithmetic of r and g
Start with the identity itself, because everything that follows depends on it holding. Let d be the debt-to-GDP ratio, r the effective interest rate paid on that debt, g the nominal growth rate of the economy, and pb the primary balance as a share of GDP, meaning the budget balance excluding interest payments, with a surplus entered as a positive number. The change in the debt ratio from one year to the next is approximately:
Δd = (r − g) × d − pb
The logic of the formula is worth sitting with rather than skimming past, because it is the entire argument in one line. The first term, (r minus g) times d, is the automatic, mechanical drift of the debt ratio that happens with no policy decision at all. It is simply the existing debt compounding at the interest rate while the denominator, GDP, grows at a different rate. The second term, pb, is the only lever a government directly controls in any given year: how much it raises in taxes relative to how much it spends, excluding interest.
Run the numbers for the United States as they stand today. The Congressional Budget Office's February 2026 baseline puts federal debt held by the public at 101 percent of GDP for fiscal year 2026, with net interest outlays of just over 1 trillion dollars, equivalent to roughly 3.3 percent of GDP, against a primary deficit, that is, the deficit before interest costs, of 2.6 percent of GDP.
| Metric (CBO Feb 2026 baseline) | 2026 | 2036 (projected) |
| Federal debt held by the public | 101% of GDP | 120% of GDP |
| Net interest outlays | ~$1.0 trillion | ~$2.1 trillion |
| Net interest, share of GDP | ~3.3% | ~4.6% |
| Primary deficit | 2.6% of GDP | ~2.1% of GDP |
| 10-year Treasury rate (avg) | 4.1% | ~4.4% |
| Real GDP growth | 2.4% | 1.8% |
CBO's own projections embed a 10-year Treasury rate averaging 4.1 percent this year, rising toward 4.4 percent by 2031, against projected real GDP growth slowing from 2.4 percent in 2026 to 1.8 percent over the following decade. Add CBO's inflation assumptions and nominal growth lands in the 4.0 to 4.5 percent range for most of the projection window, meaning the effective interest rate on the debt and the nominal growth rate are now close to each other, with the gap easily turning positive in any year financing costs tick up faster than growth, exactly the dynamic the Brookings Institution's most recent fiscal outlook update describes as a widening gap between the average nominal interest rate on government debt and the nominal growth rate, a gap they explicitly flag as capable of producing explosive debt dynamics.
Plug rough figures into the identity to see the mechanism, not as forecasting, simply as arithmetic. Take d at 100 percent, r at 4.2 percent, g at 4.0 percent, so r minus g equals roughly 0.2 percentage points. On a debt ratio of 100 percent of GDP, that alone adds about 0.2 percentage points to the debt ratio with zero new deficit spending. It looks trivial. It is not, for two reasons. First, the actual primary balance is not zero. CBO puts it at a deficit of roughly 2.1 to 2.6 percent of GDP across the projection window, not a surplus, which is the second term in the formula working in the same direction as the first, not against it. Second, and more importantly, the gap is not fixed. CBO's own baseline has interest costs roughly doubling in nominal dollars from 1.0 trillion in 2026 to 2.1 trillion by 2036, even as growth assumptions stay roughly flat, which is precisely a widening, not a stable, r minus g.
The result, in CBO's own central projection and without assuming any crisis, recession, or policy error: debt held by the public rises from 101 percent of GDP in 2026 to 120 percent by 2036, surpassing the previous all-time high of 106 percent of GDP reached in 1946. That figure deserves to be read twice. The United States is on a path, under current law and current baseline growth assumptions, to exceed its post-World War II debt peak within the next decade, not because of a new war or a new pandemic, but because of the ordinary arithmetic of r and g compounding against a primary deficit that does not close.
Source: Congressional Budget Office, The Budget and Economic Outlook: 2026 to 2036, February 2026; Brookings Institution, An Update on the Federal Budget Outlook, March 2026.
Two Paths Out, and Why One of Them Is Politically Dead
There are, in principle, only a small number of ways a government can stop d from rising once r exceeds g. It can run a primary surplus large enough to offset the (r minus g) times d term every year, which is fiscal consolidation in its purest form. It can grow the economy faster than the interest rate, which is not a policy choice so much as a hope. It can default or restructure, explicitly breaking the promise to creditors. Or it can change r itself, pulling the interest rate the government actually pays below what an unconstrained market would charge, a deliberate and sustained policy choice known as financial repression.
The first option, fiscal consolidation, is the textbook answer and the one a clean macro model would recommend. It is also, for the United States in 2026, very close to fantasy. CBO's own baseline assumes the deficit averages 6.1 percent of GDP over the next decade against a 50-year historical average of 3.8 percent, with the major drivers, Social Security, Medicare, and net interest, all structurally rising rather than falling. None of those three is politically available to cut at the scale required without a level of bipartisan agreement that has not existed in Washington for a generation. The arithmetic answer and the political answer to the same question have simply diverged.
That leaves financial repression as the historically dominant response, not because it is elegant, but because it is the only path that does not require an explicit, visible political decision. Default and restructuring are catastrophic and immediately visible to every creditor in the world. Consolidation requires Congress to do something it has shown no appetite for. Repression, by contrast, can be implemented gradually, through regulation rather than legislation, and dressed up as financial stability policy rather than debt management. It is the path of least political resistance, which is exactly why it has been the most common historical response to a debt overhang.
The Original Template: The United States, 1942 to 1951
The cleanest historical case study is the country's own, and it happened once before, at a debt level the country is now approaching again. By 1946, U.S. federal debt held by the public reached 106 percent of GDP, the previous all-time record CBO now projects will be exceeded again around 2030. Paying that debt down through taxation or spending cuts alone, in the middle of postwar reconstruction with a public exhausted by twelve years of depression and war, was understood at the time to be politically impossible.
The Federal Reserve's answer began in 1942, not 1946. As part of financing the war effort, the Fed agreed to peg the interest rate on short-term Treasury bills at three-eighths of one percent and capped the yield on long-term Treasury bonds at 2.5 percent, committing to buy whatever quantity of government securities was necessary to hold those rates in place. According to research compiled by the Federal Reserve Bank of Richmond, the Fed maintained this peg for nearly a decade, six full years after the war had already ended, only abandoning it with the Treasury-Federal Reserve Accord of March 1951.
What makes the episode directly relevant to the inflationary framing of this series, rather than simply a curiosity about deflation-era policy, is what happened to inflation while the peg was in place. According to the Federal Reserve's own historical account, consumer price inflation ran at 17.6 percent between June 1946 and June 1947, and reached an annualized rate of 21 percent by February 1951. Research by Eichengreen places average inflation between 1947 and 1951 above 7 percent. The Fed was pegging interest rates near zero while inflation ran into the double digits, for years, not months. This is the historical proof that financial repression and high inflation are not mutually exclusive. The United States has already done precisely this, at home, within living institutional memory.
The result, documented in a 2024 IMF working paper by Julien Acalin and Laurence Ball that explicitly studies this episode through the r-minus-g lens, was that real returns to U.S. government bondholders averaged negative 0.3 percent annually over the 1945 to 1980 period. The IMF's broader Reinhart-Sbrancia research, cited by the Richmond Fed, found the same mechanism produced far more severe results elsewhere: negative 6.6 percent annual real returns in France and negative 4.6 percent in Italy over the same decades. The debt was not paid down. It was quietly devalued, year after year, transferred from the government's balance sheet to the saver's, through an interest rate that was never allowed to compensate for the inflation actually occurring.
The Acalin and Ball paper makes one further point essential to this piece's argument: economic growth alone is usually credited with shrinking the postwar U.S. debt ratio from 106 percent in 1946 to 23 percent by 1974, and that story is largely wrong. Their counterfactual simulation, removing only the effects of the pre-1951 interest rate peg and the surprise inflation of the late 1940s, finds that debt would have fallen only to 74 percent of GDP by 1974, not 23 percent. In other words, the bulk of what is popularly remembered as growing out of the debt was, mechanically, financial repression and unexpected inflation doing the work that growth gets credit for.
Source: Federal Reserve Bank of Richmond, A Look Back at Financial Repression, 2021; Federal Reserve History, From WWII to the Treasury-Fed Accord; Acalin, J. and Ball, L., Did the U.S. Really Grow Out of Its World War II Debt?, IMF Working Paper, 2024; Eichengreen, B., Deficits and Debt in the Lens of History, PGPF, 2026.
How the peg actually broke
It is worth dwelling briefly on how the 1942-1951 episode ended, because the mechanism of its collapse is instructive for thinking about the limits of any modern equivalent. Treasury, under Secretary John Snyder, fought to keep the peg through 1950 specifically to protect the value of war bonds held by the public, a political commitment as much as an economic one. The Fed, increasingly alarmed at its loss of control over inflation, resisted. The outbreak of the Korean War in June 1950 made the standoff acute: the FOMC wanted to raise rates to contain a fresh inflationary impulse, and Treasury would not let it. By February 1951, with inflation running at an annualized 21 percent and the bond market beginning to behave abnormally as investors started treating bills and bonds as near-perfect substitutes once the peg removed all interest rate risk, the Fed informed Treasury it would no longer hold the line. The Accord that followed in March 1951 is now remembered as the foundational moment of Federal Reserve independence. It is less often remembered as the moment financial repression, in its original American form, was forced to an end not by a policy decision but by a bond market that had simply stopped functioning as a market.
Why the Same Playbook Is Harder to Run Today
The instinct, having read the 1945-1951 history, is to assume the same toolkit is available now. It is not, and the reasons are structural rather than political, which is precisely why they cannot simply be wished away by a sufficiently determined administration.
The first difference is the openness of the capital account. In 1945, cross-border capital flows were tightly constrained, first by wartime controls and then by the architecture of Bretton Woods. A saver who disliked negative real yields on Treasury bonds in 1945 had very few alternatives. Today, an American saver can move out of Treasuries and into domestic equities, a money market fund, foreign assets, or commodities, in seconds, from a phone. And the foreign governments and institutions that hold a large share of U.S. debt can rotate elsewhere just as easily. Repression depends on a captive holder of the debt, and the holders of U.S. debt, domestic and foreign alike, have never been less captive.
The second is the reserve currency status of the dollar itself, which cuts in a genuinely double-edged way. It is precisely the dollar's reserve role that allows the United States to run deficits and accumulate debt that would be unaffordable for almost any other economy, since foreign demand for dollar assets keeps financing costs lower than the fiscal position alone would justify. But that same status makes aggressive, visible repression self-defeating: capital controls or an explicit return to rate pegging in the world's reserve currency would directly threaten the very demand that subsidizes the debt in the first place. The instrument that makes the debt sustainable is also the instrument a heavy-handed repression strategy would put at risk.
The third is institutional memory, and it cuts directly against the element of surprise that made the postwar episode work. Acalin and Ball's research is explicit that part of what reduced the real burden of 1940s debt was unexpected inflation, inflation that materialized after bonds had already been priced and sold at the pegged rate. Today's bond market has just lived through 2022, an episode in which 10-year Treasury yields moved from roughly 1.5 percent to over 4 percent within twelve months as inflation surprised to the upside. Investors, pension funds, and central banks globally are now alert to exactly this risk in a way the 1940s saver, fresh from over a decade of price stability through the Depression, simply was not. A second surprise is far harder to engineer against a market that now actively prices regime change.
The Quiet Path: A Repression Without a Name
None of this means the underlying pressure toward repression disappears. It means the form it takes in a globalized, dollar-reserve, post-2022 world looks different from a formal Fed-Treasury rate peg with capital controls bolted on. The more realistic path is what might be called repression without a name: a set of individually defensible regulatory and policy choices that, in combination, push the effective r below what a fully free market would set, without any single step requiring the words “financial repression” to be spoken aloud.
Several of the building blocks for this are already visible or actively under discussion in Washington. Treasury Secretary Scott Bessent has publicly floated recasting the relationship between the Fed and Treasury along lines closer to the Bank of England model, including changes to the supplementary leverage ratio that, by Bessent's own estimate, could lower Treasury bill yields by 30 to 70 basis points simply by making it cheaper for banks to hold government debt on their balance sheets. That is not a rate peg. It is a regulatory lever that produces a similar directional effect, lower yields than an unconstrained market would otherwise demand, while remaining entirely within the language of bank capital regulation.
A second building block is the toleration of inflation modestly and persistently above the Fed's stated 2 percent target, without any formal change to the target itself. CBO's own baseline already embeds 10-year Treasury yields and nominal growth converging in a band where r minus g hovers close to zero rather than comfortably negative, meaning even a small additional tolerance for above-target inflation, absorbed quietly rather than announced, does meaningful work on the debt ratio over a decade through the same mechanism the 1940s used, just at a far gentler intensity.
A third is the steady expansion of regulatory and quasi-regulatory demand for government debt: bank liquidity requirements, insurance company capital rules, and pension fund mandates that favor government securities over alternatives. None of these requires legislation in the way a formal capital control would. Each is defensible on its own terms as prudential regulation. Together, they perform a softened version of the same function the postwar peg performed directly: manufacturing a buyer base for government debt that is less price-sensitive than the open market would otherwise be.
Reading the regime shift directly off the data
The mechanism becomes visible in the spread between the 10-year Treasury yield and nominal GDP growth itself, the cleanest real-time proxy for r minus g available without waiting for CBO's annual projections, and the correct maturity to use rather than the short end, since it is the long end of the curve that the 1942-1951 peg targeted directly and the long end that determines the actual cost of financing a multi-decade debt stock. The series stretches back to 1954 and its shape is, on its own, close to a visual summary of this entire piece. The three regimes described earlier in this piece are visible without any further commentary needed: the spread ran persistently negative, meaning the 10-year yield sat below nominal GDP growth, through most of the 1950s and 1960s, then spiked into deeply positive territory through the inflationary 1965-1981 period, the spread itself touching a peak above 16 percentage points around 1981 as nominal growth collapsed beneath a 10-year yield that had reached roughly 15.7 percent at the Volcker extreme, then spent most of the 1982-2021 disinflationary era oscillating around or modestly above zero, a far gentler and more sporadic version of r exceeding g than the 1970s, before collapsing to roughly negative 10 percentage points during the 2021 inflation surge, when nominal growth briefly ran far ahead of a Fed still holding rates near zero.
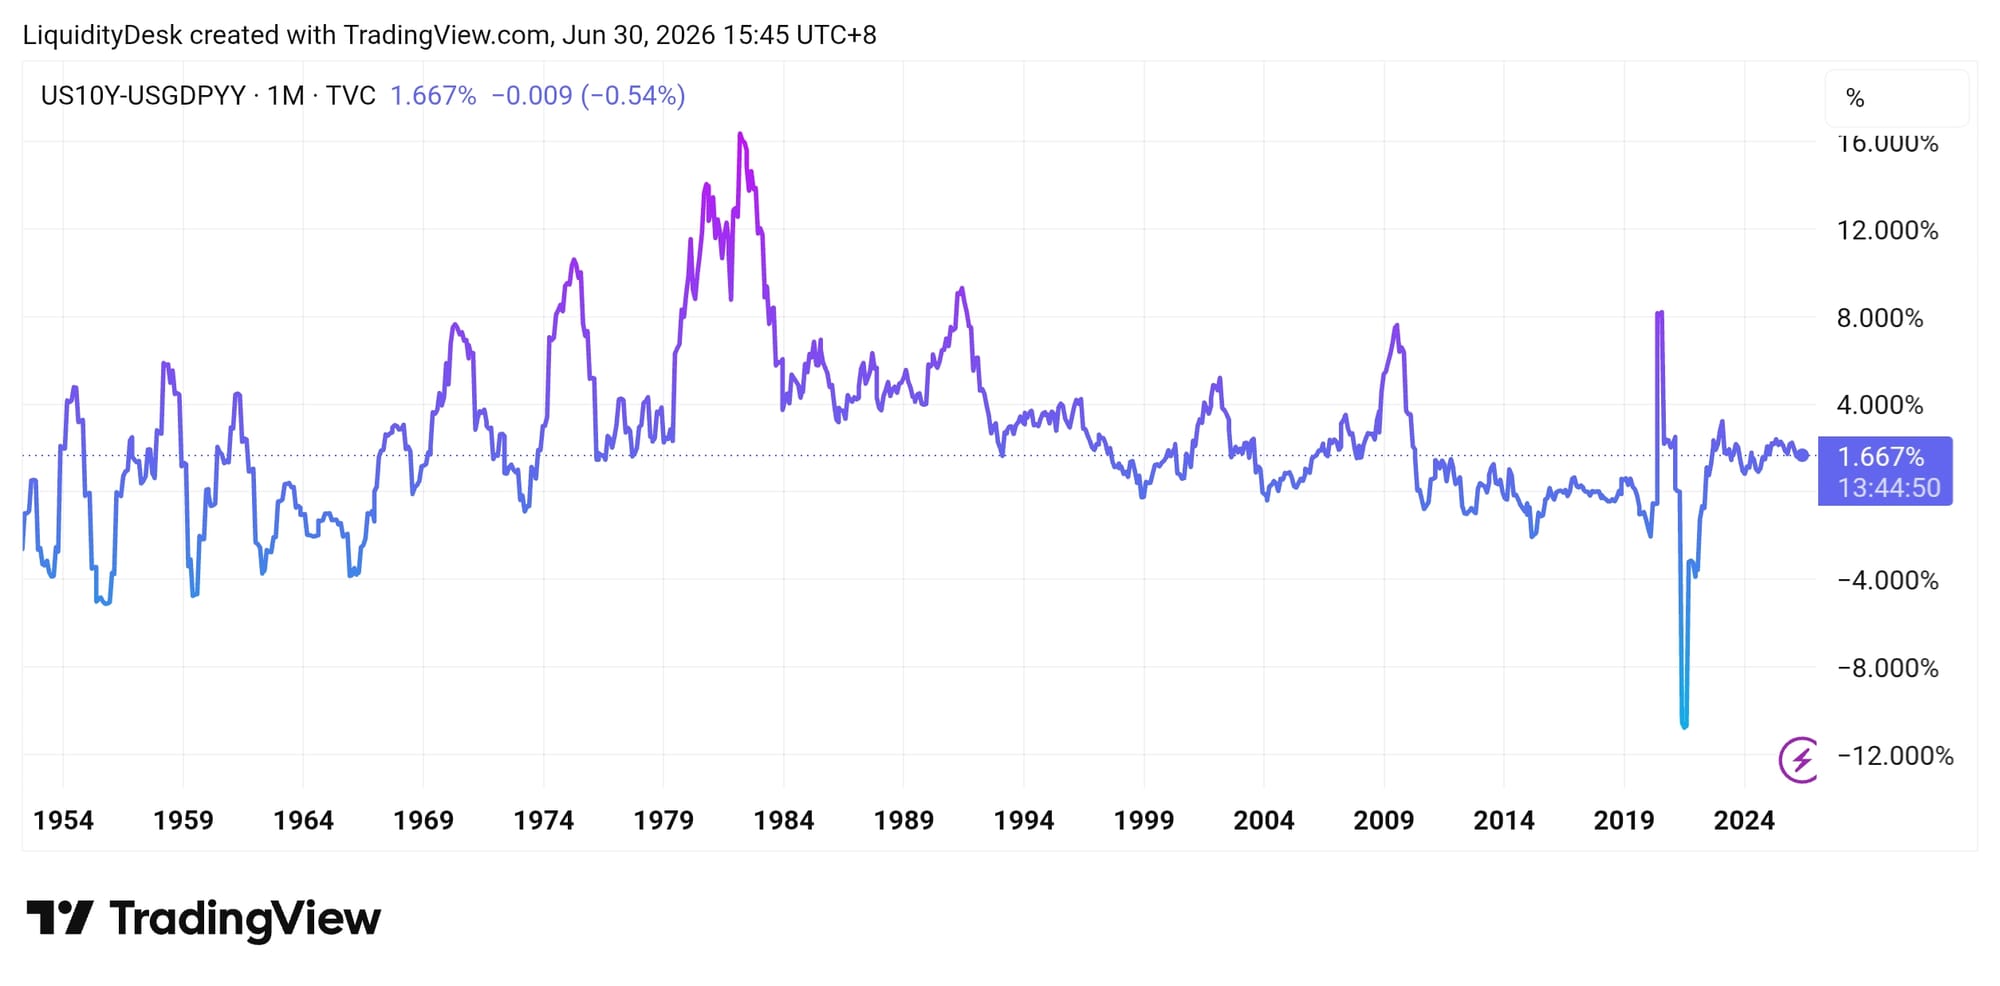
That collapse was the disinflationary-era regime in its most extreme form, real growth and inflation both spiking while the Fed had not yet begun to respond, the mirror image of financial repression achieved entirely by policy lag rather than by design. The reversal that followed was equally violent: by late 2022 the spread had snapped back through zero and briefly spiked above 7 percent as the Fed's tightening cycle caught up with and then overshot the moderating growth rate, before settling into the range the series has occupied since 2023, broadly between 1.5 and 2.5 percentage points. As of the most recent reading, the 10-year spread sits at 1.667 percent, modestly positive, well off the 2022 extreme but still firmly on the wrong side of the line this piece has been describing throughout: r above g, meaning the debt ratio continues to drift upward from this mechanism alone, just at a far gentler pace than during the tightening cycle itself. The chart is not a forecast. It is a real-time read on which side of the r-minus-g line the system currently sits, and as of today it sits, modestly but persistently, on the wrong side.
Source: LiquidityDesk, TradingView.com, US10Y minus USGDPYY, monthly, 1954 to present.
Financial Repression Across Regimes
| Episode | Mechanism | Inflation Backdrop | Real Return to Bondholders |
| US, 1942 to 1951 | Fed rate peg: 0.375% bills, 2.5% bond ceiling | High: up to 21% annualized by 1951 | Approx. -0.3% per year, 1945 to 1980 |
| France, 1945 to 1980 | Regulation, captive institutional buyers | High, recurrent currency crises | Approx. -6.6% per year |
| Italy, 1945 to 1980 | Regulation, captive institutional buyers | High, recurrent currency crises | Approx. -4.6% per year |
| US, 2008 to 2021 | Zero rates, QE, no explicit peg needed | Low / below target | Persistently negative real short rates |
| US, 2026 onward (proposed path) | Regulatory leverage relief, quiet inflation tolerance, captive institutional demand | Above target, contested | Unresolved, the open question of this piece |
Source: Richmond Fed; Federal Reserve History; Acalin and Ball (IMF, 2024); Reinhart and Sbrancia, as cited by Richmond Fed.
What Would Make It Fail: The Capital Control Question
The honest version of this argument has to confront its own weakest link directly, because it is the question every careful reader will ask. If quiet, regulatory-style repression is the realistic path rather than a formal 1940s-style peg, what happens if inflation runs hot enough, for long enough, that quiet measures are not sufficient, and savers begin to exit government debt at a pace regulation alone cannot offset. Historically, that is precisely the point at which governments have reached for capital controls: restrictions on the ability to move money out of the domestic financial system, deployed specifically to trap the savings that repression needs in order to function.
The honest answer is that explicit capital controls in a G7, dollar-reserve economy remain a low-probability outcome, not because the fiscal pressure described in this piece is not real, but because the cost of deploying that tool would very plausibly exceed the benefit. A capital control regime in the United States would be a direct assault on the reserve currency status that is simultaneously the only reason the current debt load is financeable on favorable terms in the first place. It is difficult to imagine a policy more likely to accelerate exactly the loss of confidence the repression strategy is designed to prevent.
What is more plausible, and worth watching for as a leading indicator rather than dismissing, is repression's softer cousins: expanded reporting requirements on foreign holdings, tax treatment that favors domestic Treasury holdings over foreign alternatives, or moral suasion directed at large domestic asset managers and pension funds to maintain or increase government bond allocations. None of these is a capital control in the formal sense. All of them push in the same direction. The distinction between regulation and control is, in practice, a matter of degree, and the history in this piece suggests the degree tends to increase gradually, under fiscal pressure, rather than arriving all at once.
Final Thesis
The May parallel in this series argued that the relationship between stocks and bonds is not a law of nature but the product of a specific macro regime, and that the regime appears to be shifting back toward the inflationary logic that prevailed before 1997. This piece extends that argument one layer deeper, into the mechanics of the debt itself. A return to an inflationary regime does not simply change how a 60/40 portfolio behaves. It changes the incentives facing the government that issues the bonds in that portfolio.
When r exceeds g, as it now modestly does, the debt-to-GDP ratio rises mechanically, with or without a new dollar of deficit spending, and the United States is on a baseline path, by its own official projections, to exceed its post-World War II debt peak within the next decade. History offers exactly one example of how a modern, developed government with a debt load of comparable scale resolved that arithmetic without default or true austerity: it suppressed the interest rate it paid, for nearly a decade, through a period when inflation ran into the double digits, and it transferred the resulting cost quietly, through negative real returns, onto the savers who held its bonds.
The instruments available today are not identical to 1942. Capital is more mobile, the dollar's reserve status cuts both ways, and the market has institutional memory the 1940s saver did not. But the underlying arithmetic has not changed, and neither has the basic menu of options available to any government facing it: consolidate, grow out of it, default, or repress. The first is politically unavailable at the scale required. The second is a hope, not a strategy. The third remains, for a reserve currency issuer, close to unthinkable. That leaves the fourth, arriving this time not as a peg announced on a single day in 1942, but as a slow accumulation of individually reasonable decisions that, added together, do the same arithmetic work.
The question for an investor is not whether this happens, in some dramatic, announced form. It almost certainly will not. The question is whether the portfolio is positioned for a decade in which the real return on holding government debt is quietly, persistently suppressed, the way it was the last time the United States stood where it stands today.
Sources
- Congressional Budget Office: The Budget and Economic Outlook: 2026 to 2036, February 2026
- Brookings Institution: An Update on the Federal Budget Outlook, March 2026
- Peter G. Peterson Foundation: National Debt Outlook Gets Worse as Interest Costs Exceed $1 Trillion Annually, April 2026
- Peter G. Peterson Foundation: Monthly Interest Tracker, Interest Costs on the National Debt
- Baker Institute: Key Economic Shifts in the Congressional Budget Office Outlook, March 2026
- Federal Reserve Bank of Richmond: A Look Back at Financial Repression, Econ Focus, 2021
- Federal Reserve History: From WWII to the Treasury-Fed Accord
- Federal Reserve History: The Treasury-Fed Accord
- Acalin, J. and Ball, L.: Did the U.S. Really Grow Out of Its World War II Debt?, IMF Working Paper No. 2024/005
- Eichengreen, B.: Deficits and Debt in the Lens of History, Peter G. Peterson Foundation, 2026
- Federal Reserve Bank of Richmond: Federal Reserve Independence, Is It Time for a New Treasury-Fed Accord?
- LegalClarity: What Is Financial Repression and How Does It Work, 2026
liquiditydesk.org | Free Content, Share Freely
Member discussion