The Scale Game: How $100 Billion Moves Markets
EDUCATION SERIES
The amplification mechanisms that turn central bank liquidity into market moves
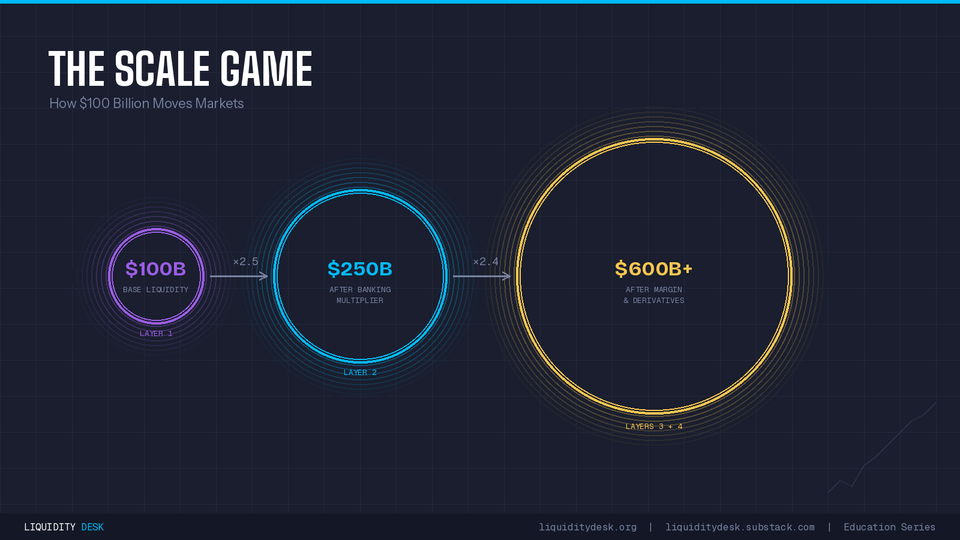
Most retail investors watch the Federal Reserve and ask a simple question: how much is the Fed adding or removing? That number matters enormously. It is the foundation on which everything else is built. But it is only the foundation. The real scale of what that liquidity does once it enters the system, how far it travels and how much it multiplies, is almost never discussed. The answer involves three distinct amplification layers that can turn $100 billion of central bank action into $500 or $600 billion of real market movement. Understanding these layers is what separates investors who see the full picture from those who see only part of it.
The Fed does not move markets directly. It loads a mechanism. The mechanism does the rest.
Layer One: The Net Fed Liquidity Baseline
Net Fed Liquidity (NFL) is the starting point. The calculation is straightforward: take the Fed's total balance sheet (WALCL), subtract the Treasury General Account (TGA) and the Reverse Repo Facility (RRPONTSYD). What remains is the liquidity actually circulating in the financial system.
NFL = WALCL - TGA - RRPONTSYD
When the TGA falls, money that was sitting idle in the government's account at the Fed flows out into the banking system. When the RRP facility drains, money market funds withdraw cash from the Fed and deploy it elsewhere. In both cases, reserves increase and the system becomes more liquid. The WALCL itself changes more slowly, through QE and QT cycles.
This baseline number matters because it defines the environment in which every other financial decision is made. A rising NFL makes credit cheaper and more available. A falling NFL does the opposite. But the NFL itself is only the first layer. What happens next is where most analysts stop looking.
How the Liquidity Actually Enters the System
When the Federal Reserve increases its balance sheet through quantitative easing (QE), it buys securities, most commonly US Treasury bonds, directly from primary dealers. These are the large banks such as JPMorgan, Goldman Sachs, and Citigroup, which hold special counterparty status with the Fed. The payment does not come from somewhere else in the system. The Fed simply credits the dealer bank's reserve account with newly created reserves. The money does not exist before the transaction. After it, it does.
These reserves sit inside the banking system. Banks are not obligated to deploy them, and during the period from 2008 to 2021 many simply held them back at the Fed in exchange for interest (IOER/IORB). But competitive dynamics and the search for yield push banks to find better uses for them. Reserves become the raw material for credit creation.
From here, the liquidity enters the real financial system through two parallel channels.
The first is the credit channel. Banks extend loans to corporations, households, and investors. Every loan issued creates a new deposit in the system, existing money is not moved, new money is created. Those deposits become purchasing power that seeks assets. Corporations buy back shares. Investors buy real estate. Households increase spending.
The second is the portfolio rebalancing effect. When the Fed buys bonds and drives their prices up, the investors who held them receive cash in return. But bond yields are now compressed. Those investors are forced to seek returns elsewhere, in equities, corporate debt, and alternative assets. This mechanism was described openly by Ben Bernanke as the intended transmission channel of QE.
Both channels arrive at the same destination: more capital chasing financial assets, against a backdrop of reduced risk-free yield. Prices rise. Collateral values rise. The system is primed for the next amplification layer.
Layer Two: The Banking Multiplier
Every dollar of reserves held at the Fed can support a multiple of lending in the real economy. This is the classical money multiplier, and while its mechanics have evolved in the post-2008 era of ample reserves, the directional logic remains intact: more base liquidity means more capacity for banks to extend credit.
When NFL rises, banks find themselves with excess reserves. The return on simply holding those reserves at the Fed (the IORB rate) creates a floor, but competitive pressure pushes banks to deploy capital into loans, mortgages, and corporate credit. This credit then becomes deposits elsewhere, which become reserves again, extending the chain.
The important point is that this multiplier is not fixed. It expands during risk-on environments when banks are willing to lend and borrowers are willing to borrow, and it contracts sharply during stress. The same $100 billion of base liquidity produces very different real-world effects depending on whether credit appetite is expanding or contracting.
The Asymmetry of Contraction
When NFL falls, the multiplier reverses, but not symmetrically. Banks do not simply lend less. They actively pull back credit lines, tighten collateral requirements, and build precautionary buffers. The contraction of the multiplier tends to be faster and larger than the expansion. This is why tightening cycles cause disproportionate financial stress relative to what the raw numbers of QT might suggest.
Layer Three: The Margin Spiral
This is the mechanism that most directly connects NFL to equity market behavior, and it is the most powerful of the three layers.
When liquidity rises and equity prices begin to climb, investors who hold portfolios on margin experience something automatic: their collateral value increases. A portfolio worth $1 million with $500,000 of borrowed capital suddenly becomes $1.1 million in a rising market. The loan-to-value ratio improves, and the broker allows additional borrowing capacity. The investor uses that capacity to buy more equities. Those purchases push prices slightly higher, improving collateral for all other margin accounts in the system. The cycle feeds on itself.
On the way up, every gain creates new buying capacity. On the way down, every loss creates new selling pressure. The mechanism is identical in both directions, but the speeds are very different.
The upward spiral is gradual because it requires prices to rise first before collateral improves. The downward spiral is immediate because margin calls arrive before the investor has time to react. When prices fall below maintenance margin thresholds, brokers issue margin calls that must be met within hours. Forced selling hits the market regardless of valuation, conviction, or fundamentals. That selling reduces prices further, triggering new margin calls for other accounts. The cascade can compress weeks of gains into days of losses.
Scale of the Effect
Total margin debt in US markets has reached $1.25 trillion as of February 2026, according to FINRA data. At a leverage ratio of 2:1 against equity, this implies total gross exposure of approximately $2.5 trillion built on borrowed capital. A 10% market decline alone does not wipe out most leveraged investors, but it triggers margin calls for the most aggressively positioned accounts. A sustained decline of 20 to 30% begins to force broad liquidation across a much wider segment of leveraged portfolios. The second-order effects of that liquidation ripple through prime brokerage, hedge fund portfolios, and ETF redemption queues simultaneously.
Layer Four: The Derivatives Overlay
Above the margin layer sits a further amplification mechanism driven by options market structure. This is the least understood layer for retail investors, but it has become increasingly significant as options volumes have exploded in the post-2020 era.
When investors buy call options, market makers who sell those options take on directional risk. To remain hedged, they must buy shares of the underlying asset proportional to the option's delta. As prices rise and options move further into the money, delta increases and market makers must buy more shares to maintain their hedge. This is called gamma hedging, and it creates systematic buying pressure that amplifies upward moves in the underlying market.
The reverse is equally powerful. When the market falls and puts move into the money, market makers who sold those puts must sell the underlying to hedge their exposure. This creates systematic selling pressure that amplifies downward moves. The options market, which was designed as a hedging tool, has become a momentum amplifier.
The interaction between NFL, the margin spiral, and options gamma can create self-reinforcing moves in both directions that bear little relationship to any fundamental change in earnings or economic conditions. The trigger is liquidity. The mechanism is leverage and derivatives. The outcome is volatility that consistently surprises investors who focus only on fundamentals.
A Real Example: July to October 2025
The second half of 2025 provides a clean illustration of these mechanisms in action.
On July 4, 2025, Congress raised the debt ceiling to $41.1 trillion through the One Big Beautiful Bill Act. The Treasury General Account had been drained to approximately $296 billion during the period of extraordinary measures, far below its normal operating level of $750 to $900 billion. Once the ceiling was lifted, Treasury immediately began issuing T-bills at scale to replenish its cash balance.
The data tells the story directly. TGA rose from $296 billion in mid-July to $958 billion by late October, an increase of $662 billion in approximately 14 weeks. Every dollar of that increase came directly out of the financial system as investors used cash to buy T-bills. NFL fell in parallel. Bank reserves tightened. The margin spiral went into reverse as collateral values stopped growing.
The equity market response was not immediate. The S&P 500 continued to drift higher through July and into mid-August. This is the typical lag: the first layer (NFL) was already deteriorating, but the second and third layers take time to transmit the signal. It was not until late August, roughly six weeks after the TGA refill began, that equity markets began to stall meaningfully.
Six weeks. That is approximately how long it took for $662 billion of liquidity withdrawal to work through the banking multiplier, reduce margin capacity, and shift the gamma hedging dynamic. Investors who were watching NFL in real time had a six-week window. Investors who were watching price action alone were already late.
The signal leads. Price follows. The lag between the two is where informed capital makes its decisions.
What This Means for Your Portfolio
The practical implication of understanding these amplification layers is not that you can time every market turn. It is that you can avoid the most dangerous positioning errors.
When NFL is rising and the margin spiral is building, leverage works in your favor. Collateral expands, credit is available, and the options market adds momentum to upward moves. This is the environment where staying invested and accepting some risk makes sense.
When NFL is falling, particularly during a TGA refill cycle following a debt ceiling resolution, the same mechanisms work against you. Collateral is contracting, credit is tightening, and options dealers are hedging into falling prices. This is the environment where reducing leverage and maintaining liquidity buffers is rational, not cautious.
The most dangerous moment in any cycle is when price is still rising but NFL has already turned lower. This is precisely when the margin spiral has built maximum leverage into the system and the amplification mechanisms are closest to reversal. History suggests this condition typically resolves with a correction that is faster and deeper than most investors expect, because the mechanism on the way down is the same mechanism that drove the rally, now running in reverse.
Conclusion
Base liquidity is the starting point, not the destination. A $100 billion shift in NFL, filtered through the banking multiplier, the margin spiral, and the derivatives overlay, can produce $500 to $600 billion of real market impact. The amplification is real, systematic, and well-documented. It is also almost entirely invisible to investors who focus only on earnings multiples and macroeconomic narratives.
Net Fed Liquidity does not tell you what to buy. It tells you what kind of market environment you are operating in, whether the amplification mechanisms are working for you or against you. In a system this interconnected, that distinction is worth more than almost any other piece of information.
Published by Liquidity Desk | liquiditydesk.substack.com | liquiditydesk.org
Member discussion