Stitched, Not Healed

Three central banks. Thin thread. The scar at Hormuz.
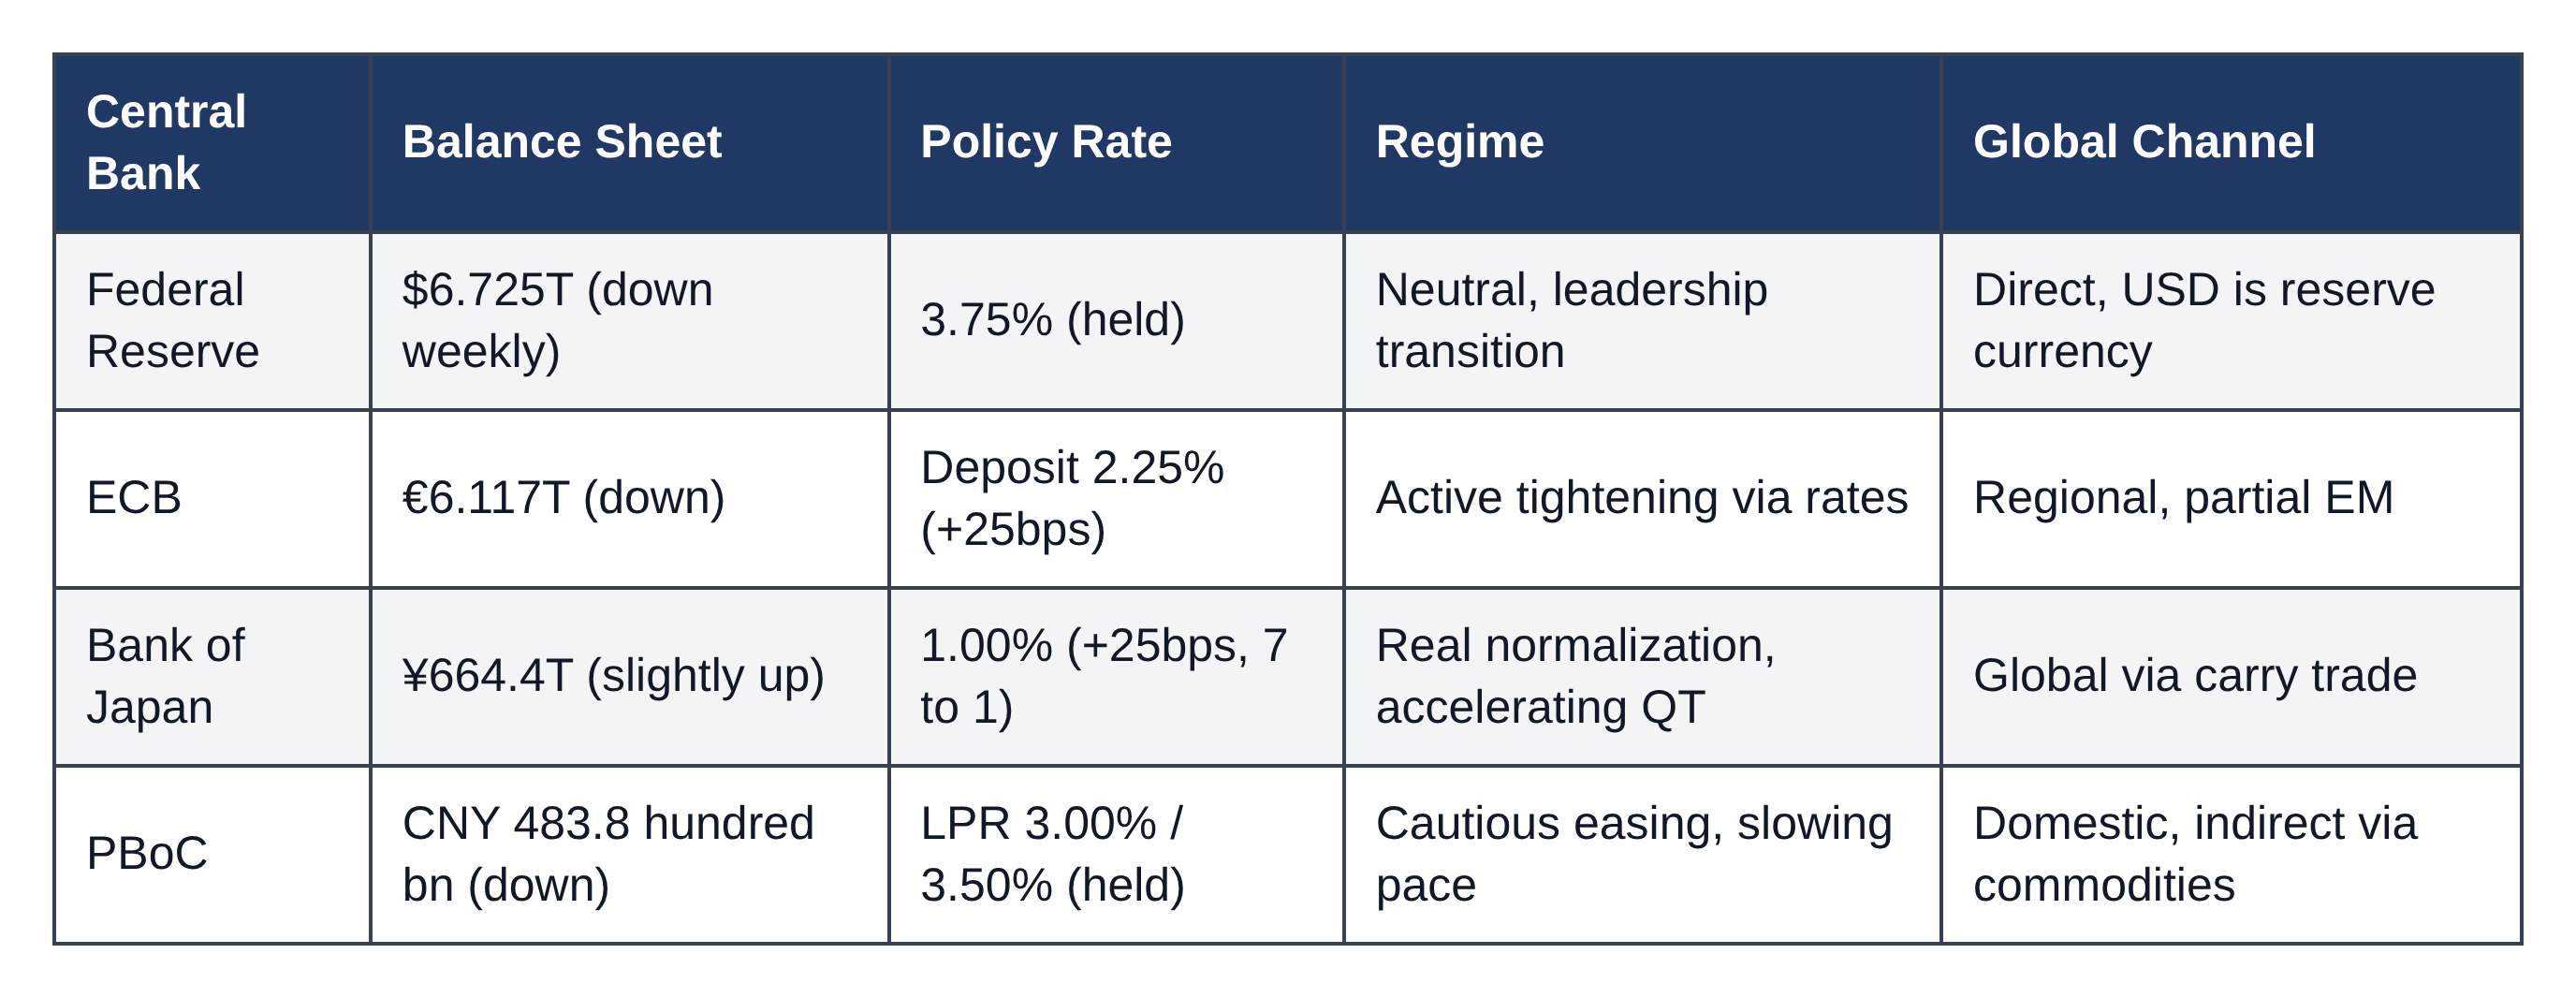
Global Liquidity Snapshot | July 2026 | W1
Introduction
On July 3, 2026, a state funeral began in Tehran for Supreme Leader Ali Khamenei, killed on February 28 in Israeli and U.S. airstrikes. The ceremony comes three weeks after Trump and Pezeshkian signed a memorandum of understanding ending the war, during a dinner with Macron at Versailles following the G7 summit. On June 18, Pakistan announced that the Strait of Hormuz would reopen immediately and that the U.S. naval blockade would end. Since July 1, ships have been crossing the strait again.
But as CSIS noted in its analysis published on July 1, this is not a peace settlement. It is an extended ceasefire, still hostage to the same dynamics that drew the two sides into conflict in the first place. Free passage through the strait holds only for sixty days, after which Iran intends to charge tolls that Washington has already flatly refused to accept. The wound at Hormuz, the one we wrote about in the May edition, is no longer bleeding. It has been stitched, with thin thread, hastily laid under the pressure of that sixty day window.
Right as the conflict escalated through the spring, three of the world's four most influential central banks actually tightened policy, each one citing inflation risk stemming directly from the war. Now the war is winding down, but the tightening remains a fact. In this edition we look at what actually happened to liquidity over the past month, how far private credit is compensating for the new tightening, and whether the stitches will hold while we wait to see if the inflation data vindicates the rate hikes, or shows that central banks acted late on a cause that is already fading.
Block 1: Central Banks
1.1 Federal Reserve (United States)
The Fed's balance sheet (WALCL) stands at $6,724.6 billion as of July 1, 2026, down from $6,735.6 billion a week earlier, continuing the gradual drift lower that has been in place since mid June. The policy rate was held at 3.75% at the June 17 decision, unanimously in line with market consensus. More telling, the committee's own projections for the rest of the year moved higher: the current year rate projection now sits at 3.8%, up from 3.4% previously, while the projection for the following year rose to 3.4% from 3.1%.
New Chair Kevin Warsh, who took over from Powell, has firmly defended the institution's independence, including after a Supreme Court ruling that Trump cannot immediately fire Governor Lisa Cook. Warsh said the Fed will not be comfortable with an inflation target above 2%, but also stressed that even though inflation expectations have eased somewhat recently, the bank is deliberately committing to no clear direction until the data becomes more decisive.
Regime: neutral after the end of QT in December 2025, in the middle of a leadership transition, with no clear signal on the next move.
1.2 European Central Bank (Euro Area)
The ECB raised rates by 25 basis points at its June 11 meeting, the first increase since 2023. The deposit facility rate rose from 2.00% to 2.25%, and the main refinancing rate from 2.15% to 2.40%. The central bank explicitly stated that the war in the Middle East is amplifying inflationary pressure through higher energy costs and the disruption at Hormuz, and revised its forecasts higher: headline inflation is now expected to reach 3.0% in 2026, up from a prior projection of 2.6%, while core inflation was raised to 2.5% for both years. At the same time, the ECB trimmed its growth forecast slightly, to 0.8% for 2026.
The balance sheet continues its gradual decline, down to €6,117.3 billion as of June 26. Excess liquidity in the system remains essentially unchanged at €2,198.6 billion, confirming that the rate decision alone does not drain reserves the way an active balance sheet runoff would.
Regime: a shift from a wait and watch stance to active tightening through the rate tool, while balance sheet runoff continues in the background.
1.3 Bank of Japan (Japan)
The BoJ raised its short term policy rate by 25 basis points to 1.00% at the June 16 meeting, in a 7 to 1 vote, the highest level since September 1995. The sole dissenter cited greater downside risks to production and employment. In its policy statement, the board warned that underlying inflation could accelerate above the 2% target because of rising energy costs, and pledged to keep raising rates as warranted while monitoring the impact of the Middle East conflict.
The balance sheet edged slightly higher to ¥664.4 trillion in May because of stabilization operations in the government bond market. But the monetary base continues to contract at an accelerating pace, down 13.70% year on year as of June, deepening from minus 12.20% previously, confirming that the official QT stance is genuinely intensifying. The yen remains weak, with USD/JPY at 161.1, a notable signal given the real rate hike.
Regime: a shift from officially tightening but inconsistently executed policy toward active normalization, driven directly by the inflation risk from the conflict.
1.4 People's Bank of China (PBoC)
The PBoC held its key lending rates at record lows for a thirteenth straight month in June: the one year LPR remains at 3.00%, the five year at 3.50%. The decision reflects caution over the fallout from the Middle East conflict, even as growth momentum has recently sputtered amid mixed data. Retail sales unexpectedly fell in May, the first decline since December 2022, while industrial output growth accelerated.
The balance sheet continues to shrink, down to CNY 483.8 hundred billion in May. More tellingly, actual liquidity injections are declining meaningfully: MLF injections fell to CNY 500 billion from CNY 600 billion, while reverse repo injections collapsed to just CNY 63 billion from CNY 288.5 billion, a drop of roughly 78%. In early July the PBoC confirmed it had bought only CNY 10 billion of government bonds net in June, a sharp pullback from CNY 50 billion in May and the lowest monthly total since October 2025, aimed at limiting further declines in yields and discouraging speculative excess.
Regime: the only central bank still in easing mode, but with a visibly slowing pace of real injections.
Block 2: Money and Credit Transmission
2.1 United States
M2 hit a new record of $23.05 trillion as of May 2026, up from $22.80 trillion in April, continuing an accelerating trend. C&I Loans (the official BUSLOANS series from FRED) reached $2,885.9 billion in May, up from $2,860.0 billion in April, a rise of nearly 8% year on year, a marked acceleration from the pace seen in prior editions. Total bank system assets showed their first slight decline after a string of records, dropping to $25,447.9 billion. Consumer sentiment is recovering from its historic low in May, while retail sales jumped to 6.90% year on year.
2.2 Euro Area
M3 returned to growth and set a new record of €17,552.2 billion in May, following the temporary decline noted in the prior month. More significantly, corporate credit accelerated for a second straight month, to 4.0% year on year from 3.4% previously, right as the ECB actually raised rates. Household credit continues to accelerate gradually, to 3.10% from 3.00%.
2.3 China
M2 is growing at 8.6% year on year, a stable pace versus the prior month, but the month on month change is minimal, only around 0.18%, suggesting the annual figure largely reflects a base effect rather than fresh monetary expansion right now. Household loans continue to decline. Total Social Financing partially recovered to CNY 2.03 trillion in May, following April's collapse to CNY 620 billion, but remains well below March's level of CNY 5.23 trillion.
2.4 Japan
M2 and M3 both hit new records. Bank lending accelerated to 5.7% year on year, the fastest pace since March 2021, led primarily by major banks, whose lending is growing at 8.7%. The contrast with the monetary base, contracting at an accelerating minus 13.70%, remains the sharpest divergence anywhere in this edition.
Block 3: Net Financial Liquidity and Its Relationship to M2
Net Fed Liquidity (NFL), calculated as the Fed's balance sheet minus the TGA minus RRP, stands at $5.843 trillion as of July 1, 2026. The indicator has moved out of the active recovery regime seen after the tax season in the prior edition, and since late May has been trading in a narrow band between roughly $5.81 and $5.90 trillion, with no clear direction. The TGA continues to draw down, to $880.2 billion from its June peak of $918.7 billion, confirming the expected seasonal effect. RRP remains essentially exhausted, with recurring technical spikes around each quarter end.
The gap between M2 and NFL keeps widening. While NFL sits still, M2 keeps growing and hitting new records every month. That means bank credit and the fiscal deficit, not the federal balance sheet, are carrying the weight of monetary expansion right now.