

August, viewed from October
This issue examines the eurozone in August 2026, using information available through 17 October. The core monthly releases are in, although official August services output is still missing. September inflation, the ECB’s interest rate decision and its October analysis show how the story developed after the reporting month. They are subsequent evidence, rather than August results.
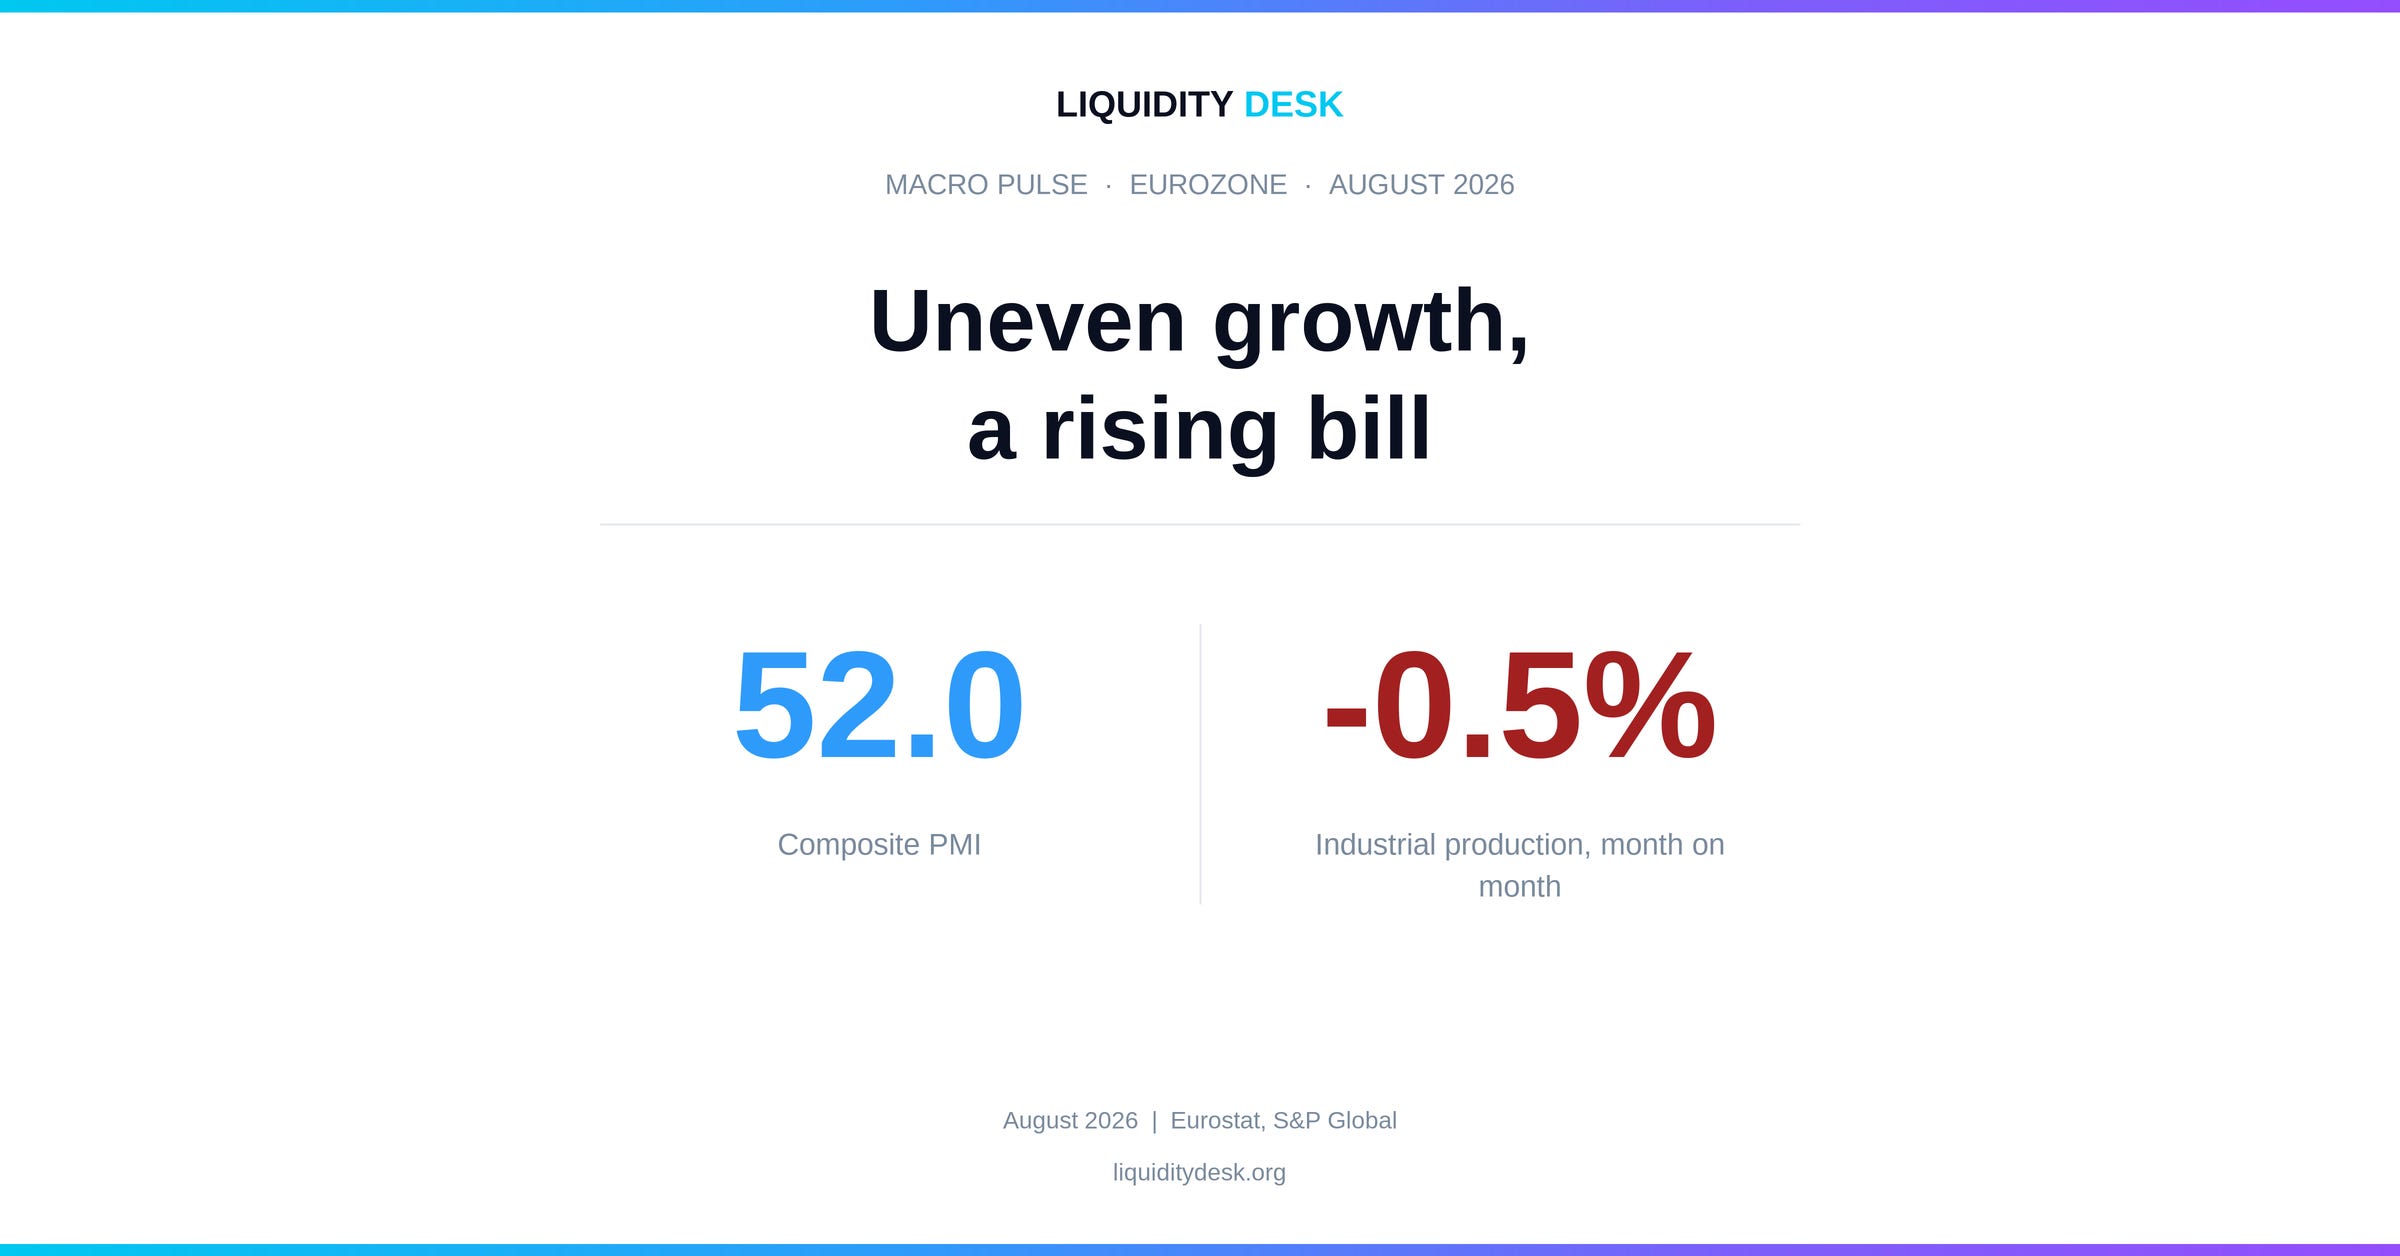
An economy growing unevenly
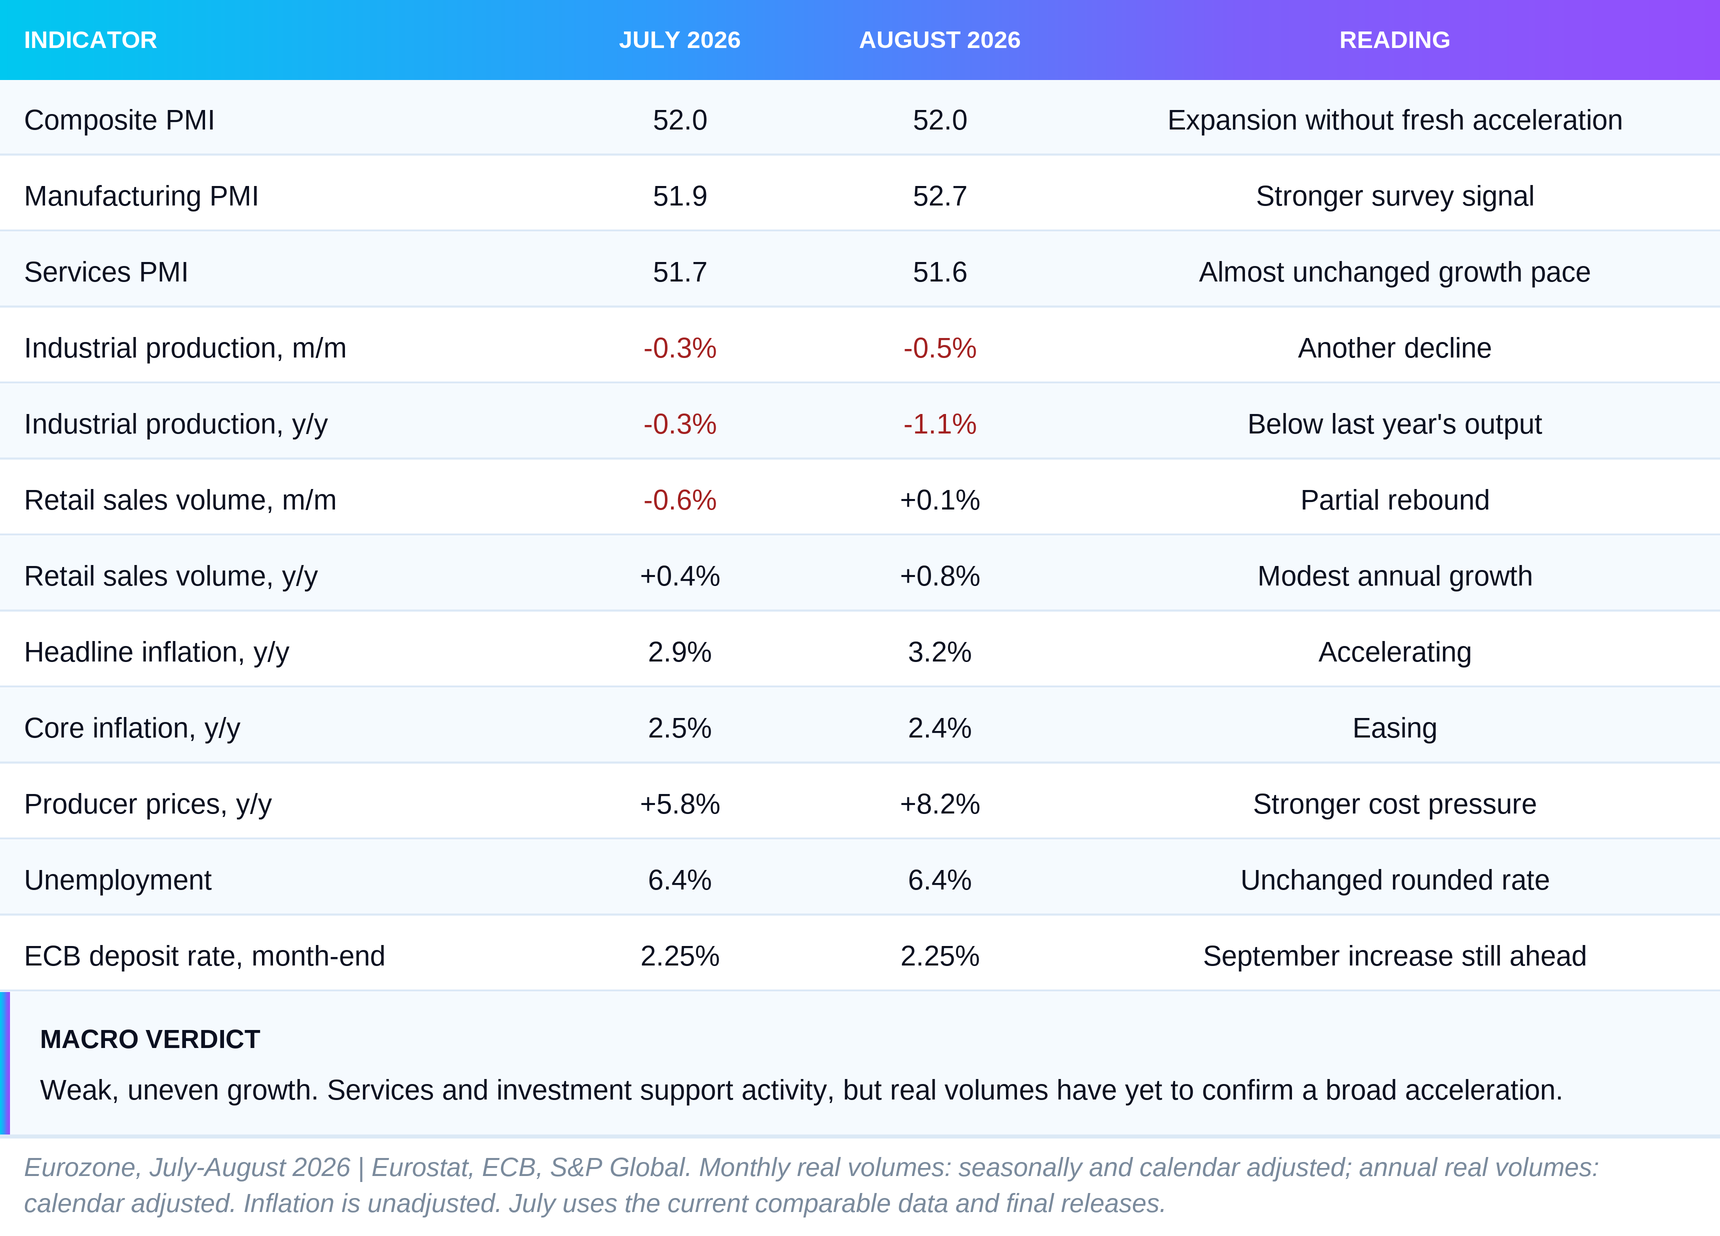
Our working assessment is weak, uneven growth, without confirmation of a broad acceleration. Services and parts of investment are supporting activity, while industrial production and household purchases remain subdued. Rising energy bills and more expensive finance constrain the recovery. For the European Central Bank, the question is whether price pressure is spreading far enough to justify adding more interest rate pressure.
In July’s analysis, we called the picture stagnation. August failed our pre-announced test for acceleration because industrial output fell again. Yet industry is only part of the economy, and the positive services signals deserve more weight than we gave them then. Failing our acceleration test does not establish that aggregate growth was zero.
The monthly figures expose the difference. The composite PMI, a survey of changes in current business activity, stayed at 52.0. A reading above 50 signals expansion. Industrial production nevertheless fell 0.5%, while retail sales rose just 0.1% after July’s decline.
There are identifiable sources of resilience. Digital services, investment associated with artificial intelligence and public spending support activity. Some additional borrowing, however, pays larger bills rather than expands productive capacity. Credit growth alone cannot settle the argument.
Prices also send a mixed message. Headline inflation rose to 3.2%, while core inflation eased to 2.4%. That supports a conditional case for waiting after September’s rate increase. The central question is how long the economy’s growth engines can keep paying the rising bill.
The main indicators
The direction becomes clearer over time
Business surveys recovered from the spring shock, but measured output and purchases did not follow convincingly. We compare August with February, six months earlier, and May, three months earlier, so that a single better month cannot erase the weakness that preceded it.
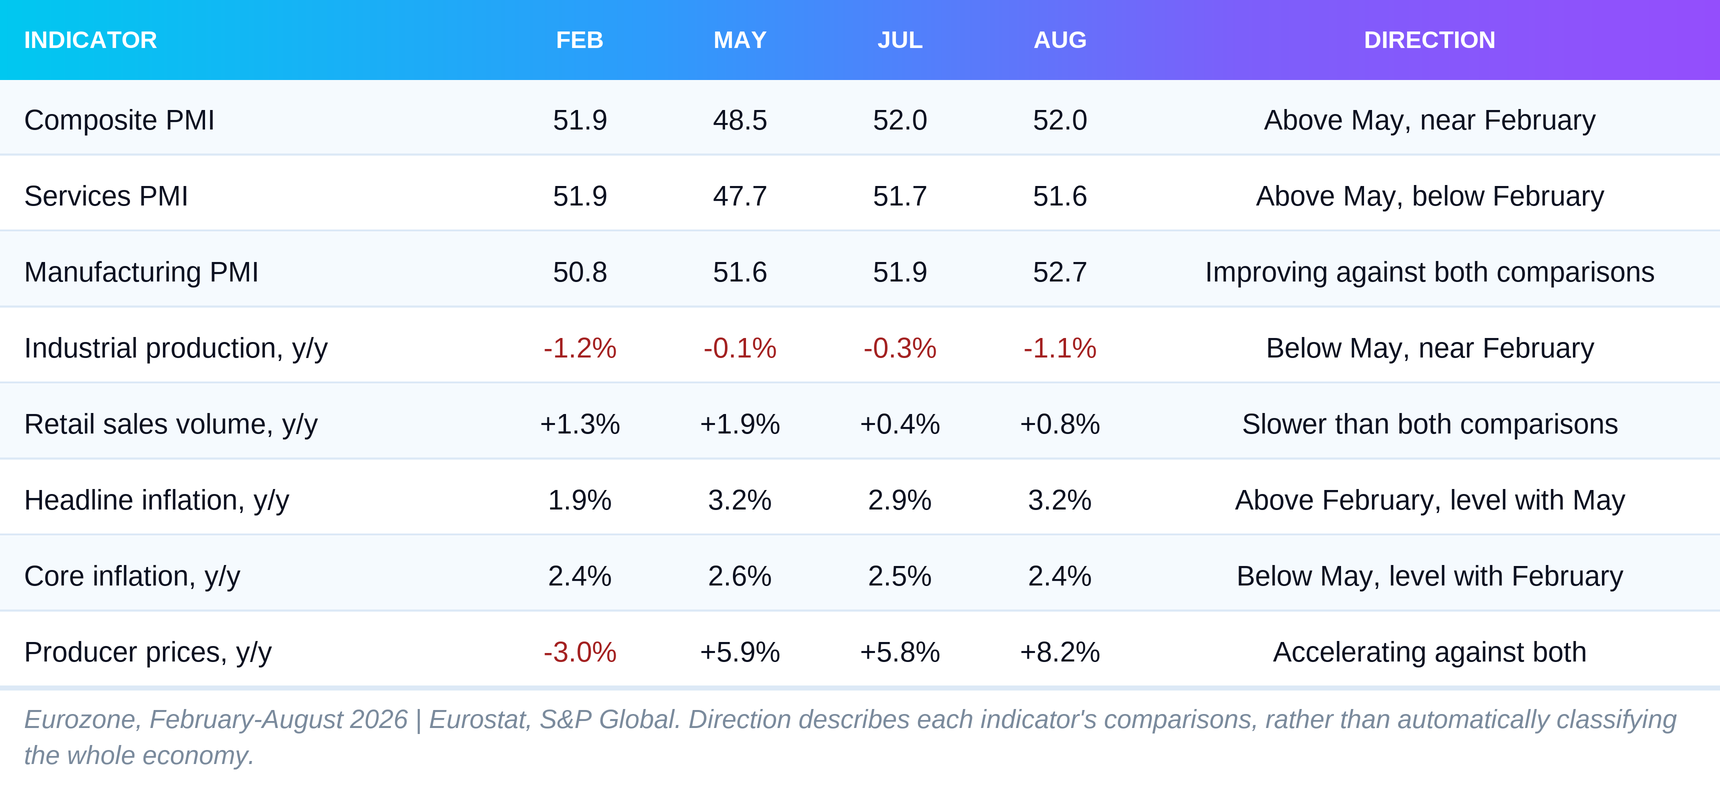
Three divergences matter. The first is between services and industry. Services returned to survey expansion after the spring decline, but their activity reading was still below February’s. Manufacturing surveys improved more clearly, even as recorded production fell again. Differences in coverage, the mix of firms and measurement dates can help explain the gap. They do not justify dismissing either source.
The second divergence is between August’s small retail rebound and the weaker medium-term trend. Purchases remained below June’s level after July’s fall and August’s gain. A positive monthly sign does not mean households have recovered the purchasing power they lost.
The third concerns prices. Producer costs are accelerating sharply, yet core consumer inflation is not following them. The question for the coming months is whether firms can pass on more of the bill or whether weak sales force them to absorb it.
The quarterly backdrop also argues against a hasty verdict of economy-wide contraction. The current estimate puts real GDP growth in the second quarter at 0.6% from the first. The ECB’s measure adjusting for distortions in Irish data is 0.3%. It does not replace the official figure, but explains why the headline needs care.
Employment grew 0.1% in the second quarter. Negotiated wages rose 2.44% from a year earlier, after a revised 2.59% in the first quarter. These are quarterly supports, rather than measurements of August. Our previously corrected claim that inventories drove second-quarter growth does not return in this account.
What keeps the economy moving
Services are the most important support. The latest official output figure is for July and shows monthly growth of 0.4%. August’s survey remained in expansion. These are different sources for different months, but together they make a stronger case for continuing activity than the industrial aggregate alone.
In an economy with a large services sector, weakness among goods producers can coexist with overall growth. The issue is whether orders and revenue elsewhere can compensate. August’s surveys give us reason to keep that possibility central while we await official volumes.
There is a more specific story within services. The ECB’s October analysis highlights digital activity, investment in artificial intelligence and demand for European components and equipment serving that investment. Europe supplies and adopts these technologies, although its investment wave is smaller than America’s.
Capital goods production rose 0.4% in August. That is consistent with resilient investment segments, but it cannot all be attributed to AI: the statistical category covers much more than technology equipment. We have no measured August contribution from AI to aggregate growth, and do not need to invent one to explain the mechanism.
Fiscal policy is the second support. German defence and infrastructure programmes and spending under Next Generation EU sustain demand. This is support across the year, rather than a quantified August effect. It is also temporary: the ECB expects fiscal support to weaken after 2026.
The two engines have different staying power. A public contract can fill a production schedule, but depends on budgets and execution. Technology investment can sustain demand for longer, but depends on expected returns, available funding and confidence that new equipment will be used. Announced spending is not output already delivered.
Funding sources matter too. In the ECB’s survey of planned AI investment, most firms intending to invest expected to use internal funds. A strong balance sheet can allow one business to invest even as bank finance becomes more expensive. Another, dependent on new borrowing, will react more quickly to interest rates.
This helps explain why particular activities can look strong while the broader economy still struggles to find support. The engine is real, but unevenly distributed. The best confirmation would be growth spreading into more services and actual purchases, rather than remaining concentrated in a few investment chains.
Durability also depends on what remains after the initial order. Building a data centre creates work now; its continuing contribution depends on subsequent use and the services surrounding it. Buying software can improve a firm’s operations, but the purchase itself does not establish higher productivity. Time and risk separate investment spending from sustainable income.
The benefits must spread too. An equipment supplier can place more orders with its partners and support employment. If that impulse remains narrow, it will not be felt equally in retail, home purchases and other services. We are looking for a stronger connection between investment, labour income and demand, as well as more investment itself.
The bill is rising faster than purchases
August’s European Commodity Snapshot focused on expensive energy even without an immediate physical shortage. The new macroeconomic releases show how that problem reaches the external balance and household budgets. Available supplies and affordable supplies are different conditions for recovery.
The seasonally adjusted goods trade balance deteriorated to a deficit of EUR 6.8 billion in August, after July’s EUR 1.4 billion surplus. Our older July article reported a larger surplus; this comparison uses the revised figures. Exports fell 1.2% on the month and imports rose 2.0%.
Energy is an important part of the story. August’s energy deficit reached EUR 26.7 billion, compared with EUR 21.3 billion a year earlier. But the deterioration extended beyond fuel: machinery and vehicles also moved from a surplus to a deficit compared with the previous year.
These flows are measured in current euros. Higher imports can reflect prices, quantities or a different product mix. The nominal balance cannot be translated directly into a real GDP contribution. Despite the weak August result, exports over June-August exceeded the preceding three months. External demand is not undergoing a one-way collapse.
The household constraint appears in purchases. Non-food sales grew in August, but total retail volume barely moved. Retail excludes many consumer services and therefore does not measure all household consumption. It still shows how fragile the recovery in goods purchases remains.
The labour market is a buffer for now. Unemployment stayed at 6.4%, but the number of unemployed people increased by 26,000 on the month behind that unchanged rounded rate. This does not establish a sharp labour market reversal. It does mean that one decimal place offers no guarantee of calm.
There is also evidence against an excessively bleak household reading. Nominal disposable income continued to grow in the second quarter, while the saving rate fell from 14.6% to 14.4%. Lower saving can support some spending. That option is very different for a household with accumulated reserves and one already financing daily expenses with debt.
The brake has both cyclical and structural elements. The energy price surge and the effect of interest rates can ease. Dependence on imported energy, supply contracts and countries’ different energy mixes change more slowly. A lower interest rate can reduce a loan instalment, but cannot provide cheaper deliveries through the Strait of Hormuz.
Releasing the brake therefore requires more than an ECB decision. Energy must become more affordable, incomes must catch up and sales must justify investment. Until these conditions improve together, firms and households will experience growth very differently.
There is an external dimension too. When the region pays more for necessary imports, income that could have supported domestic goods, services and investment goes to overseas suppliers. That can depress growth even if the quantity of energy imported holds steady and production continues uninterrupted.
Fiscal compensation can redistribute this loss, but cannot remove it for the economy as a whole. Supporting the most affected households can preserve essential purchases. Broadly offsetting every price increase, however, also sustains the demand the central bank is trying to cool. The difficulty is helping vulnerable households without making the cost pressure more persistent.
Higher inflation, different sources
Headline inflation accelerated in August, but its composition matters more than the aggregate. Energy prices rose 14.3% from a year earlier, after 10.3% in July. Services inflation slowed from 3.3% to 3.0%. This was not a simultaneous acceleration throughout the consumer basket.
Core inflation, which excludes energy, food, alcohol and tobacco, also eased. For the central bank, it is evidence of how far the shock has travelled beyond directly affected prices. One softer reading does not mean the delayed transmission is over.
Producers face much stronger pressure. Industrial producer prices rose 8.2% annually, with their energy component up 21.0%. Excluding energy, the increase was 3.4%. The contrast identifies where the shock is concentrated instead of suggesting that every firm faces the same cost increase.
The gap between headline producer and consumer inflation is 5.0 percentage points. It is neither a ready-made forecast of future inflation nor a measure of business profits. The indices have different baskets and weights. Industrial producer prices exclude consumer services and do not measure import prices.
What matters is the response between a firm’s costs and its sales. A business with strong orders can raise prices. A business facing weak sales may accept lower profits, cut production or postpone investment. Those responses have different consequences for inflation, employment and growth.
The ECB’s newer analysis of gas and electricity clarifies the timing. National central banks expect wholesale gas price changes to reach consumer gas inflation within 1-3 months in more than half the euro area, measured using the consumer index’s weights. Electricity transmission is much more dispersed and can take up to two years.
Contracts, regulated tariffs and taxes change the speed. More renewable generation weakens the link between gas and electricity prices, with different effects across countries. A single timetable for every energy bill would conceal precisely what determines when households feel the shock.
Inflation expectations also warrant attention. The ECB’s August survey recorded a rise in expected annual inflation three years ahead, from 2.7% to 2.9%. This is the median, the midpoint of the ordered responses. That is not realised inflation, but shows how persistent households expect the price increases to be.
September’s subsequent check is less comfortable: headline inflation reached 3.8% and core 2.5%. August’s easing in core did not become a continuous downward trend. We still need to distinguish direct energy inflation from a broader, sustained acceleration in other prices.
Slower inflation does not restore old prices either. It means the next increase is smaller, while households continue paying the level already reached. Real consumption depends on income catching up with cumulative price increases. Lower core inflation and weak purchases can therefore coexist without contradicting each other.
AI, orders and the price of money
Europe’s AI sector is usually discussed as a story of falling behind. The more useful question here is how the same global boom can support European growth and make it harder to sustain.
The positive connection runs through investment, digital services and equipment suppliers. On 13 October, ECB Chief Economist Philip Lane said AI accounted for roughly a quarter of recent growth in lending to firms. That is a share of credit growth, not of all outstanding loans, and is not a separate August statistical series.
The negative connection runs through the global cost of long-term finance. Large investment requirements and expectations of future productivity gains are plausibly contributing to higher global interest rates. European bond markets feel the movement even though the domestic investment boom is smaller.
A European company outside the technology supply chain can face more expensive finance without receiving additional orders. A supplier of data centre equipment may tolerate the same higher rate because it expects more revenue. Both operate in the same economy, but the cost of money affects them differently.
This does not establish that AI explains the entire rise in yields. Inflation expectations, government budgets and perceived risk also matter. It is a contributing mechanism, rather than the sole cause of every market movement.
The implication for the ECB is practical. If long-term finance is becoming more expensive because of external forces, some cooling of demand arrives without another change in the deposit rate. That belongs in the assessment of the next decision.
Technology investment can pull the economy forward while the financing of the global boom raises the bill for everyone else. Strong investment segments therefore do not guarantee an even recovery.
What this means for the ECB, credit and households
August’s picture leaves the ECB balancing resilient activity against the energy shock’s effect on income. There are engines capable of sustaining demand. At the same time, a larger imported energy bill takes money away from other spending. The same supply shock raises prices and weakens parts of demand.
The deposit rate was 2.25% in August. On 10 September, the ECB raised it to 2.50%, effective 16 September. Weak August volumes cannot therefore be a consequence of that decision. They describe the economy on which it begins to act.
Our reading favours cautious waiting after September’s increase, provided price pressure remains limited outside energy and expectations do not deteriorate further. This is a conditional analytical judgement, not a promise of a pause. Broader acceleration in prices and wages would strengthen the case for further tightening.
In her 17 October statement, Christine Lagarde emphasised that higher long-term rates were already tightening conditions, while energy transmission beyond that built into the projections remained contained. Policy must account for the cooling that markets are already delivering.
Monetary quantities do not send an unambiguous easing signal either.
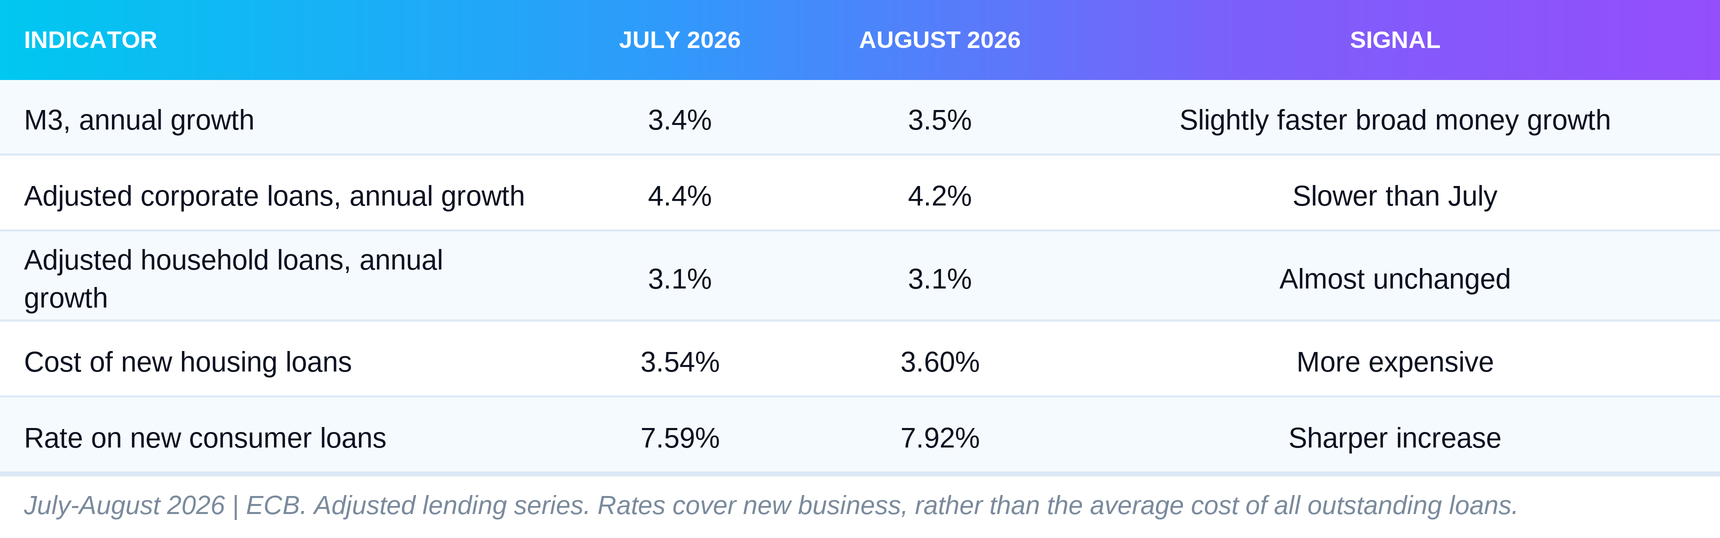
M3 includes money and closely related short-term instruments. Faster growth in that aggregate can coexist with slowing corporate lending and more expensive loans. Banks’ reserves at the central bank are a third, distinct quantity. A decline in reserves alone does not establish a mechanical constraint on lending: loan demand, risk and bank capital matter too.
A bank can have enough funding and still decline a loan if it expects a customer’s sales to weaken. A firm can have access to credit and choose not to use it because the project no longer covers the higher interest cost. Money available within the financial system is not money equally accessible to every borrower.
The composite cost of new corporate borrowing was 3.77% in August. Behind the average sit different businesses and needs. One company borrows to expand capacity; another finances deliveries before receiving the proceeds from sales. Similar credit growth can accompany very different economic strength.
September’s Credit Pulse found European credit markets calm at its observation date. That does not mean cheap loans. A credit spread is the risk premium over the underlying yield. The final borrowing cost can rise even if that premium remains small.
October’s liquidity review likewise showed that the different channels were not moving together. Those thematic signals have their own dates and markets. They help explain why difficulties can emerge first among particular borrowers before there is a general credit shortage.
For households, the effects meet in the monthly budget. Energy absorbs more income, a new mortgage costs more and purchases on credit become harder to afford. For firms, the issue is whether additional sales cover both energy and finance. Growth can continue even as more participants find that less money remains after the bills.
What could change this reading
The strongest case for a better picture is that services already support broader growth than industrial data reveal. If official services volumes confirm the surveys and investment orders spread across more activities, our description of weak growth will prove too cautious.
Budget execution can also surprise positively. Faster infrastructure projects and investment funded internally could allow activity to withstand higher rates. Cheaper energy would release income for other purchases without requiring immediate ECB easing.
The less comfortable scenario is persistent cost pressure alongside weaker orders and consumption. More credit growth would then pay rising bills instead of financing future output. A weaker labour market would remove one of households’ main buffers.
Broader energy transmission is another risk. It would limit the ECB’s freedom to wait even as activity weakened. Conversely, persistently soft demand could restrain selling prices, at the cost of lower profits and postponed investment.
Our article “Rate hikes don’t open Hormuz” explains this conflict, including the differences from 2011. The historical comparison is useful as a warning about a mechanism, rather than a prediction that a debt crisis must repeat.
The next volume releases must show which risk dominates. If only the strongest segments keep expanding, the gap between the aggregate result and households’ experience will remain wide.
What to watch
On 27 October, the third-quarter bank lending survey and September monetary data will show whether credit access tightens and corporate lending slows further. The ECB’s 29 October decision will test our case for waiting and the weight it gives to long-term rates.
Unemployment on 30 October will show whether the rounded rate moves above 6.4%. Producer prices on 5 November provide the next energy cost check; retail sales on 6 November will show whether purchases recover more of their earlier losses.
Official August services output on 9 November will test the strongest support for our current reading. The next industrial production release follows on 16 November.
For a reassessment towards broad acceleration, we retain our declared test: monthly industrial growth above 0.3%, positive retail sales and a PMI above 50, supplemented by confirmation in official services output. Weakness spreading into services would strengthen the case for stagnation or contraction. This is a pre-announced check, rather than a promise that one month automatically defines the entire cycle.
Growth has to pay the bill
The eurozone is moving forward unevenly. Services, technology investment and public spending provide support, while industry and household purchases remain fragile. Energy and finance raise the cost of that progress.
We do not yet know whether the growth engines can broaden the recovery enough to offset pressure elsewhere. One strong segment and one positive lending rate do not answer that question. The answer must come from broader real activity and incomes that leave more money after the bills. Until then, the ECB’s caution also depends on how much cooling prices themselves are already causing.
Sources
S&P Global, final August composite, services and manufacturing PMI releases (1); S&P Global, final August composite, services and manufacturing PMI releases (2)
ECB, key interest rate history and 10 September decision (1); ECB, key interest rate history and 10 September decision (2)
Eurostat, current real GDP series; ECB, September projections and Ireland adjustment (1); Eurostat, current real GDP series; ECB, September projections and Ireland adjustment (2)
Eurostat, employment; ECB, negotiated wages (1); Eurostat, employment; ECB, negotiated wages (2)
Philip Lane, Diagnostic Challenges for ECB Monetary Policy, 5 October
ECB, How firms are planning to finance AI adoption, 2 October
ECB, second-quarter household and corporate sector accounts, 2 October
ECB, statistical release and monetary policy meeting calendars (1); ECB, statistical release and monetary policy meeting calendars (2)
Not financial advice
Liquidity Desk | liquiditydesk.org