Macro Pulse | U.S. Flash PMI + Money Supply | June 23, 2026
The Numbers Look Good. The Internals Do Not.
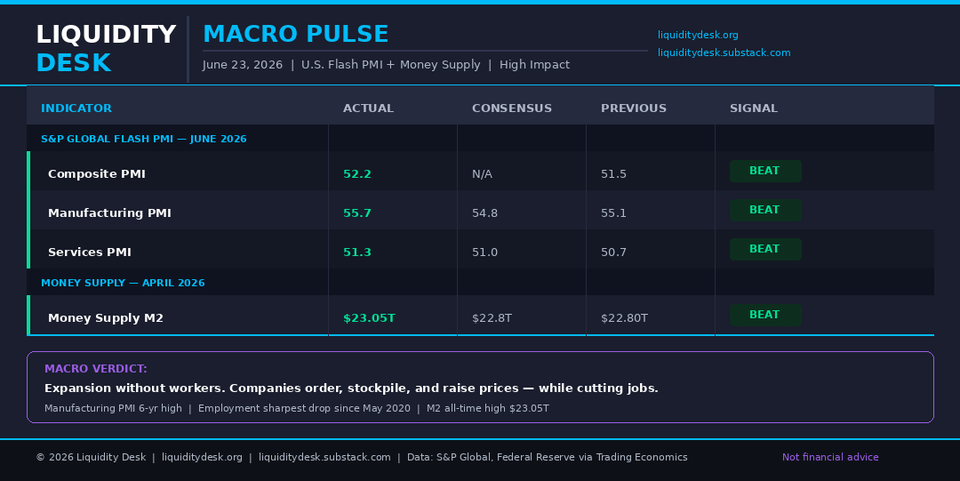
The June flash PMI readings came in above consensus across the board. Composite at 52.2. Manufacturing at 55.7, a six-year high. Services at 51.3. On the surface, this is a resilient private sector. Look inside the numbers and a different story emerges.
Key Data
Manufacturing printed 55.7 against a 54.8 consensus, the strongest reading since May 2022. New orders posted the largest surge since April 2022. Input inventories recorded their second steepest rise in survey history. Output accelerated. The headline looks unambiguously strong.
But manufacturing employment fell at the sharpest pace since May 2020. That was the month the US economy lost 20 million jobs during the pandemic lockdowns. Companies are expanding order books and building stockpiles while simultaneously cutting their workforce. Those two things do not normally happen together.
Services printed 51.3, just above the 51.0 consensus. The sector is expanding, but the S&P Global report notes firms are citing high prices, elevated interest rates, and weak confidence as the operating backdrop. Services input cost inflation reached a six-month high. Selling price inflation hit an eleven-month high. Employment in services fell for a second consecutive month.
The Composite reading of 52.2 is the sharpest pace of private sector growth since January. S&P Global attributes part of the services lift to front-running of Fifa World Cup contracts. That is not organic demand. It is a scheduled event creating a temporary pull-forward in services activity.
Money Supply M2 came in at $23.05 trillion for April, an all-time high. The previous reading was $22.80 trillion. The consensus forecast was $22.8 trillion. Liquidity in the system is expanding.
The Standout Detail
Manufacturing employment just posted its worst reading since May 2020, in the same month that manufacturing output hit a six-year high. This combination has a name. It is called productivity-driven cost cutting under uncertainty. Companies are running their existing workforce harder, adding inventory as a hedge against further supply disruptions from the Middle East conflict, and refusing to commit to new headcount because the demand outlook beyond the next quarter is genuinely unclear.
Supply chain delays lengthened at the most significant pace since August 2022, per the manufacturing report. That is not a sign of healthy demand pulling product through the system. It is a sign of disruption pushing companies to front-load purchases before conditions worsen. The inventory build is defensive, not expansionary.
Meanwhile, the M2 all-time high of $23.05 trillion tells you that monetary conditions are not tight in aggregate. Liquidity is growing. But that liquidity is not reaching workers. It is sitting in corporate balance sheets being used to fund inventory accumulation and price increases, not hiring.
What Does This Mean?
The Fed is watching a PMI composite above 52 and an M2 at a record high. Neither number gives the committee room to cut rates. Composite above 50 signals expansion. M2 growth signals that financial conditions, whatever the funds rate says, are not restrictive enough to compress demand.
At the same time, the employment sub-indices are deteriorating. Manufacturing jobs falling at the fastest pace since the pandemic. Services employment contracting for two straight months. The labor market is softening from the inside, not from the headline unemployment rate, which is the number most people watch.
This is the Fed's dilemma made visible in a single data release. Activity indicators are green. Price indicators are rising. Employment indicators are red. Cutting into this configuration risks validating inflation expectations that are already elevated. Holding risks accelerating the labor market deterioration that is quietly building beneath the surface.
Selling price inflation in services just hit an eleven-month high. That number feeds directly into the PCE inflation data the Fed targets. A services sector raising prices while cutting workers is not a sector returning to equilibrium. It is a sector managing margin pressure by passing costs to consumers and reducing payroll simultaneously.
The M2 record reinforces the picture. Monetary expansion at the aggregate level is running alongside a tightening of real economy conditions for workers. The liquidity is not neutral. It is distributing unevenly, inflating asset values and corporate inventory hedges while wage growth faces headwinds from the employment contraction.
What to Watch
The June jobs report, due in early July, is now the critical data point. If the employment weakness visible in the PMI sub-indices translates into a meaningful miss on Non-Farm Payrolls, the Fed's already difficult position becomes untenable. A weak jobs number with services inflation at an eleven-month high is not a configuration that admits an obvious policy response.
Watch also whether the inventory build in manufacturing reverses in July data. If companies are stockpiling defensively ahead of Middle East supply disruptions, that inventory will eventually become a drag once supply normalizes or demand softens. The front-running that inflated Q1 factory orders and Q2 manufacturing PMI has a reversal built into it.
The picture being assembled across 2026 is consistent. Growth metrics that look adequate at the headline level. Price pressures that remain above target. And now a labor market beginning to crack at the edges while the headline unemployment rate holds steady. The Fed has no clean move. It has a PMI above 52, an M2 at a record, and manufacturing employment falling at the fastest pace in six years.
That is not expansion. That is substitution. Capital for labor, inventory for confidence, price increases for volume growth.
Member discussion